These maps have been released publicly via video, so I’ll go ahead and post them here to go along with a more technical explanation and commentary on what I’m thinking and where I’m most worried:
Temperatures (December-February):

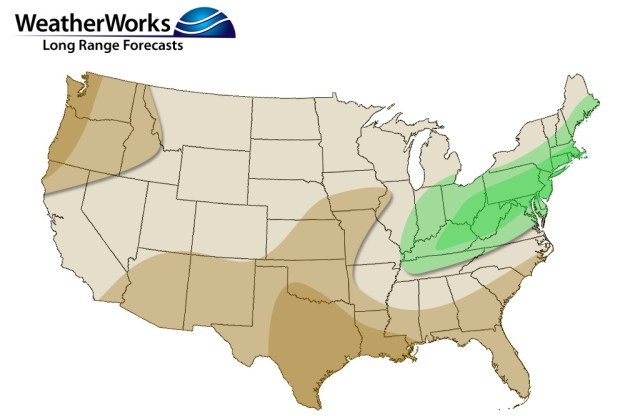
Precipitation (December-February):
Snowfall (first to last flake):

Since I’m using the maps I created at work, for clients on company time, I’ll “plug” our YouTube video…I take no responsibility for the extra glamor (the thumbnail and emojis), but the maps, anything in this post, or anything I verbally say in the video are all fair game to comment about. Here’s the link to the video (the intended audience is the general public, so very minimal technical talk)… https://www.youtube.com/watch?v=ehVCUa24XCQ
Before getting any farther, a few of the odder acronyms used multiple times:
PMM: Pacific Meridional Mode (off-equator water temperatures)
IOD: Indian Ocean Dipole (a positive IOD has warmer waters in the western Indian Ocean and cooler waters closer to Australia and Indonesia)
QBO: Quasi Biennial Oscillation (a pattern of westerly and easterly winds in the stratosphere that impacts the polar vortex in winter, and also can interact with tropical thunderstorms by influencing the temperature at the tropopause and modulating instability)
“Low Pass” signal: The longer-duration tropical forcing pattern (standing waves as opposed to something that propagates like the MJO)
MJO: Madden Julian Oscillation, an eastward propagating pattern of enhanced thunderstorms that can influence the pattern globally.
As for the discussion, the general ideas used earlier in September to gather some analogs still largely hold…those ideas were:
- ENSO: Neutral, though can allow for weak El Nino or weak La Nina if the year featured warmer waters near the dateline. Extra preference if coming off of a weak or moderate El Nino the prior winter-spring.
- PDO: Neutral or positive (it’s positive right now though not strongly)
- QBO: Positive trending negative, expecting the 30mb winds to flip to negative at some point in the early to mid-winter
- Solar: Minimum
- Indian Ocean: Positive IOD in the fall, can trend downwards during the winter
- Off-equator Pacific SSTs: A positive to strong positive PMM (it’s very positive right now), with more weight given if it stays positive through winter
- Atlantic: Neutral or positive AMO (it is positive right now though not strongly)
- Tried to find matches based on similar tropical forcing in mid-late summer as this year, though not as strong of a weight.
- Tried to find matches based on years with significant spring/summer high-latitude blocking, though was not as strong of a weight.
As a reminder, the analogs were: 1958-59, 1966-67, 1969-70, 1978-79, 1980-81, 1985-86, 1990-91, 1993-94, 1995-96*, 2003-04, 2004-05*, 2013-14*, 2014-15, 2017-18, with starred representing the highest scoring matches when considering all of the above and getting double weight. That 500mb composite map for DJF looked like this:
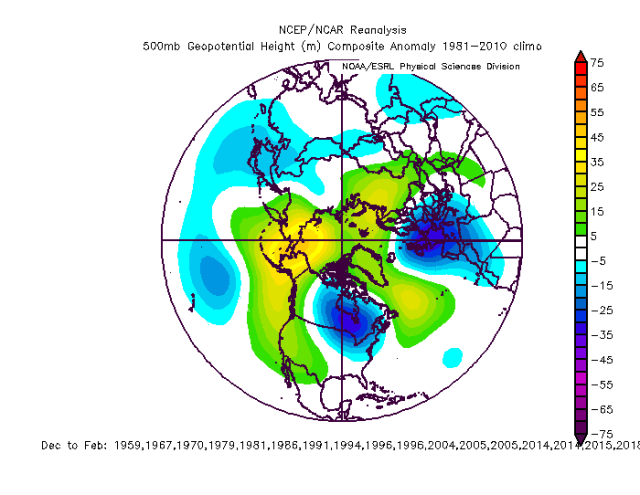
The big stand out features in the analogs were: significant potential for a –EPO, a somewhat +PNA favored with the Aleutian low displaced to the south, mixed NAO signal though at least some potential for a –NAO, and decent potential for a –AO over the course of the winter. The strong signal for a –EPO along with some signal for a –AO does imply increased potential for a cold winter in much of central and eastern North America, with the +PNA favoring a mild winter along the West Coast.
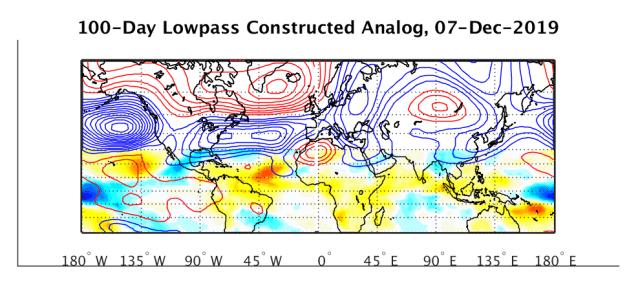
Just looking at the various drivers on their own…a neutral or weak ENSO (likely warm neutral with warmer waters near the Dateline), very +IOD this fall, +PMM, +PDO (that has seemingly trended more positive in September, we’ll see what the monthly value is), descending –QBO with a lingering +QBO in the lower stratosphere, solar min, and the “low pass/lower frequency” signal this summer looking somewhat Nino-ish still with the strongest chi anomalies over the central/eastern Pacific, you get an interesting picture. The lingering +QBO and strongly +IOD/Modoki-ish look, along with the ongoing signal in the tropics late summer/early fall, support the most active convection occurring outside of the West Pac warm pool (so, outside of phases 3-6 of the MJO) heading into winter…meaning it would be most favored/active in phases 8, 1, and 2. We already are seeing this now, with tropical forcing most active over Africa and the western Indian Ocean, with some of the longer range models (EPS and CFS) showing signs of life over the central Pacific in a few weeks. Here is a look at the “low pass” signal via velocity potential/chi anomalies since July 1st:
 Here are the CPC’s 200mb height composite anomalies for phases 8 and 1 of the MJO in December-January-February:

During winter, phases 8/1 of the MJO are both cold. The analogs are overall somewhat chilly for December in the central/eastern U.S. (though in general, January and February are the coldest months compared to normal in the composites), and this is generally done via PNA/EPO ridging in December in the analogs with a +NAO for December in the mean. Interestingly, a Phase 8 MJO in DJF strongly favors a –NAO…given the lower frequency signal appears to involve over the western Indian Ocean, Africa, and the central/eastern Pacific, perhaps that’s why Paul Roundy’s low pass analogs show a strong –NAO signal (and somewhat of a -EPO signal) heading into December:
Phase 1’s composite looks more like the analog composite for December, with any cold coming from PNA/EPO ridging more so than a –NAO. Given the propensity for a –NAO over the last several months, SSTs in the tropics potentially favoring convection in an area that teleconnects to a –NAO in winter, and current low-pass signal analogs also suggesting the same, it seems there are multiple signals pointing to the possibility for NAO help as early as later in November and December. The analogs and tropical SSTs, along with to some extent the same low-pass analog posted above, also suggest potential for a +PNA/-EPO as early as later November or December. Quick Siberian snow cover advance, favoring a stronger Siberian high and positive East Asian Mountain Torque events and subsequently an Aleutian low may also enhance the potential for a +PNA/-EPO to start winter.
Several other well-respected long range forecasters have mentioned the potential for winter to “start early” this year in the eastern U.S. (and if the NAO is involved, Europe) compared to most recent winters…if the tropical signal (driven by the strong +IOD, lingering Nino 4 warmth, and to some extent the +PMM and AMO) is not strongly disrupted at the wrong time by intra-seasonal variability (such as an amplified MJO passage through phases 3-6, or a negative East Asian Mountain Torque), then there appear to be multiple reasons for optimism as early as late November or December, with some signal for both +PNA/-EPO ridging and perhaps a –NAO. Assuming the lingering +QBO in the mid and lower stratosphere, strong +IOD, Nino 4 warmth/+PMM, and cooler waters near Indonesia persist over the next few months, the “ingredients appear to be in place” for less convection in the West Pac, suggesting a lessened risk for a destructive MJO passage. We’ll see how the tropics signal plays out as we head deeper into fall.
Heading through winter, a big potential source of uncertainty will be what happens as the –QBO continues to descend in a deep solar min and the +IOD presumably weakens (which is climo for northern hemisphere winter). Unless a stronger move back towards El Nino occurs this fall (still not ruled out with the warmth near/west of the Dateline, though if this occurred it’d very likely only be a weak El Nino), a weakening +IOD and any strat warming events (which may become favored during mid-late winter assuming the –QBO continues to descend when combined with the solar min) may increase the risk for a more amplified MJO in the “unfavorable phases.” So, there likely remains some warmer risk in the eastern U.S. in particular for mid-late winter.
A hat-tip to “Snowy Hibbo” on the 33andrain forum (website: https://longrangesnowcenter.net/) (twitter: @longrangesnow) for inspiring some further discussion on the current disconnect between the tropics and extra-tropics, and how this may tie into the cold December idea in the central/eastern U.S. and also the potential warmer risk later in winter…
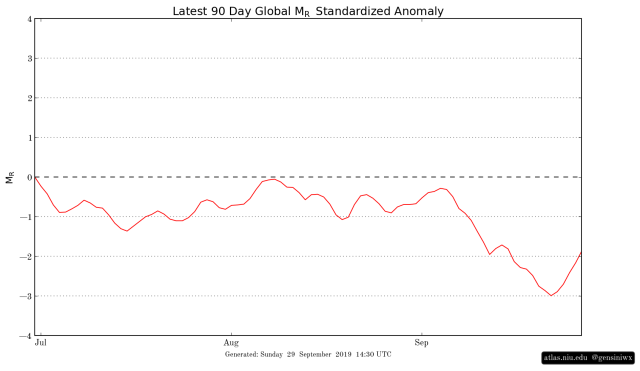
The extra-tropics have been firmly in a more La Nina-like state since late June/early July…the above shows the Global Wind Oscillation since the end of June, and negative values are more characteristic of a La Nina atmosphere. This contradicts the more El Nino like tropical signal (that is evidenced by the chi anomalies and other indices such as the persistent -SOI).
Anecdotally, La Ninas tend to be colder in December, milder in February in the eastern U.S., with El Ninos the opposite. With all of the other factors above, driven by potentially favorable tropical forcing for cold occurring heading into early winter with a La Nina like extra-tropic base, does that add confidence to winter actually starting in later November/December in the east? Also, as the +IOD presumably weakens in winter per climatology as discussed above, does the lingering El Nino state in the tropics also weaken, opening the door to enhanced convection in the West Pac during the mid-latter portions of winter? This would bring that warmer risk to the eastern U.S., and may occur at a time when stratospheric warmings are more favored, which already increases that warmer risk at least temporarily before any SSW/vortex disruption downwells into the troposphere. It seems the interplay between the Nina-like extra-tropics, and Nino-like tropics, and how long the latter hangs on, is a large point of uncertainty for winter forecasts.
It’s worth noting that La Ninas are, on average (with some exceptions to both cases), much colder as a whole across Canada and the northern U.S. than El Ninos in winter, and the forecast temperature map as is would probably fall closer to La Nina climatology than El Nino…so this La Nina element to the pattern may not be the worst thing for a lot of the U.S. if it continues into winter. Many analogs had a similar interplay between a more La Nina-like pattern in the extra-tropics when coming off of an El Nino (or otherwise had Nino 4 warmth), and had cold winters, so this wrinkle isn’t necessarily bad if you want cold and snow in the U.S.
If the Nino base state holds on in the tropics through the winter, the warmer risk in the eastern U.S. may be mitigated a bit. If a strat warming event occurred, there may be additional risk for –NAO blocking later in winter. It bears noting that the monthly analog composite mean has a +PNA/-EPO through March (strongest in January) along with a more –NAO in all three months (compared to December when the composite NAO is positive), with January also having the most –NAO out of JFM (February a close second).
Beginning to tie this into the maps…comments on the temperature: It seems very likely that the Great Lakes and Upper Midwest see a cold winter based on the analogs and presumed tropical signal favoring a –EPO and +PNA this winter. It conversely seems very likely that the West Coast is mild. The East Coast is a mixed bag…perhaps due to being snake bitten last winter, and remembering mid-January-February of 2018, I had a hard time bringing the below average temps for the winter too far southeast. I’m worried a somewhat brief (a couple-few week) period of very mild temperatures is possible as extensively discussed above. However, it can conversely be argued that barring an intra-seasonal very mild pattern that something can argue for colder weather at nearly all points in the winter (and early spring) in the eastern U.S…so if the cold signals trend stronger heading into fall, I may end up bringing below-average temperatures farther southeast. As for the Southeast U.S., due to similar reasoning I currently have somewhat mild temperatures for the winter as a whole, though there is a strongly implied risk for EPO-induced cold shots that can bring wintry precipitation into the Deep South even if the winter averages a bit warmer than average.
As for snow/precip…the analogs strongly suggest a wet/active winter from the Ohio/Tennessee Valleys into the northern Mid-Atlantic and New England. I couldn’t think of a good reason to deviate, though if things trend much colder in the east it would inherently trend drier. The analogs are also generally dry to very dry across much of the southern U.S., especially in Texas. A –EPO would suggest an active northern stream into the Plains, keeping precip from ending up too far below average and likely favoring above-average snow in the Upper Midwest, parts of the Plains and the eastern slopes of the Rockies. The analogs are very dry in the Pacific Northwest and couldn’t find good reason to deviate. Conversely, they lean dry for California and the Southwest but not as strongly as the Pac NW…with a lingering +QBO and El Nino influence to start the winter, along with a very +PMM, there is definitely potential for precipitation/mountain snow in California and the Southwest, especially through the first half of winter. For now went near normal precip/mountain snow in that area…may need to trim the below normal in the Dessert Southwest and perhaps consider above-average for parts of California if the lingering El Nino signal persists through the fall.
