There will probably be a lot of tornadoes from central and eastern MO into western and central IL, with the threat for stronger tornadoes probably maximized in the vicinity of St Louis later this evening. There will also be a ton of straight-line wind damage. A secondary threat for potentially stronger tornadoes is evident from MS into northern/western AL as well later this afternoon/evening.
Pretty impressive model agreement on either a line, or a mixed arc of bowing segments and some embedded semi-discrete supercells evolving from MO into IA and IL this afternoon and evening, with some tendency for more cells towards the southern end of that. Some models keep this activity semi-discrete (or at least maintain decent line breaks) through much of the evening, especially into central/southern IL. This activity will be extremely strongly forced. Most CAMS other than the 3km NAM have a cluster of more weakly-forced convection developing from eastern AR/LA into MS and western/northern AL. Evolutions vary a bit more with that activity, likely due to weaker forcing. There likely will be a relative minimum in severe/tornado potential centered on western TN between these two areas, though some models have more isolated activity trying to play out even there.
3km NAM:
HRRR:
ARW WRF:
NSSL WRF:
They look slightly different but all agree on the overall evolution in both regimes fairly well (sans the NAM in Dixie today). No model is handling the current elevated convection great, though after 20z I kind of like the HRRR’s and NSSL’s reflectivity and overall evolution just a bit more than some others.
You can get the idea that the northern activity in MO/IA/IL is much more strongly forced than the Dixie activity today:
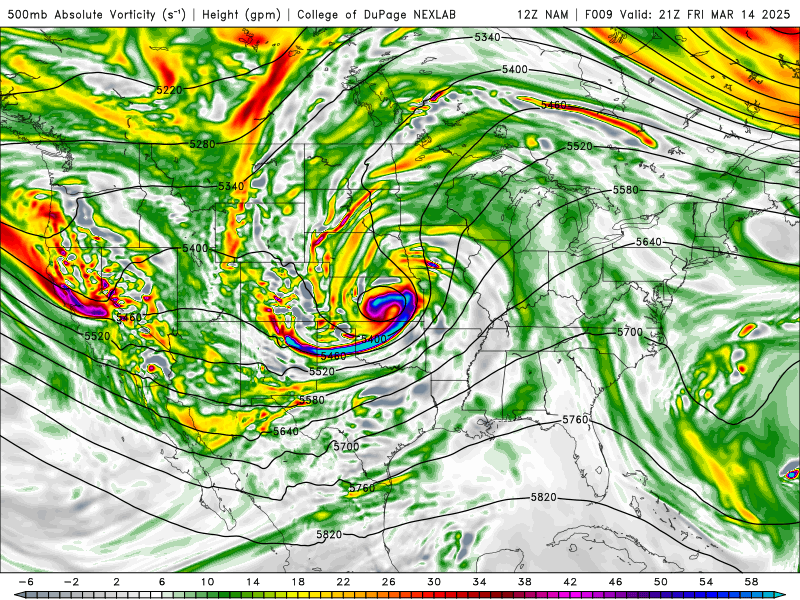
Something to keep in mind, the 500-700mb jet doesn’t really punch into the warm sector in the upper Mississippi Valley until after 0z…so, shear profiles will already be impressive this afternoon and will improve markedly after 0z…500mb:
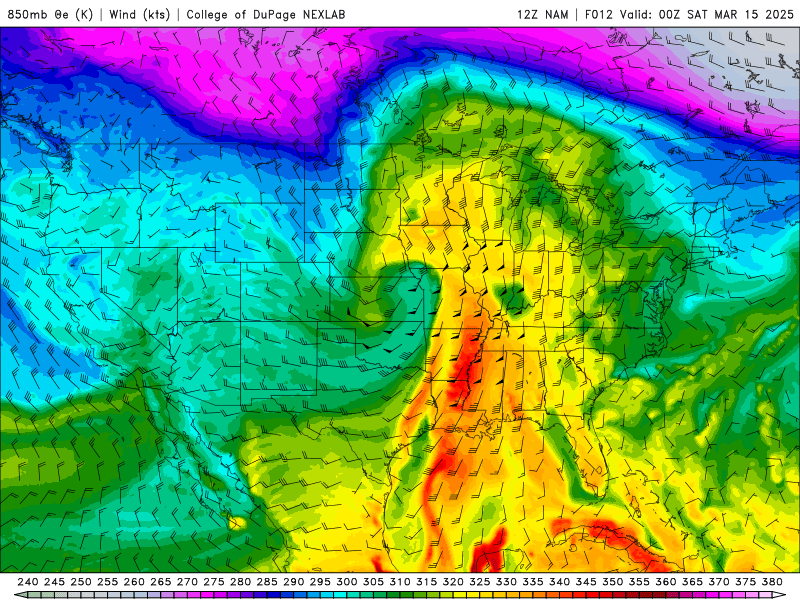
700mb (which is roughly 3km, so think of your 0-3km bulk shear vector for bowing segments and mesovort tornado potential, along with your 0-3km SRH). Low-level shear will be strong in the warm sector this afternoon and explode starting right around 0z this evening:
Activity in the Deep South will be driven largely by a rich low-level jet, though even some of that lifts into the upper Mississippi Valley after 0z:
The strong forcing argues for quick upscale growth in MO, IA, and IL this afternoon and evening, and most of the CAMs above do have a more linear mode than cellular. However, most do have hints of a more semi-discrete mode from east-central MO across central/southern IL and perhaps into far west-central IN. It is in this area where for several hours after 0z the bulk shear vectors are oriented 30-45 degrees across the expected convective line, which does argue for right-moving cells. The forcing is also a bit weaker farther south, which could assist in maintaining a somewhat more discrete mode:
Some maybe representative soundings…from North Central MO late this afternoon:
The shear is quite strong and the thermodynamics are sufficient for severe weather and not prohibitive for tornadoes…however, the thermodynamics could be better (moisture is lacking and warm nose near 700mb) and the low-level flow is fairly unidirectional.
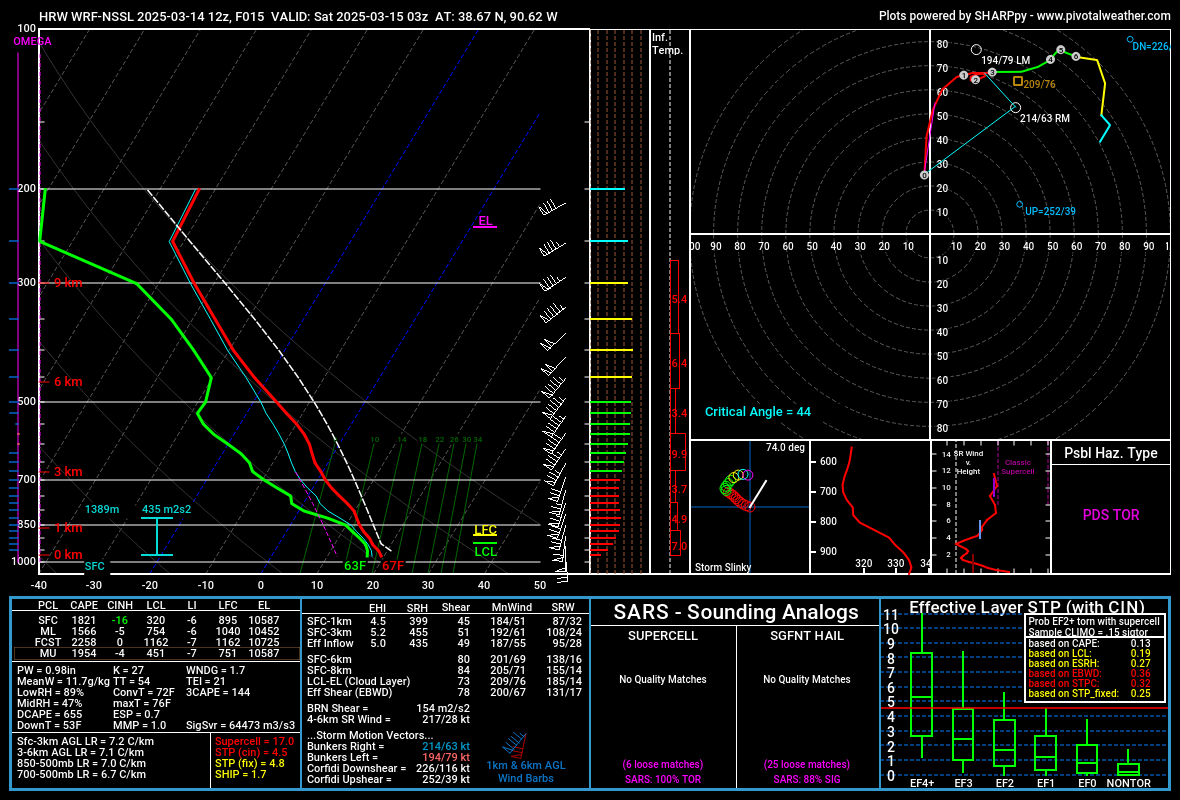
East-central MO later this evening:
While the low-levels aren’t extremely unstable they’re unstable enough, with 1500 J/KG of MLCAPE being fully sufficient for significant severe weather and tornadoes. The low-level flow could still be more backed (and may locally back more than this), though even without it the increased low-level shear after 0z increases effective SRH notably. Any bowing segments in this environment would be capable of swaths of sig wind damage and tornadoes as well…however, the main concern is if semi-discrete cells interact with this environment as some signs point to. Strong tornado potential is evident, though there are subtle limitations which may keep the ceiling for this event from blowing into the stratosphere.
Here’s a look at a sounding in central Mississippi this evening:
Upon clicking around several of these soundings to find representative ones, I found the low-level shear to be best in the Deep South. However, the low-level lapse rates are quite weak with richly moist low-levels. That could be a limiting factor for greater tornado potential…however, the fact that most CAMs have discrete or semi-discrete cells playing out in this environment suggests tornado (potentially strong) potential, even if there are limitations.
Overall, this is probably a threat that will be a little underwhelming through the early evening and quickly ramp up around 0z. Storms this afternoon and early evening will probably be severe with scattered to numerous straight-line wind reports, scattered hail, some significant, and a couple/few tornadoes this afternoon in MO/southern IA…the northern threat likely maximizes starting around 0z, with potential for somewhat more discrete activity on the southern edge of that from east-central MO into central/southern IL. The environment this evening will support widespread/significant wind damage with any bows, along with QLCS tornadoes, with any supercells capable of all hazards including strong tornadoes and potentially significant hail. The tornado threat will gradually decrease with northern/eastern extent into IA, northern IL, southwest MI and across IN, though given the strong low-level shear QLCS tornadoes can’t be ruled out where any surface-based CAPE persists overnight, assuming some organized convection can persist. There may be a relative min in severe coverage in the vicinity of western TN, with a secondary threat area focused on MS and western/northern AL. This southern threat area has tornado (potentially strong) potential, but with some overall limitations.
I think east-central MO into central/southern IL has the greatest severe wx and intense tornado potential overall today and tonight, though there is a much broader area with severe/some tornado potential across MO/IA/IL/southern WI/southwest MI/IN. I could see the coverage of tornadoes and EF-2+ verifying a small 30% hatched area in practically perfect verification in the MO/IL vicinity, though some questions about storm mode, the low-level thermodynamics, and about how backed the low-level flow will be probably puts a lid on how many tornadoes stronger than EF-2/3 we can see out of this setup, which probably makes it hard to pull that trigger (there are better days for it, possibly Saturday). 10% hatched into the Deep South seems warranted given obvious strong tornado potential given the low-level shear and expected storm mode, but with questions about the low-level thermodynamics.
In late December it was laid out why a substantial pattern change was expected to start January, with increased cold and at least some increase in snow across the U.S. and Canada. However, it was a bit uncertain exactly how quickly the pattern would change, how quickly the cold air supply would be able to recharge in Canada, and how quickly the trough axis would settle into the western U.S. Answers are becoming clearer with several systems to track for snow potential through the middle of January along with a blast of legitimately Arctic air into the Lower 48.
This post will at least briefly touch on:
A check in on how the pattern has evolved recently, allowing for winter to finally start on a consistent basis in the Continental U.S. (CONUS) and Canada
Several systems to watch for snow potential across the (CONUS) over the next two weeks
A blast of legitimate Arctic air into the west later this upcoming week (week of January 8th)
A look at what the various large-scale forcing mechanisms/teleconnections may suggest for the second half of January into February
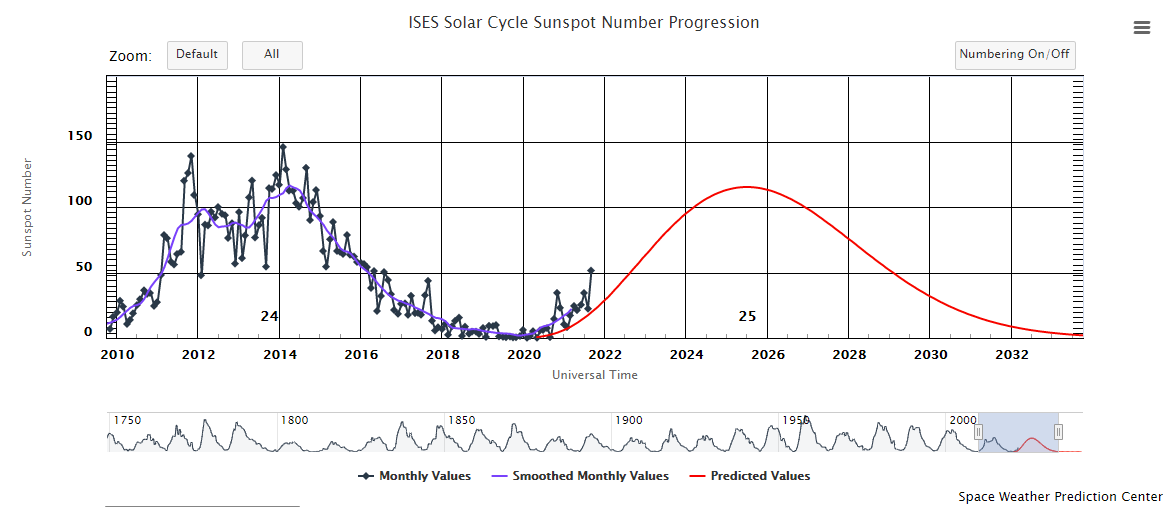
EPS analyzed and forecast 500mb heights from December 30 through January 20. Tropicaltidbits.com
At the start of the loop in the final days of December we still hadn’t shaken the Pacific-dominated pattern. However, the Pacific jet quickly retracted and allowed ridging to build along the West Coast and into Alaska, with a series of wave breaks over the northern Pacific building a block that will retrograde through mid-January. The retraction of the Pacific jet and West Coast ridge cut off the Pacific influence into the CONUS and Canada, and the block will facilitate cross-polar flow into Canada. That is how you quickly re-charge the cold air supply into North America. The downside for snow lovers across the parts of the southern/eastern U.S. is that the bulk of the cold air initially dumps into the west. This happens because the Pacific pattern is quickly retrograding towards a -PNA.
Over the next week a series of wave breaks over eastern North America and the northwestern Atlantic will build an impressive North Atlantic block/-NAO, with the ensembles agreeing the block will retrograde through mid-January. Check out the series of wave breaks over the North Atlantic over the next 10 days, and how each one seems to contribute to building the block/ridge:
European model forecast tropopause pressure through January 15, courtesy WeatherBell
Nearly all -NAO blocks (and north Pacific/-EPO blocks for that matter) are a result of a well-timed wave break occurring, with the blocks lasting longer and having a greater impact on the pattern when the larger-scale forcings are favorable. With an ongoing stratospheric warming event/weak stratospheric polar vortex coupling to the troposphere, recent MJO propagation across the Western Hemisphere, and ongoing negative Rocky Mountain Torque event the large scale forcings all favor blocking across the North Atlantic.
Tropical forcing passed through the western hemisphere and into Africa (phase 1-2 MJO) at the end of December/beginning of January:
This acted to raise heights over the tropical Atlantic, tightening the gradient and speeding up the jet stream across the sub-tropical Atlantic. This is a typical response to MJO phases 1-2:
This increased storminess across the North Atlantic, which is helping to build the -NAO. At the same time, a prolonged negative Rocky Mountain Torque (RMT) event is just getting underway and will continue through mid January. Remember how a positive East Asian Mountain torque can speed up and extend the north Pacific jet? A similar effect can happen across the north Atlantic due to Rocky Mountain Torque, with a negative RMT suggesting a retracting Atlantic jet, favoring the development/persistence of blocking.
EPS analyzed and forecast mean sea level pressure anomalies from January 2-15
Note how early in the loop there was high pressure east of the Rockies, a +RMT. That has already switched to low pressure/a -RMT, which will continue for another week or so. Note the retrograding ridging across the North Atlantic made possible by a weakening of the jet due to the change in tropical forcing and negative RMT. Also note the persistent -EAMT and retracting/retrograding pattern across the North Pacific until close to the end of the loop, supporting the -PNA/western North American trough.
EPS analyzed and mean forecast 250mb winds from January 2-15
The recent/ongoing north Pacific jet retraction and upcoming north Atlantic jet retraction can be seen on the above 250mb wind loop, focusing on the core of the jets. The recent extension of both jets, followed by a retraction and need to disperse this momentum through a series of strong mid-latitude cyclones/wave breaks, was directly caused by recent tropical forcing and mountain torque activity and is a large reason for the upcoming high-latitude blocking across both the Pacific and Atlantic.
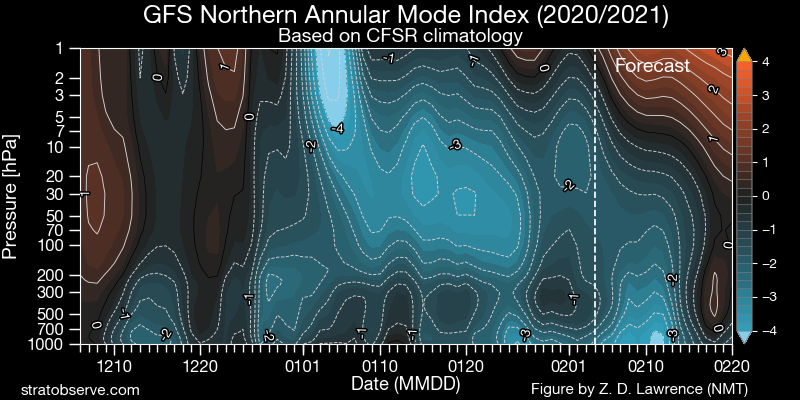
GFS analyzed and forecast Northern Annular Mode (NAM/AO) index time-height plot, courtesy stratobserve.com
The stratosphere has seemingly been influencing tropospheric blocking recently and that should continue given the receptive El Nino/easterly QBO base-state. An ongoing weakening of the stratospheric polar vortex is expected to downwell and help encourage high-latitude blocking in the troposphere for the foreseeable future.
Summing up where we’re at so far: Strong and persistent high-latitude blocking is consistently shown on the ensembles and heavily supported by nearly all large-scale forcing mechanisms. The recent pattern change supports much more polar and arctic influence into Canada and the CONUS. The blocking suggests the arctic air will be dislodged south. The large-scale forcings also support a -PNA and western trough so the bulk of the cold will initially drop into the west. The subtropical jet will remain active.
What does this mean for storm chances and where will it snow?
I know, I know, I buried the lead here. My bad. Storm #1 is this weekend:
RGEM model 500mb height and vorticity loop through Sunday evening
The start of the loop appears to have so much potential for a big, amplified storm. Unfortunately, the trough is not ejecting in one piece. A potent trailing shortwave along with some confluence ahead of the lead shortwave shears it out. The trailing shortwave leads to a prolonged event, especially for southern New England where there may be a bit more interaction between the polar jet energy and the trailing shortwave. In addition to the storm being relatively strung out it’s simply not that cold:
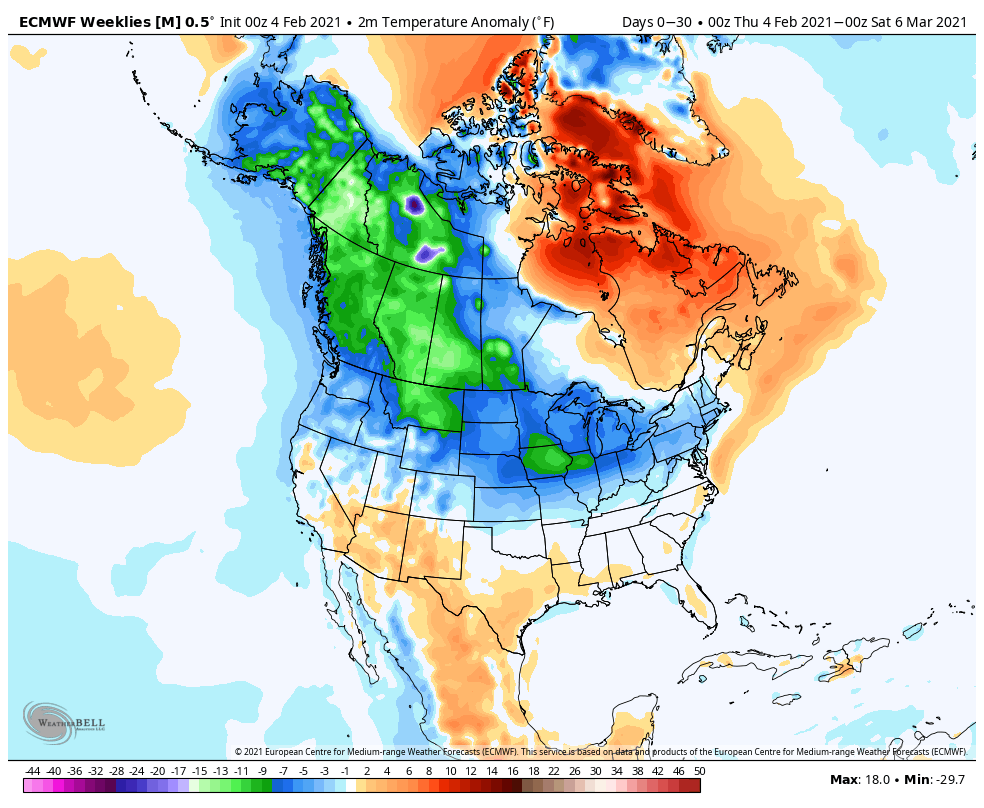
European model 2m temperature anomalies for this weekend, every 6 hours
Heck of a way to run a winter storm, with temperatures at or above average except for where steady precipitation is ongoing during the daylight hours. Since it’s January, the coldest time of the year climatologically, this is still cold enough for snow (and ice farther south) from the mountains in the Southeast into the interior Mid Atlantic and much of the Northeast. There will be a swath of warning-level snow/ice impacts with this storm, though it won’t be a NESIS storm with limited impact to the big I-95 corridor cities from NYC south. The biggest concern will be power outages from ice in the southern Appalachians and heavy wet snow farther north.
The next significant system will be a large Great Lakes cutter January 8-10:
EPS mean forecast 500mb heights and anomalies valid 12z Monday, Jan 8th
This has been telegraphed as a large/strong Great Lakes cutter for quite a while. This will be a dynamic system and will be relatively high-impact. A huge trough ejects in one piece out of the western U.S. with plenty of spacing between it, the departing Northeast weekend storm in front of it, and the next shortwave behind it. Cross-polar flow is building cold air over Canada and some of this will be tapped by the storm as it deepens next week. At this point, the questions are if the blocking ahead of the storm or interaction with the next incoming shortwave behind the storm can lead to a flatter solution and nudge the track slightly farther southeast. To me this seems like it is locked in as a relatively large and strong low…it’s just a question of exactly how strong it gets and exactly where it tracks.
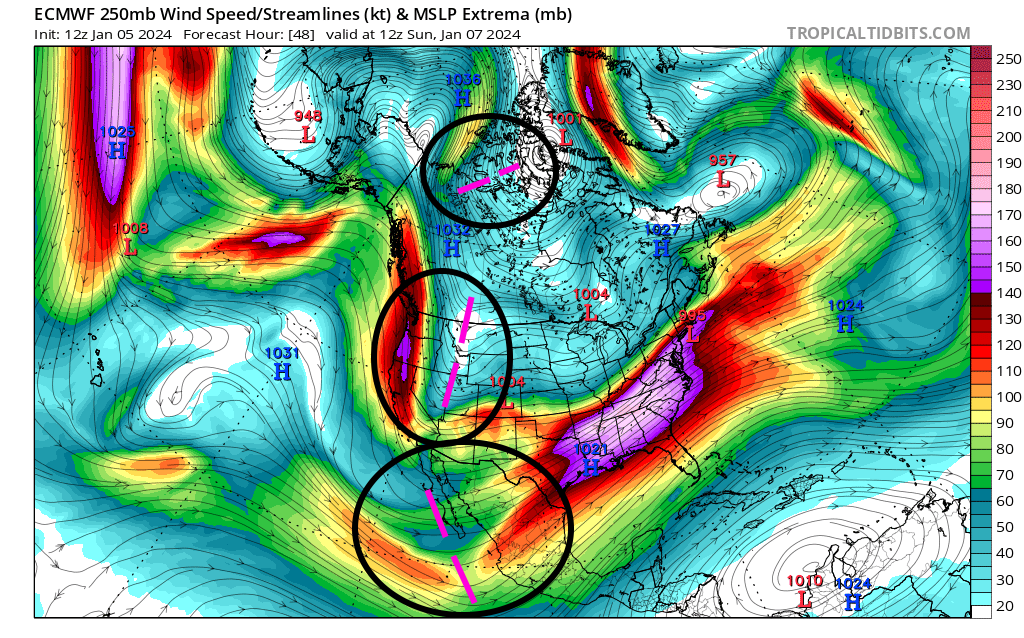
European model forecast 250mb winds valid Sunday morning
There will be three distinct pieces of jet energy interacting between the sub-tropical jet, polar jet, and arctic jet (from south to north)…and the airmass getting drawn up ahead of the developing storm will be juiced, with a large area of precipitable water values well above normal for this time of year:
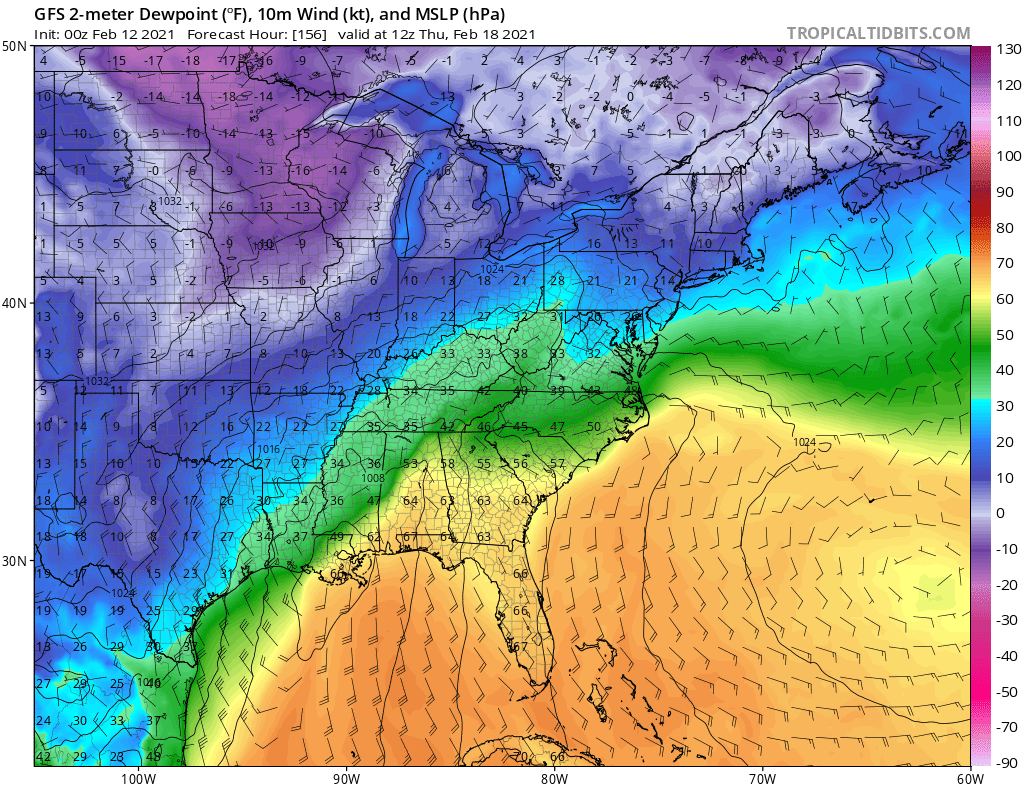
European model forecast sea level pressure, precipitable water normalized anomalies, and 850mb winds valid Sunday evening through Wednesday evening
The impressive plume of deep moisture indicates a warm, humid, unstable airmass for this time of year. This encourages more precipitation and latent heat release, allowing for stronger positive feedback as the low deepens and ultimately a quicker, stronger intensification. A strong low-level jet develops in the warm conveyorbelt over the eastern CONUS, peaking in intensity along the eastern seaboard. This will support impactful severe weather along the Gulf Coast and Southeast Coast Monday and Tuesday. Heavy precipitation (largely rain) will fall in the warm conveyorbelt ahead of the low along with strong south-southeast winds, especially near the coast. This will be a very impactful event with the rain occurring on top of recent snowfall, already saturated soils and on rivers that have recently experienced flooding from the northern Mid Atlantic into the Northeast/New England. On the cold side, the rapid deepening and strong dynamics should support a swath of accumulating heavy, wet snow. The above normal PWAT values wrapping all the way around into the cold conveyorbelt suggest a heavier, wetter snow with plenty of moisture. There will also be gusty winds behind the low pressure.
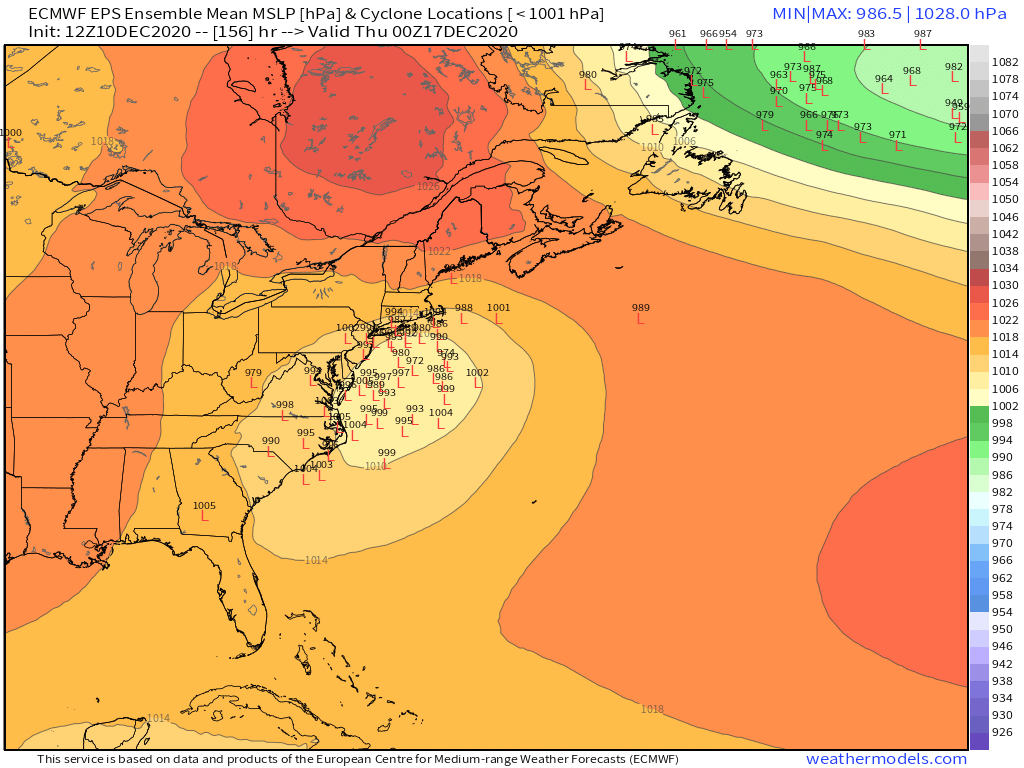
European ensemble member forecast low locations and intensity valid 1 AM Wednesday
As mentioned, the ensembles are and have been consistent on a strong Great Lakes cutter solution. There is still some spread in location Tuesday night, from as far west as Lake Michigan to as far east as the Finger Lakes, though nearly all members have a minimum pressure in the 970-980mb range. An impactful storm is coming, with severe weather along the Gulf Coast and near the coast in the Southeast, flooding and gusty wind concerns along the East Coast, a swath of heavy, wet snow on the northwest side of the low track from parts of the Plains and Midwest into the Great Lakes, and a broad swath of gusty winds behind the low pressure as well. While this will mainly be a warm and rainy storm for the East Coast some impactful ice/snow is possible, mainly in the mountains of the Mid Atlantic into Upstate NY and central/northern New England.
Given the impressive ingredients and consistent signal, the WPC already has an unprecedented Day 5 Moderate Risk for excessive rainfall and flash flooding (likely a combination of flash flooding and river flooding) across parts of NJ and southern NY, with a large Slight Risk surrounding it.
As this large low pressure tracks through the Great Lakes and into southeastern Canada around midweek a lobe of the tropospheric polar vortex will begin to drop into western and central Canada. Prolonged cross-polar flow will bring quite a bit of Siberian air into the North American side of the North Pole:
European model forecast dynamic tropopause potential temperature from January 6-11, courtesy WeatherBell
Starting early in the loop, note the flow directly across the pole into north central Canada. This continues through the loop as ridging continues to amplify from the Pacific, across Alaska and towards the pole. Eventually, a lobe of the tropospheric polar vortex begins settling into southwestern Canada and towards the Pacific Northwest and northern Rockies.
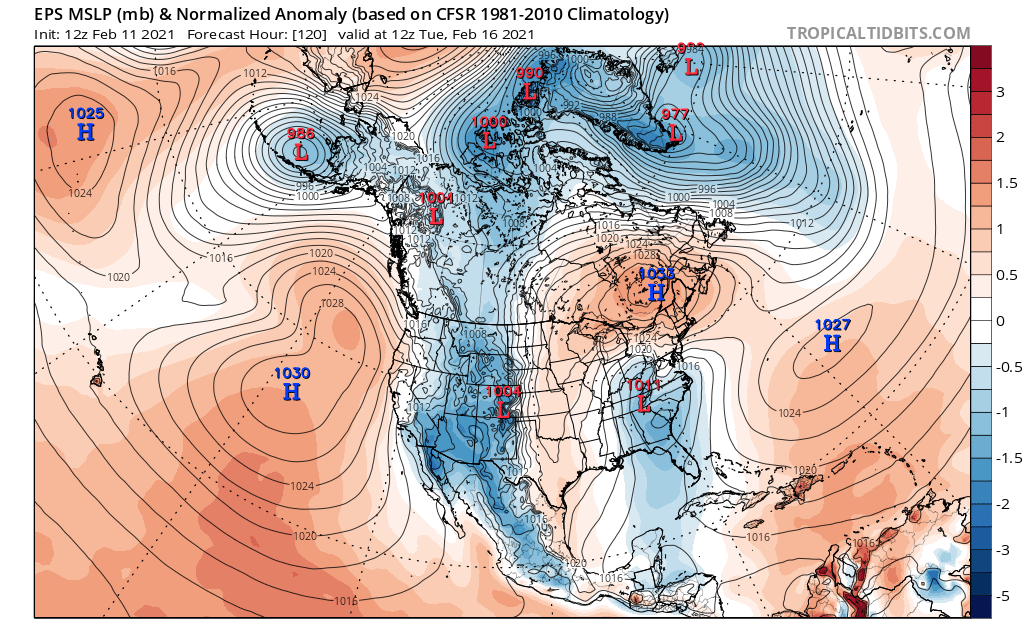
EPS ensemble mean sea level pressure forecast and anomalies valid January 8-13
As the lobe of the TPV drops into Canada strong surface high pressure will build over much of Alaska and northern/western Canada this upcoming week. This will give the Siberian airmass time to radiationally cool over snow pack that’s relatively fresh over southwestern Canada:
The ingredients are in place for a legitimately bitter Arctic airmass to drop into western and central Canada next week and continue to mature before dropping into the Pacific Northwest, Rockies, and Plains to end the week and into next weekend. The bulk of this cold initially goes into the western and central U.S due to the -PNA, with a stormy pattern continuing ahead of the cold air.
The next timeframe to monitor for a storm with snow potential comes January 12-13 over the central and eastern CONUS (Jan 10-11 over the Southwest):
EPS mean forecast 500mb height anomalies valid January 12
The next large shortwave in this pattern is expected to eject into the Plains around January 12th, with support from all 3 ensembles (EPS, GEFS, GEPS). This one will be a cutter as well though with a retrograding -NAO block, polar vortex lobe, legitimate arctic air pressing into western and central Canada, and some semblance of troughing extending towards southeast Canada there is a fair amount of uncertainty regarding how much it cuts…many ensemble members eventually have re-development closer to the New England coast. It will also be much colder behind this storm given the legitimate arctic airmass dropping into the western U.S. and Plains.
If there’s sufficient separation between the storm, the polar vortex lobe, and the trough over southeast Canada this low pressure could get well into the Great Lakes before running into the blocking and re-developing near the New England coast. However, if any of those above 3 features interfere with the storm more it would be less amplified, tracking farther southeast (perhaps just towards the upper Ohio Valley before re-developing off the Mid Atlantic or southern New England coast). There will be some more cold air ahead of this storm so there may be more front end snow (and ice east of the Appalachians) to go along with a swath of back-end snow, with a much more conducive airmass for higher-ratio snow on the backside.
EPS member low location and pressure valid January 12-13
Many ensemble members agree on the very general idea for this system…relatively decent cutter followed by re-development closer to the New England coast. There are plenty of finer details not agreed on. Some members have a clipper ahead of this storm which would encourage a more suppressed solution. Members track the initial low from anywhere as far southeast as the Appalachians to as far northwest as Michigan before transferring to the coast from as far south as off VA/NC to as far north as New England. Most members have a 970s-980s mb low over New England or southeast Canada with the coastal, though members range anywhere from the 960s to 990s mb with the primary low farther west.
There’s a lot of uncertainty. Ingredients favor yet another large and deep cyclone with a warm and humid airmass still in front of it, arctic air behind it, and a potent shortwave to work with. The question will be if polar/arctic influence and the blocking can lead to a somewhat colder and farther southeast solution or not. Either way, yet another relatively impactful system appears likely across parts of the central and eastern CONUS.
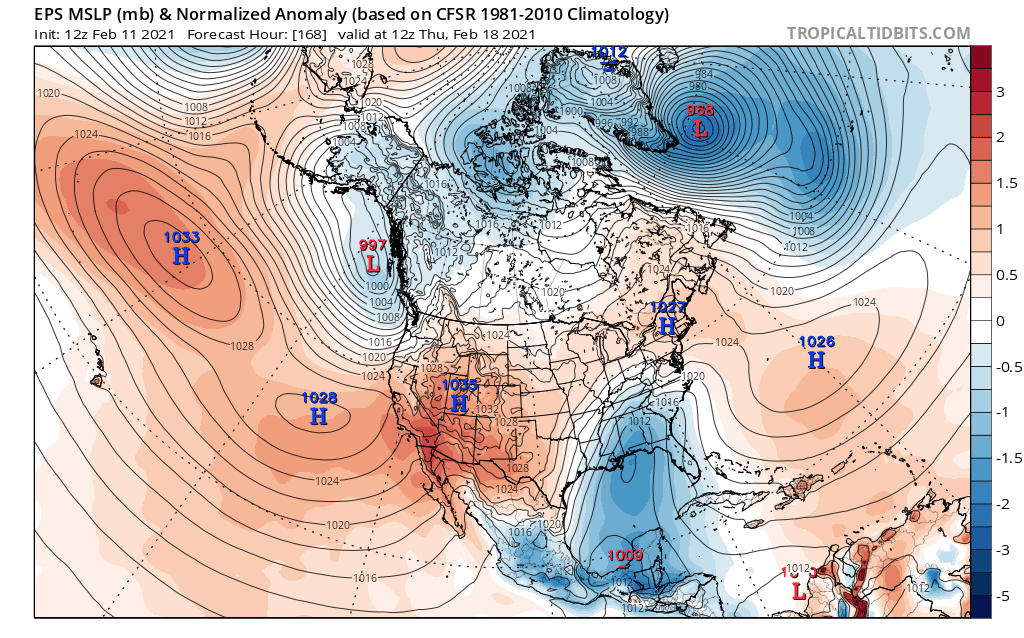
EPS ensemble mean 500mb height anomaly forecast valid January 12-17
Behind the January 12-13 storm the question becomes “where does the Arctic air go”? Some of this will depend on how the storm itself plays out…a more amplified/farther west solution may not pull the cold all the way to the East Coast behind it but a more robust coastal would pull more cold air towards the East Coast. Either way, the retrograding -NAO block will force the cold to role under it. A decent chunk of the cold air should get into all of the central and eastern U.S. in mid January…likely by January 13 in the central U.S. but probably not until January 15th or so for the East Coast.
EPS ensemble mean sea level pressure anomaly forecast valid January 13-16
There is a solid signal in the ensembles that another shortwave will try to eject out of the west around January 14th behind the storm discussed above. Most members appear rather suppressed due to cold air and high pressure behind the departing storm, though this could result in at least light snow potential farther south. Alternately, a few members appear to have a more amplified low into the Ohio Valley or Mid Atlantic with snow January 14-16, which could be possible if less cold gets pulled in behind the January 12-13 storm and gives the following shortwave room to amplify. It seems like one of these two systems will be the one pulls cold air all the way to the East Coast.
Moving into the Second Half of January & Early February:
We established above (and in my prior post in late December) how the pattern drivers are leading to and influencing the colder, more active pattern we are now finding ourselves in. How do the pattern drivers look beyond the middle of January?
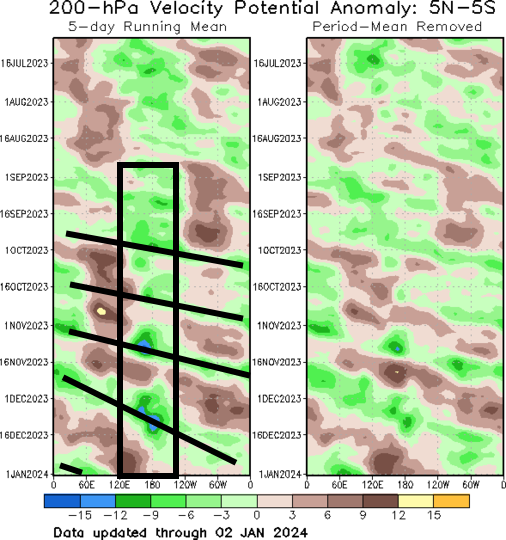
Observed 200mb velocity potential anomalies by longitude, courtesy the Climate Prediction Center/CPC
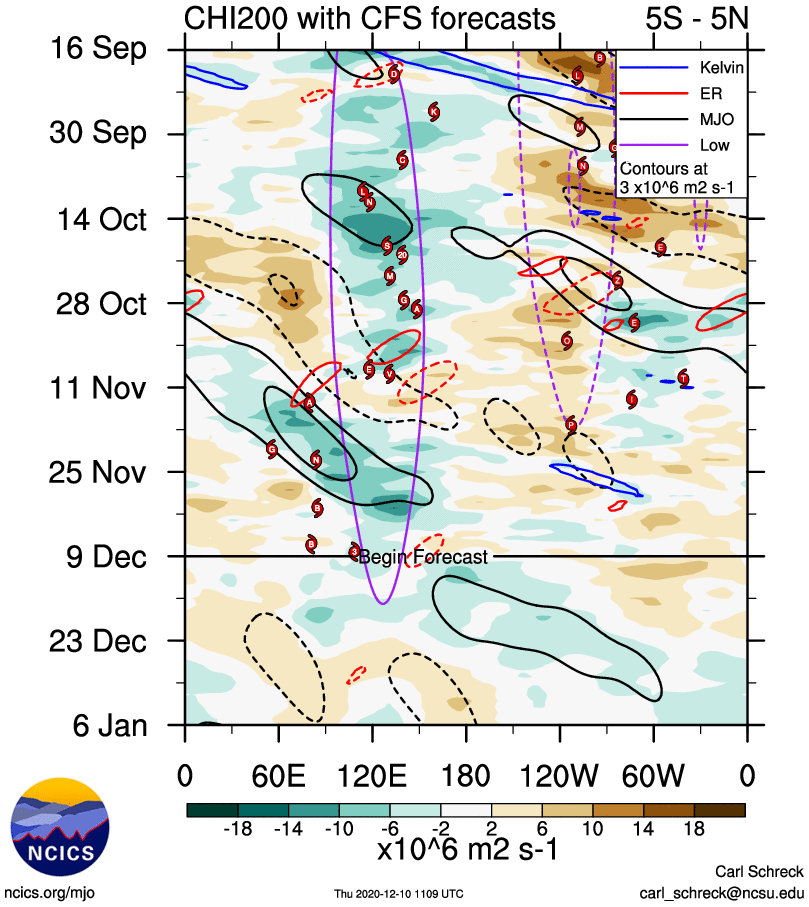
Let’s start with tropical forcing. There has been a coherent wave orbiting the tropics since the fall. Initially this seemed to be a higher-frequency Kelvin Wave, but the last couple of passes have been slower and more amplified like the MJO. As the strong positive Indian Ocean Dipole event collapsed we saw this more amplified MJO begin to develop. Each time this forcing has hit the vicinity of 150-180W (the central-eastern Pacific) it has amplified due to constructive interference with the El Nino. And each time it’s passed through the Pacific and western hemisphere since October a colder pattern has developed 1-2 weeks later. After passing through the Pacific and western hemisphere after December 15th we are on track for the forcing to reach the Dateline around or just after mid-January. This supports a more conducive pattern with a west coast ridge and high latitude blocking potentially returning during the last week of January or around the beginning of February at the latest.
The latest EPS depicts the general timing of the tropical forcing returning to the Pacific and then western hemisphere just after the middle of January:
EPS mean forecast 200mb velocity potential time-longitude through February 6, courtesy ECMWF.int
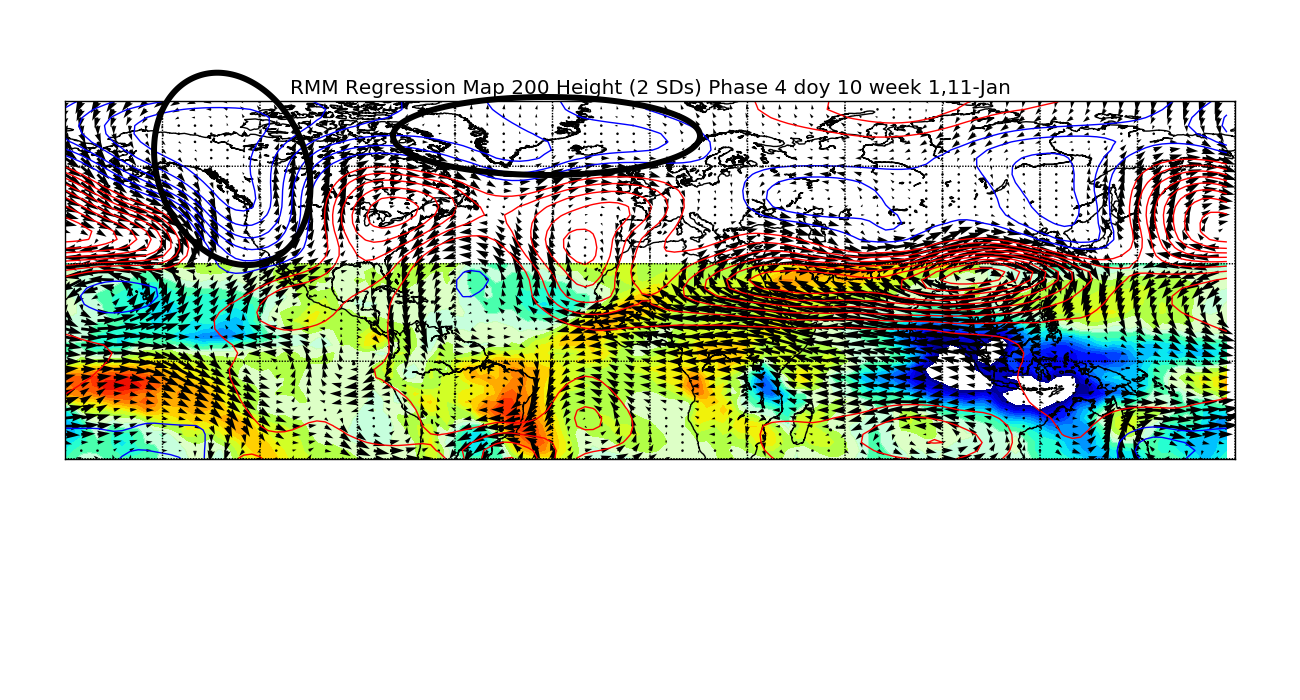
While this is intriguing for the end of January and early February over the eastern U.S. it is worth pointing out that tropical forcing will first move across the eastern Indian Ocean, Maritimes and western Pacific, favoring a West Coast trough/-PNA and even a +NAO around the 3rd week of January:
Typical MJO Phase 4 influence in mid January
Let’s re-visit the mountain torque discussion from above through January 20th:
EPS ensemble mean sea level pressure anomaly forecast valid January 12-20
The EAMT is negative through about January 15th, supporting Pacific jet retraction and a -PNA. After that it begins trending more positively. You can see that low pressure appears to begin getting pushed towards the west coast of North America at the end of the loop due to the beginning of the jet extending. This may have a temporary effect of amplifying the West Coast trough in late January, but would eventually lead to a north Pacific pattern shakeup favoring a more positive PNA trend.
On the Rocky Mountain/Atlantic side, an initially -RMT also trends more positive late in the loop, which favors a stronger jet into the Atlantic and generally makes it harder to sustain blocking.
Keep these mountain torques in mind when viewing a 250mb wind mean EPS forecast loop valid the same timeframe as the above MSLP anomaly loop:
Note how the Pacific jet begins extending again around January 15th as the EAMT starts switching. The Atlantic jet also extends late in the loop. Tropical forcing working into the Pacific mid-late January is also helping extend the jet.
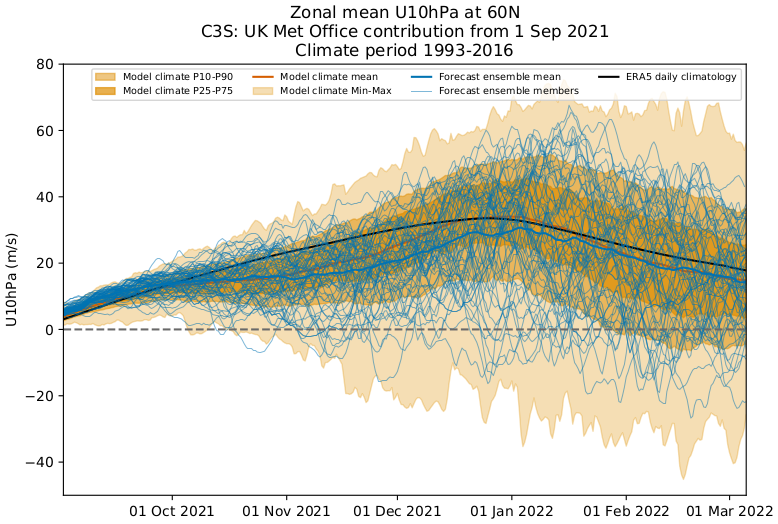
EPS member 10mb mean zonal wind forecast through mid February
The last “driver” to mention is the stratosphere. A minor stratospheric warming event is ongoing and the mountain torque and tropical forcing do suggest more jabs at the stratospheric polar vortex in mid-late January. Most ensemble members have another minor warming in 2-3 weeks as a result with a healthy minority actually reaching major SSW criteria. The ongoing warming event is contributing to a significant high latitude blocking episode in early-mid January, and a subsequent warming could do the same around the end of January and early February.
Overall, it seems that the NAO block will decay after the middle of January and cold will gradually lift out of the eastern CONUS. A western U.S. trough will probably persist until the last week of January and there will be increased Pacific influence again during the second half of January. This will likely maintain an active pattern with west-east moving systems, though as the blocking decays and the cold air lifts out it may be hard to see a well-phased, highly amplified storm. There may be a narrow window of increased eastern CONUS snow potential the third week of January if the active pattern can coincide with lingering cold air. The CONUS will generally trend milder, though there will be some cold air lingering over Canada so some snow potential probably will continue across parts of the western U.S. and the northern tier farther east.
It seems the stars may align again for a solid period of blocking with a West Coast ridge, East Coast trough and an active sub-tropical jet from around the end of January through at least the first half of February. That would result in a persistently colder than normal and relatively snow pattern in the eastern CONUS for at least 2-3 weeks. The fail mode here is if the West Coast trough is too persistent and lasts into early February. While I think more blocking is likely regardless, which would inherently increase cold air into the CONUS and wintry potential, there’s some chance the western U.S. trough is difficult to kick out. To me that’s the most likely way the eastern U.S. gets skunked in the January 27-February 20 period. Otherwise, the factors seem pretty well-aligned for winter to return to the eastern half of the CONUS to end January and through the first half of February.
Not a surprise in a strong El Nino winter but December 2023 has been a very mild so far, with no significant cold anomalies expected in the continental U.S. (CONUS) the rest of the month to take much of the edge off of this map. While parts of the country have seen impactful winter weather, with Blizzard Warnings and Ice Storm Warnings posted across parts of the Plains and Upper Midwest as of this writing, it’s generally been a very slow start to winter across the Lower 48 and much of Canada. Current snow cover analysis reveals very limited snow cover across the CONUS at the end of December:
Outside of some of the highest elevations out west, the Plains where a winter storm is ongoing, and the highest elevations of Upstate NY and northern New England there is no snow cover in the Lower 48. Southern Canada isn’t in much better shape. Here is the departure from normal snow cover across the CONUS:
For the most part it’s been a slow start to winter across the U.S., especially across the northern U.S. where they should be reliably chilly and snow covered by now. In parts of the northern Rockies, Upper Midwest, Great Lakes and northern New England seasonal snowfall anomalies are getting larger by the day, and with higher snowfall averages it will be harder to catch up in these areas. This is especially true in a stronger El Nino winter when there’s inherently weaker polar jet influence, meaning fewer clippers and cold air masses that can set off lake effect snow. Farther south, where average snowfall is generally lower and where the enhanced El Nino sub-tropical jet stream could come into play if we see more cold air there’s still time to see seasonal snowfall catch up to or even exceed average.
The question is, will we see a transition to a colder pattern? Let’s start by establishing how the pattern has behaved, what is driving it, and how these pattern drivers are evolving right now. Behavior of the Pacific jet is a significant driver of our current pattern. How the Pacific jet evolves along with potential for high latitude blocking will determine much of how this goes…something that can probably be said most of the time in the winter months.
Loop of analyzed and forecast sea level pressure anomalies from the December 25th European Ensemble run. https://www.tropicaltidbits.com/
A significant influence on the Pacific jet stream is East Asian Mountain Torque (EAMT). Remember that big cold blast in Siberia earlier this month? The Arctic high associated with that dropped across eastern Asia (and is still doing so early in the above loop). This denser airmass and higher pressure east of the Himalayas puts a torque against the planet’s rotation, slowing it down an imperceptible amount. To conserve momentum, this is compensated for by speeding up the jet stream over the Pacific…promoting stormier conditions over the northern Pacific. The Rockies can have a similar affect on the jet stream over the north Atlantic.
Note how a strong positive EAMT event occurred over the last week or so as the aforementioned Siberian high dropped into eastern Asia. EAMT will generally trend more negative over the next 2-3 weeks, though it’s possible we see one last little push of +EAMT in the first few days of January which may be important to determining how quickly the Pacific jet retracts during the first half of January.
The strong +EAMT has led to the dramatic intensification of the north Pacific jet ongoing now, though the jet will begin retracting over the coming days and continue retracting/weakening into early January as EAMT trends more negative (and as tropical forcing changes, will get into that below). The stronger jet leads to stronger ageostrophic flow within its embedded jet streaks, encouraging a stormier (and amplified) pattern, especially near the eastern edge of the jet where the upper-level flow is most diffluent.
As the jet reached its easternmost extension over the last few days the stormy pattern was over the southwestern US with ridging amplifying northeast of that. As the jet begins retracting over the next several days the stormy pattern will shift west into the Pacific, allowing ridging to shift west towards the west coast and Alaska while continuing to amplify. This jet evolution has strongly contributed to our ongoing mild pattern and the change will contribute to a period of cooler conditions to start January.
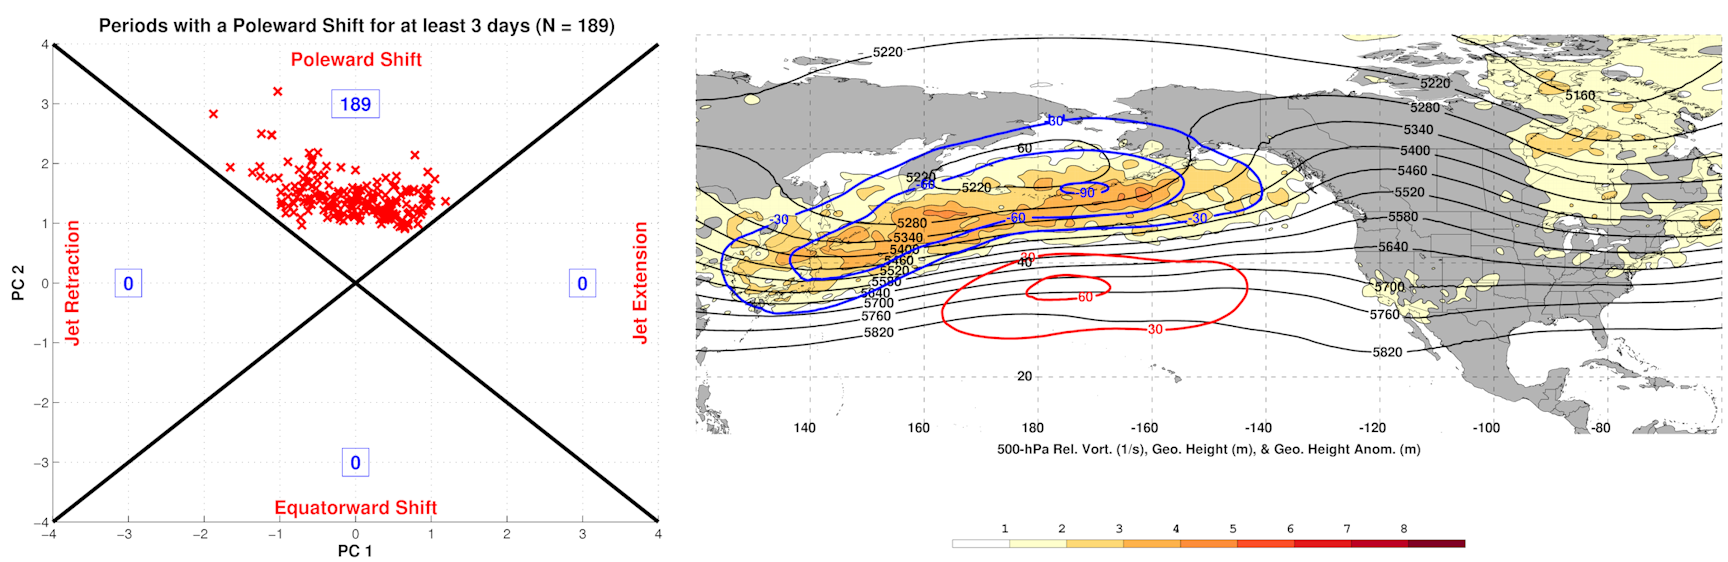
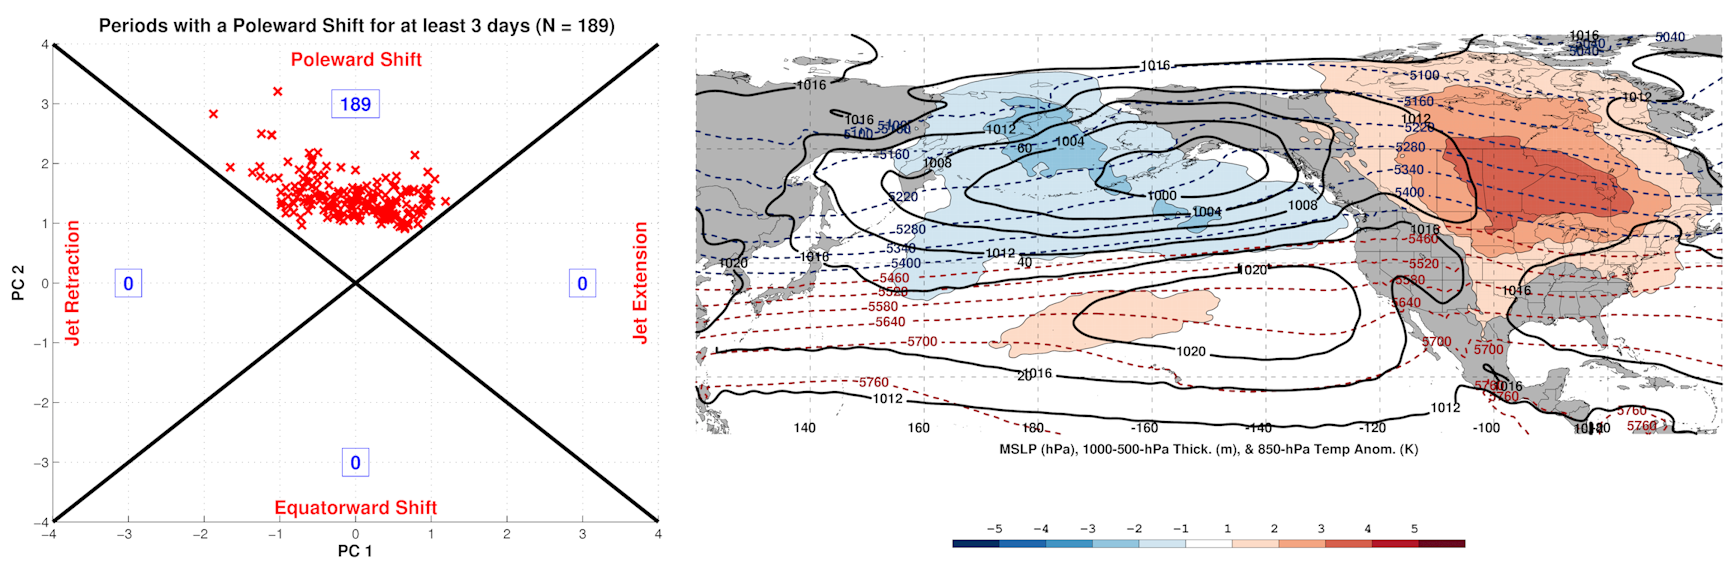
Wanted to demonstrate how important the Pacific jet has been on the pattern we are seeing. Per the analysis, we went from a jet retraction in mid December to a recent poleward shift of the jet. The jet is expected to be more characteristic of the “jet extension” phase the rest of this month, before briefly moving towards either jet retraction or poleward shift, perhaps briefly passing through equatorward shift. My gut feeling is that we may see a jet retraction by the second week of January (before a chance for a poleward shift) due to the persistent -EAMT that is being modeled by then. Prior GFS runs also suggested a similar idea. Worth watching for that trend. Here is what these North Pacific Jet phases typically correlate to:
Poleward shift heights and resultant temperatures:
A very Pacific-dominated pattern with minimal polar/arctic influence and very mild conditions across a good portion of Canada and the northern CONUS. Very similar to what we’re currently seeing.
How about a jet extension, which is what we’ll see over the coming days?
Supports increasing heights along the West Coast and into Alaska, less Pacific influence, and at least some polar and arctic influence into North America, with cooler anomalies over parts of the eastern U.S. Looks a bit like the pattern showing up on the models and ensembles over the next week.
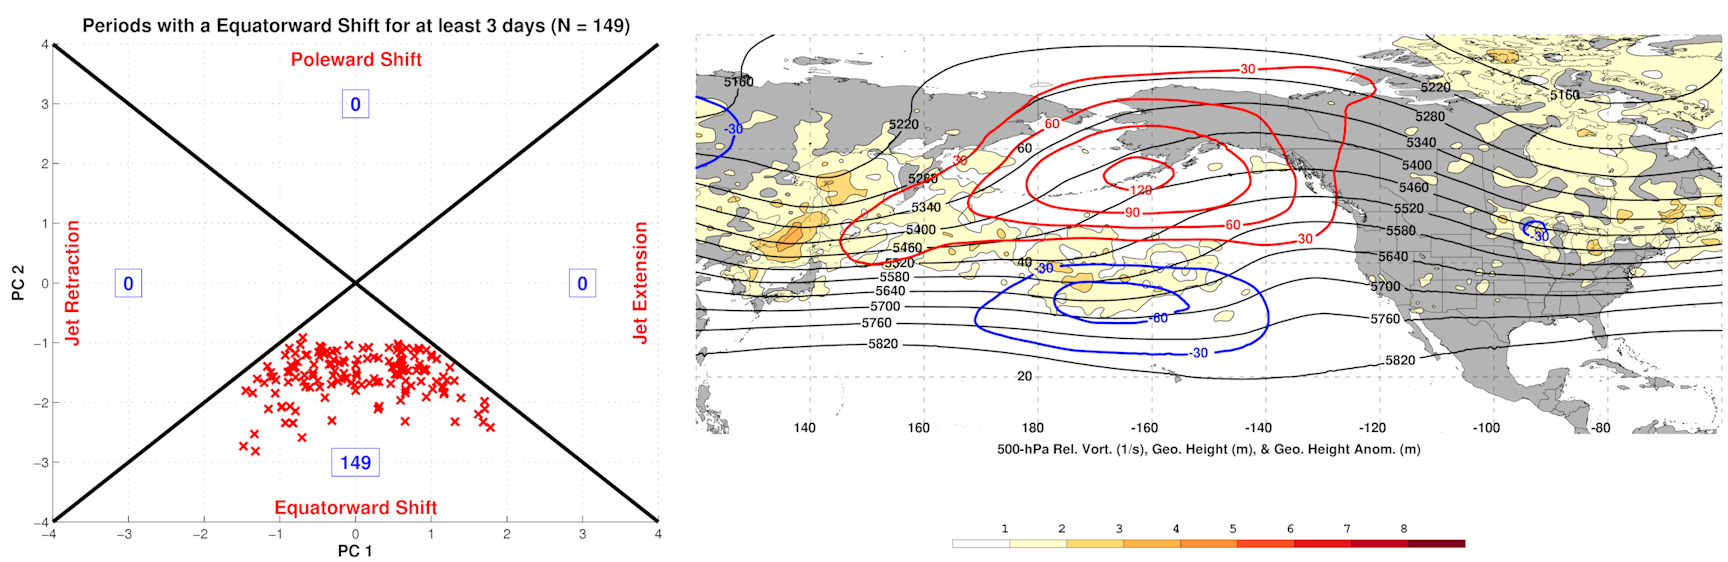
An equatorward shift is inherently hard to sustain in an El Nino but is most conducive to EPO-induced cold shots into southern Canada and the CONUS:
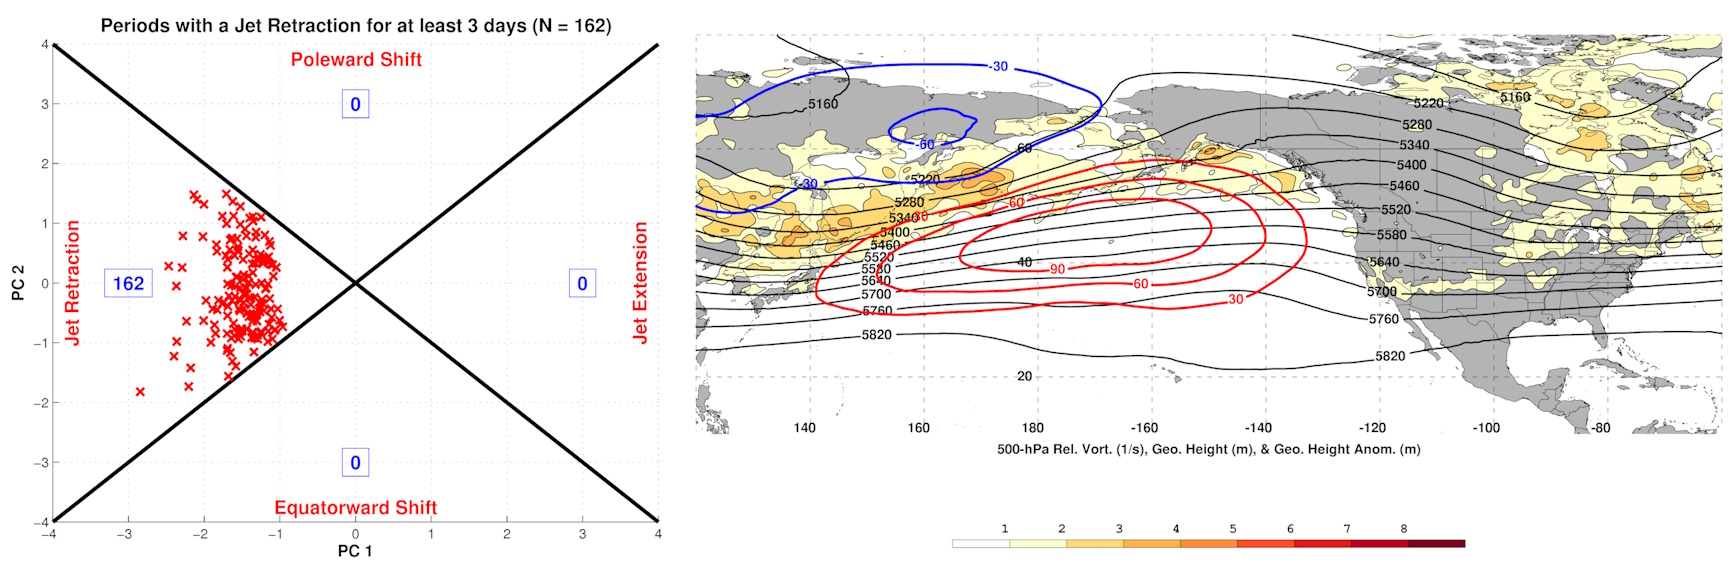
Jet retractions favor flatter ridging farther west over the North Pacific…a -PNA pattern, which is showing up in the extended ensembles…
How the Pacific jet plays out (how quickly it retracts) in early-mid January may be very important…the Pacific jet will be more favorable to a western North American ridge and eastern trough over the next 5-10 days, but how long that can last is in question. The East Asian Mountain Torque remaining positive for a longer period of time (i.e. high pressure persisting longer east of the Himalayas) could slow the onset of any -PNA pattern towards the second week of January.
Tropical forcing is also influencing the pattern…the MJO is making a fairly amplified pass through phases 1-2 through early January:
So far the East Asian Mountain torque and tropical forcing do a good job of explaining the evolution of the Pacific jet and the recent/upcoming North American pattern. The troposphere and stratosphere have seemed to be relatively well-coupled so far this season, with an amplified pattern in the troposphere in late November and early December leading to increased upward heat and wave fluxes into the stratosphere. This has led to an ongoing stratospheric warming event that appears poised to downwell into the troposphere.
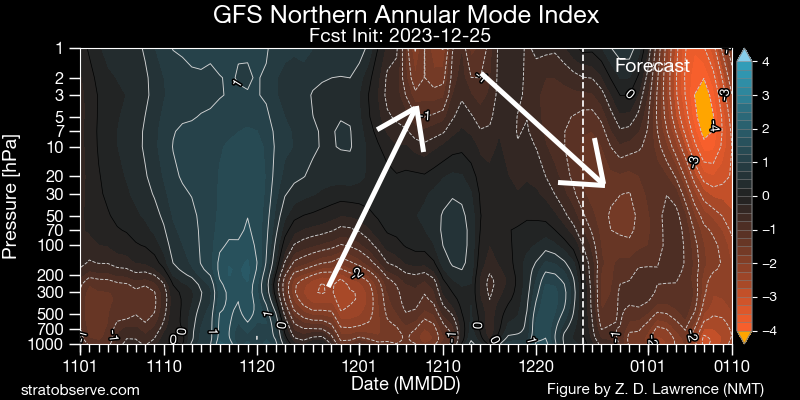
GFS analyzed and forecast Northern Annular Mode (aka the NAM or AO) by height with the 12/25 GFS run as the forecast. https://stratobserve.com/anom_ts_diags
Not only do the mountain torque and tropical forcing support amplified ridging on the west coast into Alaska the rest of this month into early January, along with perhaps a -NAO, but the downwelling negative AO out of the stratosphere supports high-latitude blocking. Lots of factors supporting the pattern change that will be getting underway very soon.
Here’s a look at the EPS mean 500mb and surface temperature forecasts through the upcoming pattern change:
European Ensemble mean 500mb height and surface temperature anomalies through 12z January 10, 2024. Courtesy WeatherBell.
The 500mb evolution shown on the ensemble seems strongly supported by the various forcings described above over the next 10 days. The ongoing storm over the central U.S. starts carving out a trough over the eastern US over the next few days, with amplifying ridging on the west coast deepening the trough over the next 10 days as energy ejects out of the southwest U.S. in the subtropical jet. This leads to increased polar and arctic influence into Canada and the U.S., but the source region is currently very mild which will take time to completely overcome. The above loop suggests cross-polar flow into Canada, which would assist in cooling it off in early January. While the longwave trough axis is gradually shifting west (towards a -PNA/+EPO) at the end of the run, it’s worth noting that this isn’t happening quite as quickly as prior runs. That seems to be a source of uncertainty right now.
The result is a cooler trend over the CONUS, especially over the southern U.S. where the active subtropical jet keeps conditions more active. Over Canada it remains generally mild for the foreseeable future but certainly trends much less mild than recent conditions. By the second week of January, there is some potential for cold anomalies to begin overspread Canada if the idea of prolonged cross-polar flow verifies. It’s worth noting that this is a change from temperatures well above freezing all the way to Hudson Bay to sub-zero temperatures (on the ensemble mean) down to at least that latitude:
The tug of colder air behind the current Plains storm is very meager but the colder air becomes much more “tappable” by the beginning of January, so any storms that develop will be able to pull in seasonally cold air. Nothing crazy but certainly much more wintry feeling that at the moment. Note those frames are all 12z which catches something close to the daily lows.
While the tropical forcing, mountain torque/Pacific jet, and stratospheric influence support upcoming amplification of ridging along the West Coast into Alaska and perhaps a -NAO, there are some hints that a more -PNA/+EPO pattern (mild, Pacific dominated) may take hold by mid January. Is that legit?
Recall back to the SLP loop and the mountain torque discussion:
A sustained negative EAMT event appears likely in early January, supporting retraction of the Pacific jet (and a -PNA). However, there is some uncertainty regarding how quickly the Pacific jet retraction occurs. There is a hint of some transient +EAMT trends during the first week of January, which could help slow the retraction of the Pacific jet and subsequent -PNA development.
Also, note how a similar evolution (about a week later) of Rocky Mountain Torque (RMT) supports ridging over the North Atlantic, as a +RMT and strong North Atlantic jet to start January gives way to a -RMT and weakened North Atlantic jet by the second week of the month.
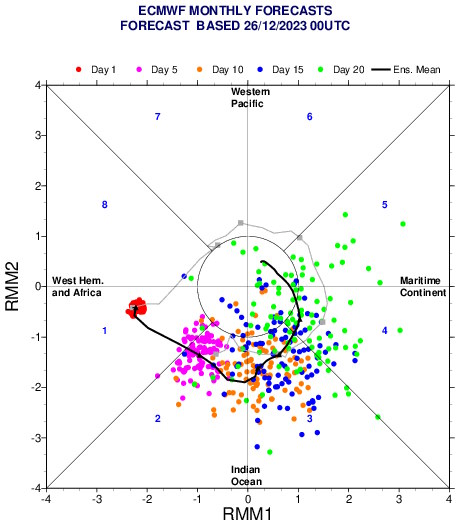
European ensemble weekly member MJO forecasts through day 20 (approximately January 15). Euro weekly plots available here.
There is some uncertainty regarding how the MJO evolves beyond the next 10 days. Many ensemble members have the wave weakening and moving into the “circle” in the day 15-20 range (blue and green dots, valid the 2nd week of January). A number of members maintain amplitude into phase 3 and a growing number into phases 4 and 5. While that initially seemed unlikely (and the mean forecast does still move into the circle by mid January), an increasing number of members have the more amplified outcome across the Indian Ocean and towards the Maritimes. The ongoing stratospheric warming event may support a stronger and more amplified MJO moving across the Indian Ocean and into the western Pacific mid-late January…this is a trend worth monitoring. Even a phase 3 MJO in early January suggests a trend to a more -PNA/west coast trough:
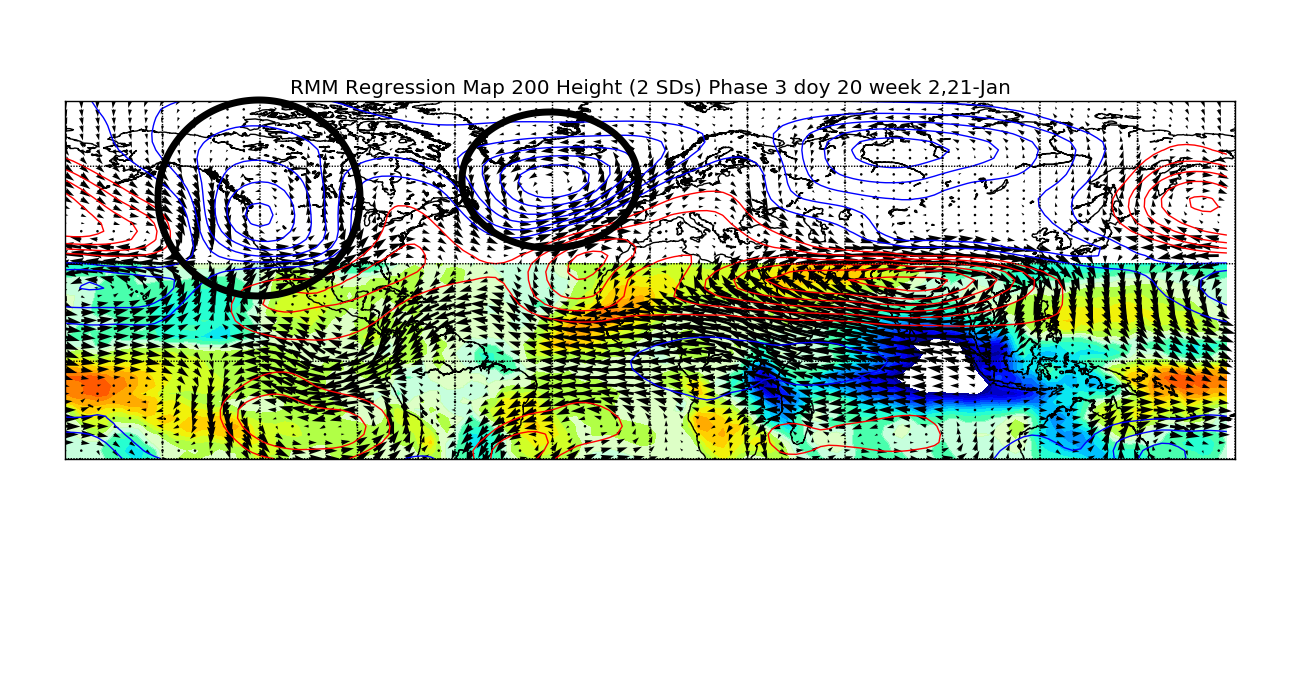
Phase 3 MJO influence on the 200mb heights in mid January
To sum up where things are so far:
Tropical forcing, mountain torque/the Pacific jet and stratosphere support a pattern change over the next several days. This will increase polar influence into Canada and the U.S. and favor development of an eastern U.S. trough to start January. Mountain torque and tropical forcing suggest continued Pacific jet retraction in early to mid-January, which will support ridging retrograding from the west coast towards Alaska as troughing over the eastern CONUS also retrogrades/shifts west. This will support colder temperatures moving into southern Canada and the U.S. with some increase in snow potential. The sub-tropical jet will remain active with shortwaves moving through the Southwest and ejecting east into the southern Plains in early to mid January.
European Ensemble mean 500mb height anomalies valid January 3, 2024
The pattern could favor a wintry threat from the Four Corners and southern Plains towards the interior Southeast/Mid Atlantic the first few days of January. It’s questionable if enough cold air can build by then for more than an elevation snow threat in the eastern U.S. with any sub-tropical waves moving through, and many ensemble members don’t have much of a system.
European ensemble mean 500mb height anomalies valid January 6, 2024
The next shortwave in the very active sub-tropical jet ejects into the Plains January 5-6. By this point, there will be much more polar and even arctic influence on the pattern with a lobe of the tropospheric polar vortex near Hudson Bay and some cross-polar flow into Canada. The sub-tropical jet shortwave may interact with a northern stream shortwave as it moves east. This interaction will prove key to any resultant low pressure development from the southern Plains or Mid South region towards the Ohio Valley or Mid Atlantic. If the polar jet is too fast or dominant, we may just get a clipper and a suppressed sub-tropical jet shortwave that don’t phase. If the features are able to phase and low pressure develops, snow would be likely north/northwest of it with some cold air damming east of the Appalachians thanks to upper-level confluence caused by modest downstream blocking over the North Atlantic. While this is still a long ways out there there’s a signal for a system potentially bringing a broad swath of snow across the central and eastern U.S. in the January 6-8 timeframe.
European ensemble mean 500mb height anomalies valid January 9, 2024
With such an active sub-tropical jet the shortwaves will eject out of the Southwest every 2-3 days, with the next strong signal for a shortwave to eject on the ensembles January 8-9. By this point the mean trough axis will be shifting farther west, making it more likely for any low pressure to track towards the Great Lakes with snow possible to its north and west. If we see a notable low pressure over the eastern half of the CONUS to start the second week of January it could re-enforce North Atlantic blocking and pull in colder air behind it, possibly delaying the development of an eastern U.S. ridge.
Euro ensemble member 10mb mean zonal wind forecast through early February. Below 0 indicates easterly mean winds and a major stratospheric warming event.
Looking further ahead, a solid majority of EPS members have a significant stratospheric warming event (SSW) between January ~4-12. If this occurred it would lead to greatly increased potential for sustained high-latitude blocking beginning during the second half of January and persisting well into (and perhaps through) February. It is very common for a warm-up to occur over the central and eastern U.S. as a stratospheric warming event is ongoing before any blocking it sets off can establish itself. This would line up with hints of a -PNA and perhaps +EPO towards the middle of January.
Looking at lower-frequency tropical forcing, it has been amplified over the central Pacific (near 180 longitude) and over the western Indian Ocean (near 25E), roughly outlined by the green boxes. Tropical forcing has generally been suppressed between these two areas. The tropical forcing has moved through the western hemisphere (phase 1 MJO and favorable for colder weather) every 3-4 weeks.
If this type of oscillation continued it would move back through the western hemisphere by the middle of January. However, it seems like the tropical forcing was largely driven by faster-moving Kelvin Waves until the two most-recent orbits, which featured stronger and slower-moving anomalies more typical of the MJO. This most recent pass remained strong through the low frequency eastern Indian Ocean subsidence and took closer to 4-5 weeks to return to the western hemisphere. If this more recent trend continues it will return to the western hemisphere in the ~3rd week of January, potentially supporting development a more favorable Pacific pattern (Aleutian low, west coast ridge) along with a -NAO. The stratospheric warming event that will be ongoing over the pole over the next two weeks will lead to a colder lower stratosphere over the tropics, which may amplify and slow down the progression of the MJO. I would say smart money is on tropical forcing becoming favorable for a western North America ridge to return during the last week of January. Potential exists for prolonged -NAO blocking by then if we do in fact see a major stratospheric warming event (which currently appears more likely than not during the first half of January).
To sum up, a cooldown is expected into the first week of January, leading to a favorable pattern for any amplified southern stream system to bring snow potential to the central and eastern CONUS. There will probably be enough polar and arctic influence for a modest clipper or two and some lake effect. A trend towards a trough with colder air over the western U.S. and ridging farther east is supported for the middle portion of January. By the end of January potential appears to be there for impacts from a stratospheric warming event and tropical forcing to support a western North American ridge, eastern trough, and high-latitude blocking with an active southern stream. This would lead to a few week period of more wintry weather, and while unlikely to completely make up seasonal snowfall deficits in large portions of the northern U.S. could salvage a semblance of a winter.
Just wanted to throw a few loops from the 12z European ensemble in here…the ensembles are increasingly keying on a pattern featuring a -EPO (Alaskan ridge) and -NAO (Greenland ridge) into the first half of December, though with an initially -PNA (western US trough). This would support colder air pressing back into the CONUS starting early next week out west after a relatively brief hiatus. With an initially -PNA the cold air will first focus out west with mild weather over the eastern U.S., though a persistent -EPO and eventual -NAO could change that. Ok, time for some loops:
So to start, the pattern early in the loop is a mild one across the CONUS. There’s troughing over Alaska (a positive East Pacific Oscillation/EPO) that’s flooding much of the CONUS with milder air after our impressive mid-November chill. With a -PNA (Aleutian ridge/west coast trough) any limited cooler air is going into the western U.S. right now.
But, focus on Scandinavia (northwestern Europe). A persistent Scandinavian block has been ongoing and is progged to amplify this week. First, it sends a blast of cold air into Siberia and the rest of eastern Asia, a key to changing the Pacific pattern. Then, the block is shown on the European ensemble mean to retrograde towards Greenland, causing a negative NAO to develop through early December.
This Scandinavian ridge/block has been persistently modeled for a couple of weeks, which is impressive…and it’s also a pretty important piece to the puzzle. The set-up, as everything is currently modeled, seems to support both a -EPO and -NAO developing through the first half of December.
The blast of cold air into eastern Asia sends strong high pressure down the eastern side of the Himalayas, in contrast to the current low pressure over eastern Asia. Low pressure lowers the resistance against the planet’s rotation east of these tall mountains, allowing the planet’s rotation to speed up ever so slightly. To conserve angular momentum, the Asian-Pacific jet slows down and retracts. This favors anomalous ridging over the northwestern Pacific and low pressure over western North America…not a cold pattern for the Lower 48.
Fast forward to later this week and beyond, when high pressure drops in east of the Himalayas and does the opposite, speeding up and extending the Asian-Pacific jet. This favors lower pressure over the northwest Pacific in the exit region of the jet and pushes the ridge east, while the added momentum into the Pacific jet amplifies that Rossby wave train. Low pressure over western North America is replaced by high pressure descending out of the high latitudes. It’s a much colder pattern for most of the CONUS, though the East Coast will be the last place to consistently get the cold.
Also note how Rocky mountain torque is demonstrably important. Early in the loop, high pressure east of the Rockies is in place, which favors intensifying/extending the jet over eastern North America and into the northern Atlantic. This favors low pressure over the North Atlantic in the left exit region and a +NAO. However, a series of low pressure systems developing east of the Rockies in the middle portion of the loop does the opposite, retracting the jet and giving the Scandinavian block room to retrograde.
I think at this point we just need the damn 250mb wind loop:
Early in the loop, the jet streak is breaking near the coast of East Asia and the north Pacific ridge is well to the west. As the jet extends in response to the East Asian Mountain Torque, that ridge is pushed east, a pattern much more conducive for pressing cold air into Canada and towards the continental U.S…also check out the Atlantic. Initially, the jet is roaring off the East Coast, but as low pressures develop east of the Rocky mountains and cause a negative mountain torque, the jet pulls back and allows ridging to retrograde over the North Atlantic. This causes the NAO to trend negatively, and is more conducive to troughing over the eastern U.S.
Another way to visualize this chain reaction…cold dumps into eastern Asia. Alaska then goes from cold to mild. Cold air then begins pressing into the CONUS. As ridging retrogrades over the North Atlantic and cold continues to funnel into the west, increasing pressure is put on the Southeast ridge and the eastern U.S. gradually sees cooldowns. Probably a very up and down pattern in the east, and leaning much colder west. In general, as the highest latitudes warm, the mid latitudes cool.
The MJO is moving into Phase 7 at a high latitude for the second time this month, and it could end up squeaking into 8:
Convection has been favoring the eastern Indian Ocean/western Pacific all summer and fall, a classic more “eastern based” La Nina response:
In the late fall/early winter, a phase 7 MJO is typically followed by ridging near Alaska and Greenland, a -EPO and -NAO respectively, with cold first dropping into the west and then spilling east. We are approaching Lag=0 now and will be Lag=1 and 2 next week into the following week (each lag is 5 days):
Lots of stuff pointing to a -EPO and -NAO and resulting colder pattern over the CONUS and slightly thereafter Europe as well…though don’t overlook the initial -PNA and Southeast Ridge causing cold to go into the western U.S. first.
Can this return to cold through early December bust? As always with a longer range forecast, yes. My main concern is where the tropospheric polar vortex ends up, and if it splits as quickly as modeled over the next 7-10 days:
In particular, my concern is where the lobe over northeast Asia ends up. If it ends up dropping a bit farther east, it could mute any ridging into Alaska. I feel that’s on the less likely side, but it’s slightly precarious. If we see the tropospheric polar vortex split like the ensembles currently show, with one lobe into Siberia and another into northern Canada it bodes towards the colder outcome being favored over North America in December.
1. Any views here are mine and are done for fun, and don’t represent anyone else’s 2. The pattern of “cold west, warm east” continues through most of this week. Cold and fairly active weather will continue across the western U.S. 3. Later this week into this weekend, cold spills into the central and eastern United States. The pattern then remains fairly chilly across the Lower 48 for a couple of weeks, with the coldest overall conditions across the northern Rockies and northern Plains 4. This colder pattern may be somewhat dry overall. With that said, some snow may occur from a lee cyclone late this week/early this weekend across the Upper Plains/Midwest…then, lake effect snow, a minor clipper or two, or perhaps a wave riding along the baroclinic zone (if there’s any sub-tropical jet activity) may bring some potential for snow farther south/east next weekend or beyond. Not a big winter storm pattern, but not hopeless for a bit of snow. 5. Several signs point towards the weather pattern in much of the continental United States trending mild yet again towards the end of November and early December 6. A few analogs and early signs in extended guidance suggest the potential for increased high-latitude blocking and colder weather may return into December. Given the ongoing La Nina and -PDO, confidence in this occurring isn’t high yet. However, the coldest December since at least 2016 is distinctly possible if things align properly.
The Details:
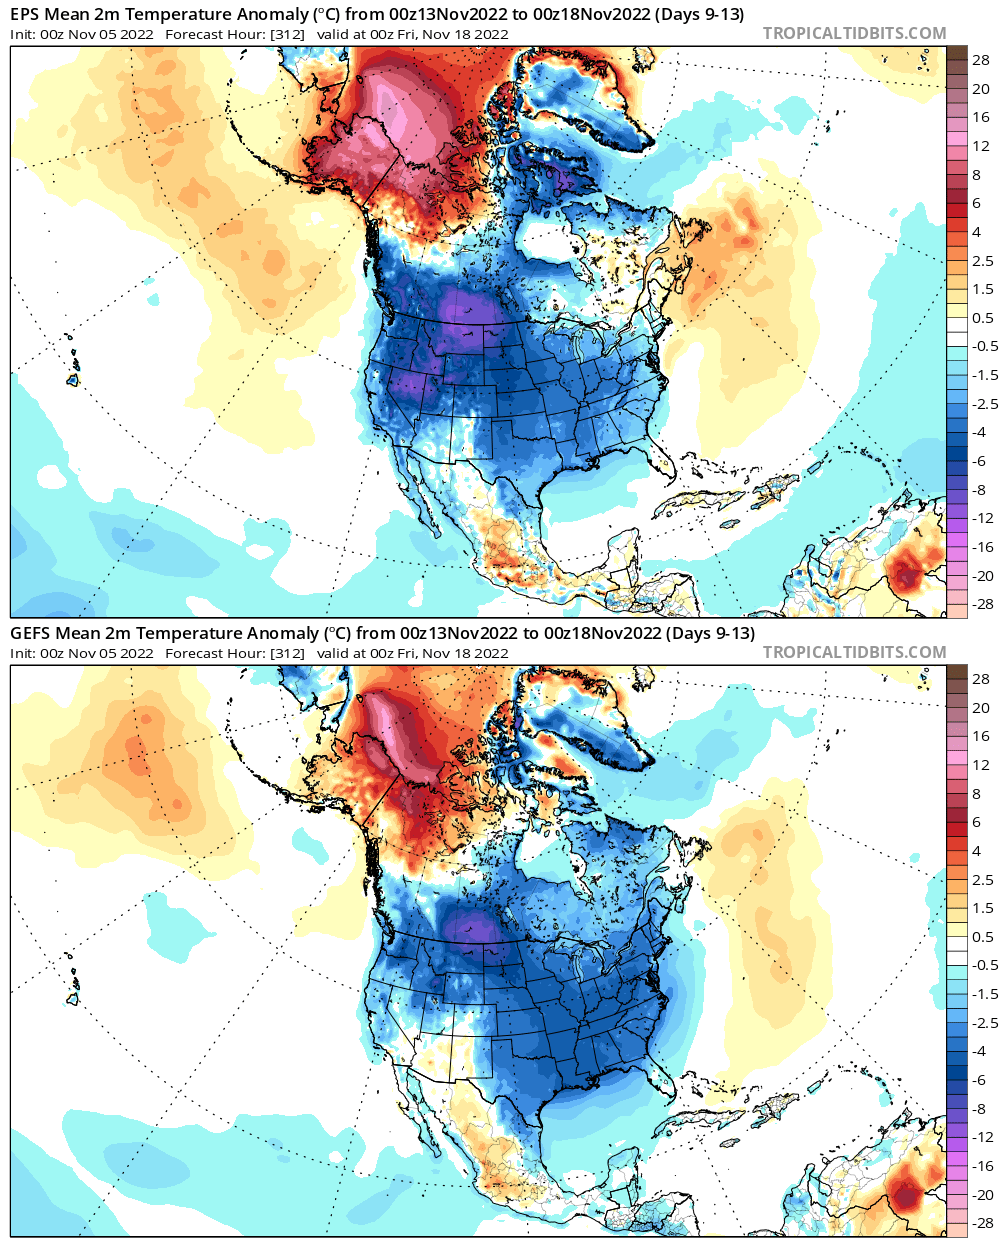
After a very chilly first half of October, which was enough to plunge most of the eastern U.S. to below normal values for the entirety of the month, mild weather has dominated the pattern over much of the central and eastern U.S…this pattern continues into this upcoming week, but the GFS and Euro ensembles both indicate below average temperatures over fairly decent stretch for almost the entire CONUS closer to mid-month:
Euro and GFS Ensemble 2m temperature anomaly forecast valid November 13-17
It’s getting to be the time of year where colder anomalies have some more bite and can start bringing snow to more of southern Canada and the Lower 48. This cooldown has trended more and impressive as it moves up in time on the models, evidence by this GFS ensemble trend loop for the same time period:
GFS ensemble trend loop of forecast 2m temperature anomalies from November 13-17
After such a prolonged mild spell, is this cooldown shown in the medium to long range feasible, and how long may it last?
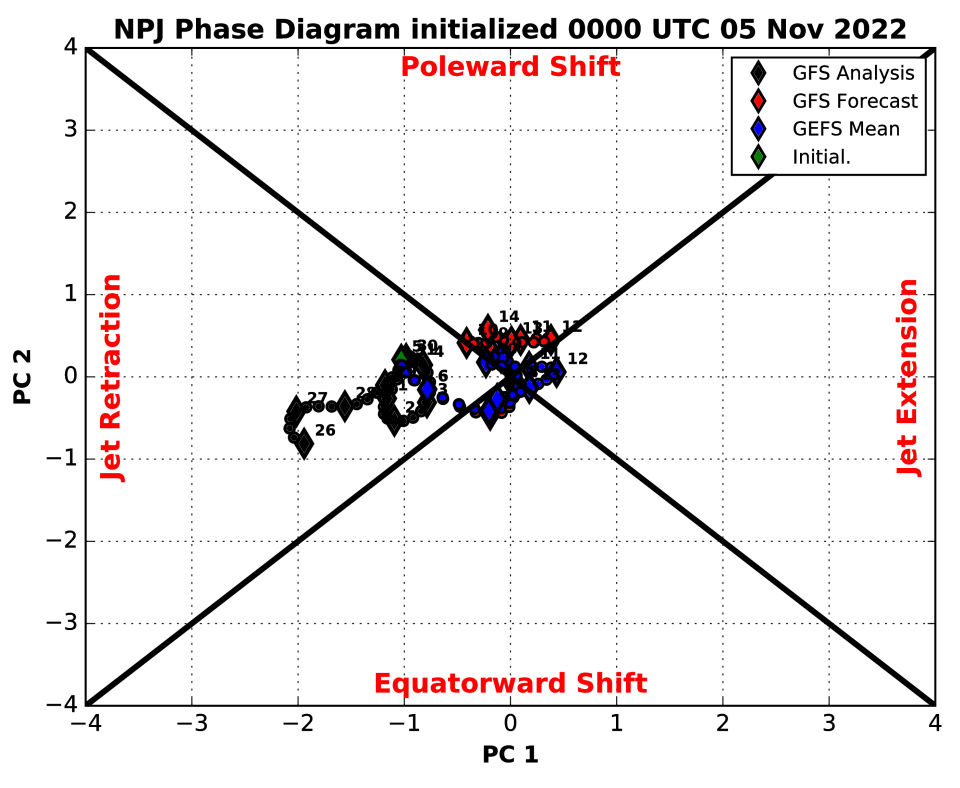
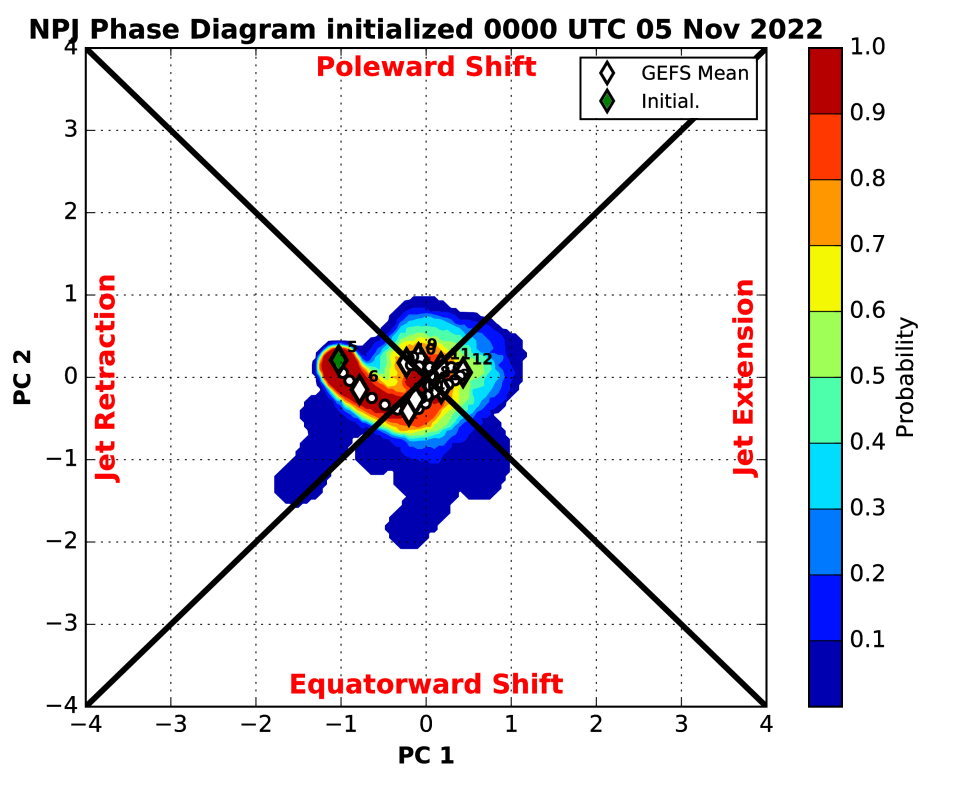
Looking at a few things, including the character of the Pacific jet stream and the MJO, suggests that the projected cooldown on the ensembles has legitimacy. Let’s start with the pattern over the last week leading up to Friday:
Past 7-day northern hemisphere 500mb heights and anomalies
The pattern is undoubtedly a warm one for the central and eastern CONUS and into southeastern Canada, with a positive AO (PV generally tight and confined to the high latitudes), a very positive EPO (the trough over Alaska and western Canada), a negative PNA (Aleutian ridge and West Coast trough), and positive NAO (trough over the north Atlantic).
The above pattern correlates very nicely to the expected pattern when the Pacific jet is retracted, as it has been most of late October and very early November per the above chart:
The flat ridge south of the Aleutians, trough over Alaska and western Canada/the western US, and downstream ridge over the eastern US are quite characteristic. There are a couple of ways to analyze how the Pacific jet is progged to behave on current guidance over the next week or so…one is just to throw in a loop of ensemble mean forecast 250mb winds:
European ensemble mean 250mb winds and high/low pressure locations
We start off in the middle of last week with a “jet retraction” look, with the jet barely extending off of Asia and a ridge over the Aleutians, directing the jet stream towards Alaska and the northwest coast of North America, helping facilitate the current very mild pattern across a good portion of the Lower 48. However, quite a bit of westerly momentum is getting added as I type this and into early this week. Initially, the ridge near the Aleutians just amplifies and disperses a lot of this added momentum around it, but eventually the jet extends and pushes the now-amplified ridge east, facilitating cross-polar flow into North America and really cutting off the Pacific influence by this upcoming weekend. Here is the GEFS forecast Pacific jet character:
A similar trend, from a pronounced jet retraction in late October towards neutral, with perhaps some modest lean towards an equatorward shift or jet extension over the next week or so. Here are what a Pacific jet extension or equatorward shift tend to look like:
Typical 250mb wind, SLP, and 850mb temp anomalies in an equatorward shift in the Pacific jetTypical 250mb wind, SLP, and 850mb temp anomalies during a jet extension over the north Pacific
Note the trend towards much higher heights into the northern Pacific and Alaska, with resultant troughing and colder weather over a good portion of North America…in particular, over western and central Canada into the northern Rockies and Plains with an equatorward shift, but bleeding towards the East Coast. The equatorward shift looks more like a -EPO but still somewhat negative PNA, while the jet extension looks more like a classic +PNA with a somewhat negative EPO. This generally matches the ensemble’s forecast pattern over the next week or so:
ECM ensemble 500mb height anomaly analysis/forecast valid November 2-11European ensemble 2m temperature anomaly analysis/forecast valid November 2-11
The impetus for this change seems to be a combination of increased east Asian mountain torque and tropical forcing working out of the eastern hemisphere and into the western hemisphere early this month. Initially, the pattern this weekend into the first half of the week simply looks like a significant amplification to the going pattern:
OLR and 200mb stream function and wave activity flux anomalies courtesy the JMA
At first, we just see the ridge south of the Aleutians amplify, which amplifies the downstream pattern over North America (western trough and eastern U.S. ridge). However, this very mild look over the eastern U.S. doesn’t last too much longer as the ridge amplifies into Alaska, forcing cold south towards the CONUS, and then east as an Aleutian low develops. An Aleutian low is a trend towards a more positive PNA.
Note positive MSLP anomalies (high pressure) dropping into eastern Asia right around now, signifying a significant increase in east Asian mountain torque, which results in added westerly momentum to the east Asian-Pacific jet. There may be another push later this upcoming week, before a fairly well agreed upon trend towards a much more negative east Asian mountain torque into mid-November:
European ensemble mean analyzed and forecast MSLP and anomalies
Positive East Asian mountain torque tends to result in an extension of the Pacific jet and subsequent rise in the PNA, as the extended jet and associated left-exit region towards the north-central Pacific tends to favor low pressure over the northwest Pacific or Aleutians and subsequent height rises to the east closer to the West Coast of North America.
Past 40 day MJO activity courtesy the CPC
At the same time, the MJO has come out of the Maritimes and into the western Pacific at a fairly high amplitude, and is now quickly working into the western hemisphere. The satellite/VP anomaly loops over the last two weeks show a similar trend as the above RMM plot, with strong uplift over the western Pacific until the end of October quickly shifting east. Note how areas that had the strongest upward motion (~120E) at the beginning of the loop have strong sinking motion now, and vice versa over portions of the central and eastern Pacific. Clearly, the tropical forcing is changing from the forcing that led into our current very mild pattern.
IR satellite and 200mb velocity potential analysis loop, courtesy of the CPC
After a decent Phase 7 passage, an increase in blocking near Alaska in October-December is quite common:
Lagged composites following a Phase 7 MJO in October-December, courtesy of CPC. Each lag represents a 5 day period after the MJO was in the RMM phase.
We are not going to get the NAO help in the short term, but blocking located near Alaska/a -EPO is often common during and following a phase 7 MJO this time of year as seen above. The MJO is about to briefly get into Phase 8, which also often leads to a colder outcome into the southern and eastern U.S. than a Phase 6-7 in the fall:
Temperature anomaly composite by MJO phase in October-December. These are valid at the time of the RMM registering that MJO phase (not lagged)
And for what it’s worth, the same October-December lagged composites from the CPC for a phase 8 MJO, which is briefly occurring right now:
The issue with these is that the pattern right now into this week, which would be a “Lag=0” for the current phase 8 RMM indication, is that the NAO is quite positive with a deep trough out west. That said, a phase 8 MJO this time of year often corresponds to immediate and short term blocking, with an Aleutian low/+PNA and colder trend over most of North America. This is then followed by the PNA trending more negative and blocking generally breaking down within a few weeks of the phase 8 MJO occurring.
Despite the phase 8 MJO pointing to a -NAO, I am fairly confident it will remain positive for the next 10-15 days. This is because the stratospheric PV, while getting stretched a bit at times, is going to remain on the stronger side of normal, which argues towards a +NAO for now. In addition, recall back to this EPS mean sea level pressure/anomaly loop:
Note multiple high pressure systems dropping in just east of the Rockies over the next 10 days. The Rockies are not quite as tall as the Himalayas, but they’re still plenty tall enough to produce a mountain torque that requires increased momentum in the jet stream to conserve angular momentum in this equation (the positive mountain torque removes momentum by slowing Earth’s rotation slightly). This speeds up the jet over the eastern U.S. into the North Atlantic, encouraging positive NAO trends. Given that the NAO has been positive since late October, I don’t see it flipping negative in the face of this through at least the middle of November.
Looking Beyond Mid-November:
A dramatic shift to a colder pattern in the CONUS, first into the Pacific Northwest over the next few days and then expanding into the rest of the CONUS through next weekend and through mid-November is agreed upon by the major ensembles and seems very well-supported by various forcing mechanisms…driven by a plunging EPO and rising PNA. But how long will it last, and does it mean shit for the approaching winter season as a whole?
To answer the first part of this question, we will examine things such as mountain torque and tropical forcing yet again. Starting with mountain torque, and picking up closer to mid-November, after our upcoming increase in mountain torque and injection of westerly momentum into the Pacific jet:
Positive east Asian mountain torque is ongoing at the start of the loop, but as low pressure develops over much of southeast Asia, this becomes negative, reducing westerly momentum into the Asian-Pacific jet around mid-November. This suggests the jet will have a tendency to retract again, which would render the upcoming PNA spike brief and could eventually cause the EPO to start trending more positive again.
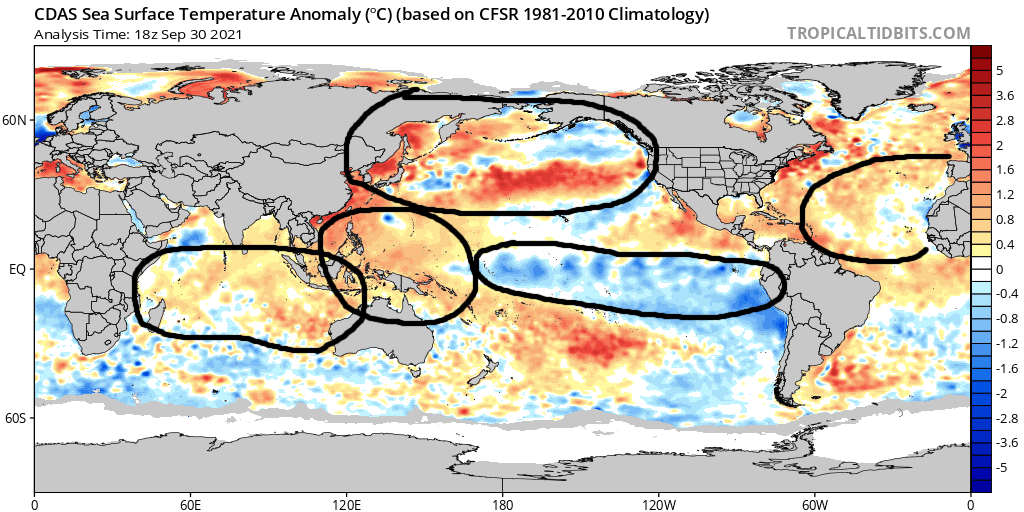
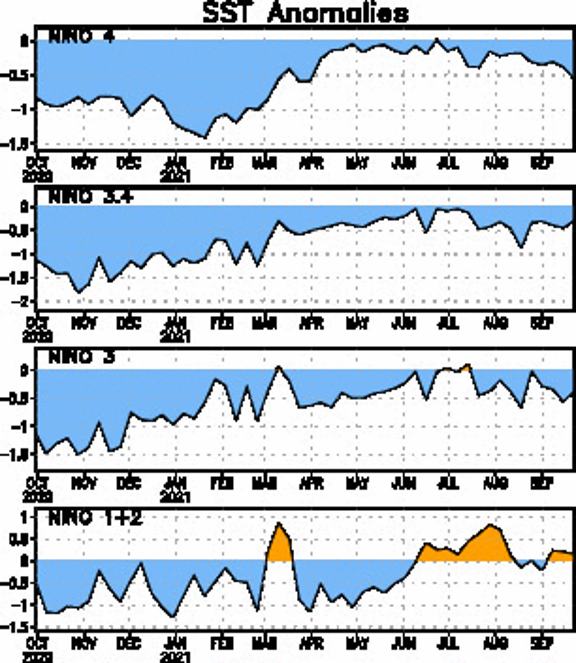
Remember, we are in a La Nina with a solid -PDO, evidenced by the cool tongue across the equatorial Pacific, the warm waters over the northwest Pacific, and the cool waters south of Alaska:
Current Sea Surface Temperature Anomaly Difference from Global Mean (valid November 5th)
These both favor a -PNA and often favor a predominantly +EPO as well. We look to buck that over the next week due to tropical forcing progressing through the Pacific and Western Hemisphere and due to a positive east Asian mountain torque, but when those shorter term pattern drivers subside, the lower frequency forcing can often dominate yet again. So, the expected negative east Asian mountain torque towards mid-November is a signal that a more -PNA and more neutral EPO is a distinct risk into the latter portions of November given the background forcing.
European ensemble rolling 7-day mean forecast 200mb velocity potential anomalies through November 20th
Most guidance (the European ensemble shown above) suggests tropical forcing quickly progressing through the western hemisphere over the next week or so, with eastern hemispheric forcing (in particular, over the eastern Indian/western Pacific oceans) becoming dominant once again towards the second half of November. Given the background state, this seems very plausible after the current higher frequency forcing moves through the western hemisphere in the shorter term. RMM forecast plots also indicate similar, with the ongoing Phase 8 MJO not lasting long and then becoming “indeterminant” (which usually means lower frequency forcing can exert more influence again). Thereafter, the MJO may move into phases 5 or 6 after the 15th. Here is the European ensemble forecast MJO progression through November 19th:
European ensemble forecast RMM phase
Recalling back to the above October-December MJO phase temperature correlation plot above, phase 6 is quite mild in the CONUS. This general evolution (eastern Indian/western Pacific Ocean tropical forcing becoming dominant again into mid-November) is well agreed upon by various medium to long range forecast models/ensembles. In addition, the water temperatures support convection and tropical forcing wanting to favor this general region again, as does where enhanced convection/upward motion has been most persistent in recent months near the equator:
Outgoing longwave radiation anomalies, courtesy CPC. Blues indicate enhanced convection
So, the background pattern suggests a risk for a retracted Pacific jet and -PNA/+EPO to return when other shorter-duration forcing weakens. In addition, there’s fairly consistent indication that the shorter-duration forcing (mountain torque, MJO) will weaken and may in fact positively feedback with the “background” La Nina pattern into late November.
There’s enough support for a significant cooldown that it will take some time for milder weather to return, we’ll probably have a full 1-2 weeks of generally cold conditions (for this early) across the CONUS. However, many indications are that milder weather gradually returns from west/southwest to northeast in the second half of November.
In terms of snow potential over the next few weeks, the higher elevations over much of the western U.S. will remain cold and active through this week with a -PNA and dropping EPO. As the cold ejects east late this week, a lee cyclone may bring snow potential to the northern Plains and Upper Midwest. Thereafter, it looks like a fairly dry EPO-induced cool/cold shot into the central and eastern CONUS. Not all hope is lost, as some snow may occur via lake effect, weak clippers, or perhaps any waves riding along the baroclinic zone if the sub-tropical jet isn’t totally quiet. Likely not a pattern that supports a widespread, major winter weather event (especially in November), but it’s possible some minor or localized snow events occur outside of the mountains starting this upcoming weekend and through roughly Thanksgiving.
Some Fun With ENSO/MJO Analogs:
The rest of the winter is not yet lost though. In fact, the findings discussed below are what prompted me to make this whole thing a blog post instead of a Tweet thread. I just thought “there’s a lot here, let’s try to tie it together better than intentionally cryptic Tweets would”.
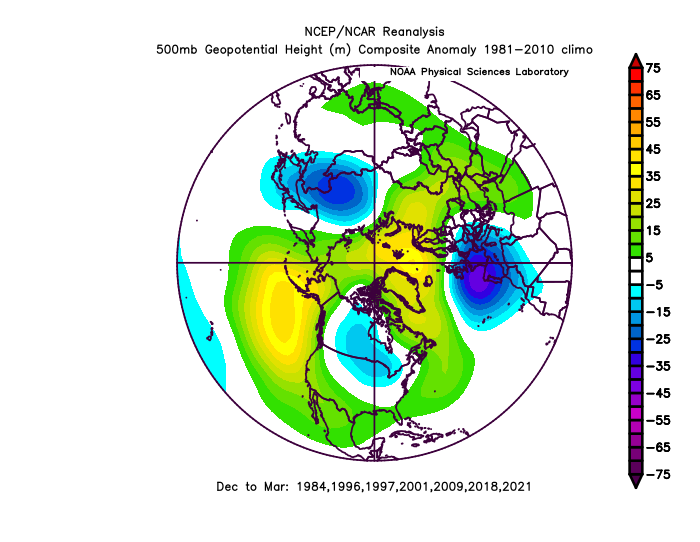
This much MJO activity in the fall leading into a La Nina isn’t too common. Since 1975, only 4 La Nina Novembers saw the MJO move into both phases 7 & 8 at an amplitude of greater than 1. Those are 1996, 2000, 2010 and 2016. Oh, there’s that fabled 2010-11 analog. We also have a very negative IOD and solidly westerly QBO. Let’s see if we can leverage those high-confidence, long-duration pattern drivers. We have a negative IOD this fall and will have a westerly/positive QBO through this winter, full stop.
2010 and 2016 had a westerly QBO
1996, 2010 and 2016 had a negative IOD
How did those 4 years play out during December?
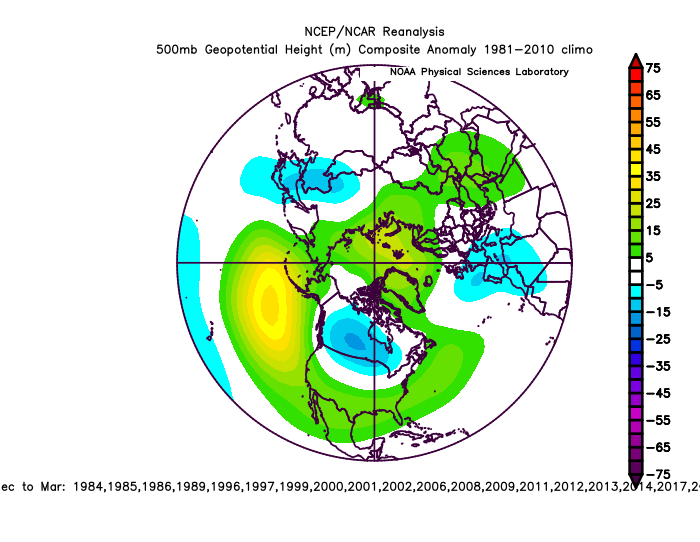
Re-analysis 500mb heights for December 1996, 2000, 2010 and 2016
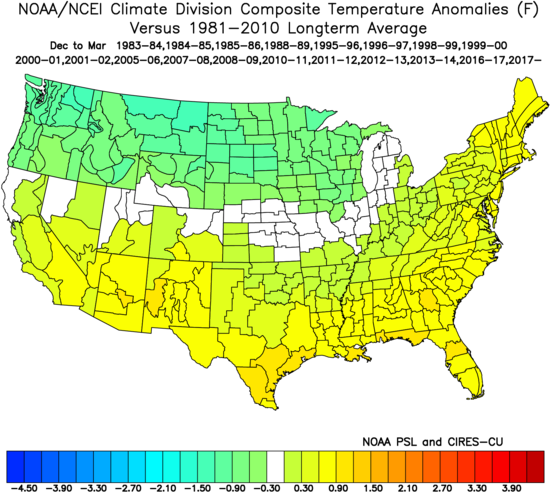
All but 2010 had a solid -EPO, and 2010 still had very pronounced north Pacific ridging along with a a huge -NAO. All but 2016 had a -NAO. All but 2000 had a -PNA. All but 2016 had a -AO. Here is a look at the October-January monthly temperature and precipitation anomalies for these years (weighted slightly based on QBO/IOD matches):
Temperature and precipitation by ENSO/MJO Analogs from October-January
For reference, here are October’s temp/precip anomalies:
Analyzed October 2022 Temperature and Precipitation Departures for the CONUS
Overall, the October pattern this year actually resembles those analogs, though with the pattern seemingly shifted west slightly. The very warm start to November likely dooms the eastern U.S. to finish with a somewhat mild overall month, but the pattern after this week may resemble these years in November fairly well. It’s at least in the ballpark enough that these analogs aren’t immediately invalid.
I believe how the MJO and mountain torque play out during late November and into December will heavily influence if the potential for a very blocky, cold, active December comes to fruition given the risks for a milder pattern (at least temporarily) returning by the end of November. Just looking at some various products, the EPS (already shown), GEFS, and Australian BOM MJO forecasts:
GEFS, EPS, and Australian BOM MJO forecasts from November 4
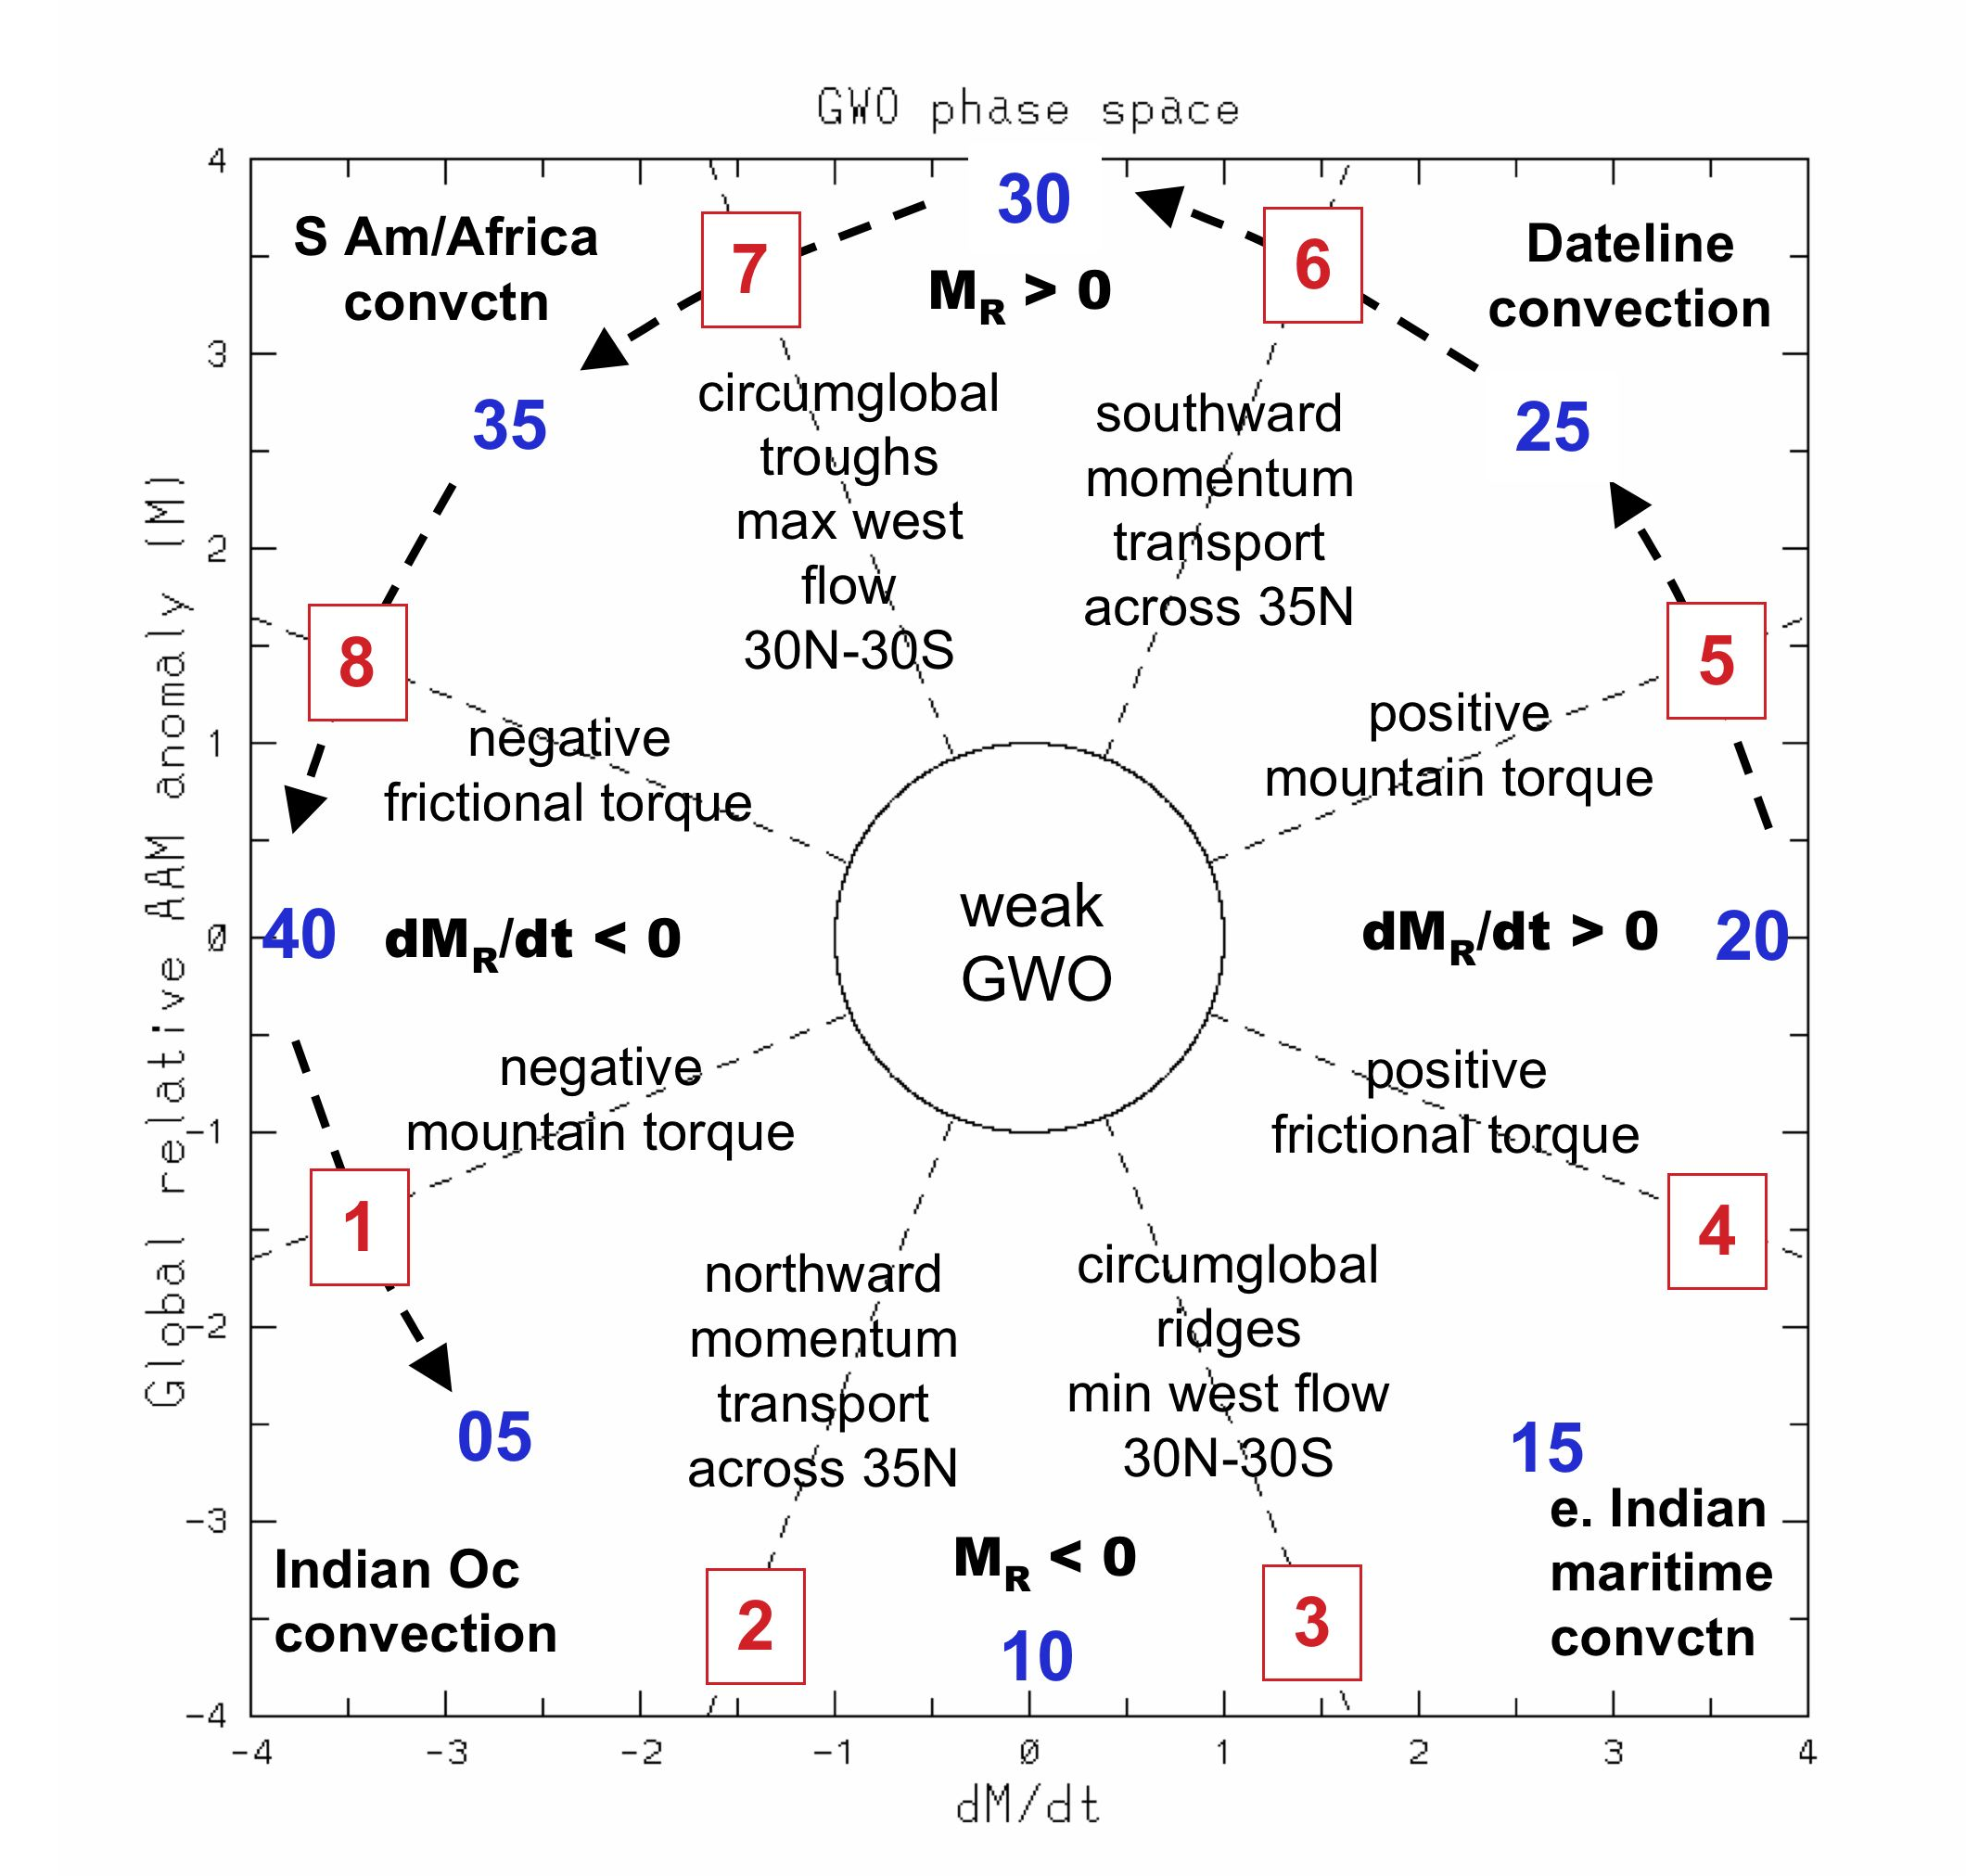
The GFS/Euro both have the MJO strongly and definitively progressing through phase 6 and towards phase 7 into late November. This could be indicative of a similar angular momentum/global wind oscillation orbit to what we are currently seeing, as per this CFS forecast:
CFS ensemble GWO phase forecast, courtesy Victor Gensini
An orbit through phases 5-7 (as has recently occurred) supports convection moving east towards the Dateline and eventually the western hemisphere, along with positive mountain torque and troughiness into the mid-latitudes:
Global Wind Osciallation/GWO Phase Space Diagram, courtesy PSL/NOAA
With that said, we are fighting the background state and there is some uncertainty to how all of this progresses 10-20+ days out. Getting the tropical forcing to propagate east again (as the GFS/Euro ensembles are suggesting towards late November) and getting another push of increased east Asian mountain torque is likely critical towards the door being open for a very block and cold December with elevated snow potential across a good portion of the CONUS. If not, the chances for a mild start to the winter quickly increase.
It’s still a little early on in the game, but we’re getting to the point where we can start narrowing down what various “pattern drivers” may look like this winter and examine analogs and even some seasonal forecast guidance for clues. For the most part, I’ll focus on cool ENSO winters / La Ninas and expand from there, with emphasis on tropical SSTs / forcing and the QBO.
For those who just want the maps, here are my current thoughts on temperature and precip through the winter. I’m lumping March into winter because it’s a month that can still prove to be productive for snow for many areas, and because many analogs are chilly in March. The detailed write-up with reaosning, analogs, and a look at longer range seasonal models follows. I hope to follow up with more focused thoughts in November, time permitting…
My guesses on teleconnections:
AO: Solidly negative.
NAO: Near neutral or slightly negative overall, possibly large swings
EPO: Near neutral or slightly negative overall.
PNA: Negative, especially later in winter
A stronger or more central-Pacific La Nina could pose warmer risks, especially in the central and eastern U.S., as would a strong stratospheric PV early in the winter that’s coupled to the troposphere. A quick increase in sunspots could also be a warmer risk. If forcing ends up more focused farther west into the Indian Ocean it’d likely point to a warmer winter.
The La Nina staying weak to moderate and more basin-wide would point to a chillier outcome with more blocking being more likely. A weaker stratospheric polar vortex early in the winter, and tropospheric blocking developing in November, would also point towards a chillier / blockier outcome. Scandinavian or Ural ridging in October or November would also point towards a chillier and blockier direction, as would sufficient tropical forcing occurring east into the Pacific at times.
I expect a very up and down winter, with very cold air frequently available over Canada that occasionally works south into much of the central and eastern CONUS this winter, along with the Northwest. The Southwest will generally be milder with a somewhat weak sub-tropical jet. The southern Plains, Gulf Coast, Southeast and lower mid-Atlantic will probably lean mild due to sharp warm-ups when blocking relaxes and / or the PNA shifts negative, though a couple of periods of EPO-induced cold all the way to the coast are possible. The most persistent cold will be in the northern Rockies and Upper Midwest. The analogs really like the first part of winter (December into January, possibly starting to turn colder in November) for blocking and cold into the central and eastern US (with cold focused more on the northwest in February). The analogs have a -EPO, -NAO, and -PNA pattern in March.
I’m optimistic about snow in the northern Rockies and Pacific Northwest, along with from the Great Lakes and Ohio / Tennessee Valleys into much of the Northeast and New England. Along I-95 from Baltimore to DC and Richmond, events will be rainy at times when blocking relaxes so snow will struggle to reach or exceed normal, though there should be opportunities for wintry weather when blocking is strong enough to suppress the Southeast Ridge.
The technical write-up / thoughts:
Starting with SSTs…a few features stand out:
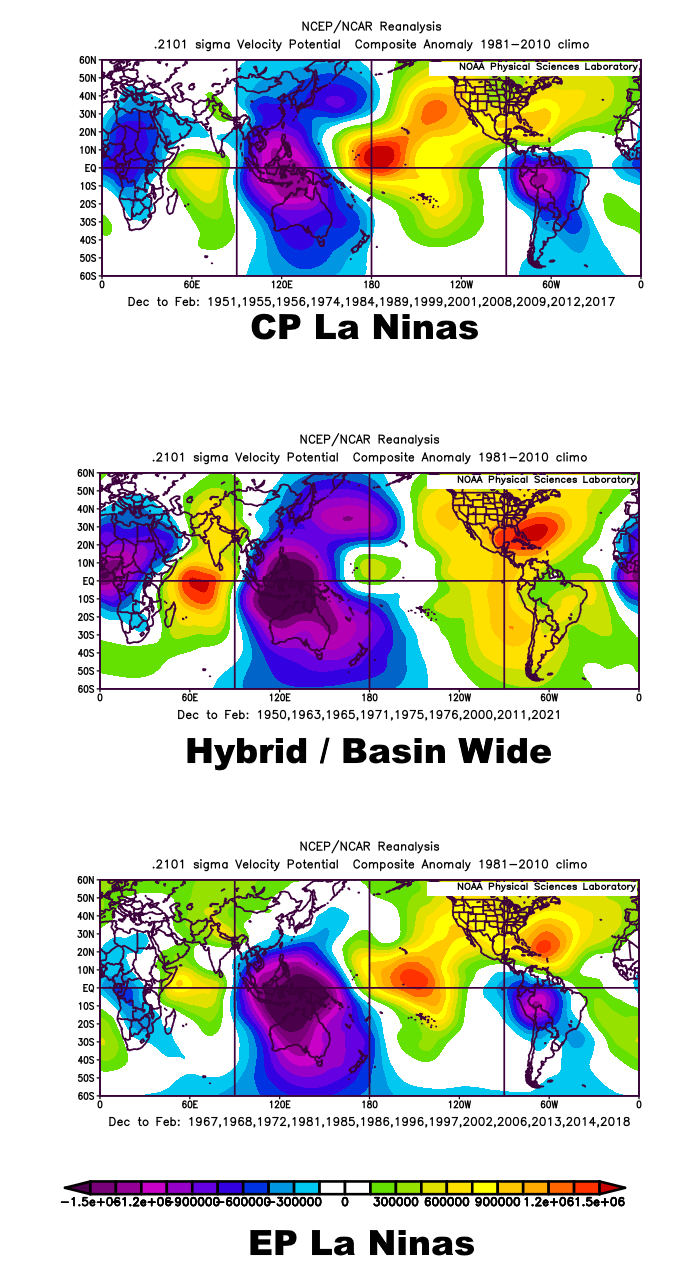
A developing La Nina that appears likely to be weak to moderate and likely “hybrid / basin wide”, perhaps with a modest east lean
While the North Pacific is warm overall, the PDO is decidedly negative (very warm waters near Japan, cool waters south of Alaska)
The western Pacific warm pool is quite robust, as has been more common than not lately
The Indian Ocean Dipole is somewhat negative, similar to last fall
While not entirely classic, the AMO is positive
We’ll start with a La Nina focused approach and then expand from there, focusing on winters since 1950. To give the best sample size possible, I initially started with all cool ENSO years (everything from cool neutral to strong La Nina). Here is what the last 20 cool ENSO winters looked like from the December – March period:
Mean 500mb pattern for December – March for the last 20 winters with a cool ENSO
CONUS mean temperature departures for the above winters
CONUS mean precip departures for the above winters
Please note that through this exercise, I use the most representative average on the US Climate Division plots, as using the 91-20 averages will make everything with older years look colder than they should.
It’s overall what you’d expect in a La Nina, with a predominantly -PNA and cold focused over western Canada and the NW US. The inclusion of some cool neutral years probably helps skew the AO and NAO somewhat more negative than if I didn’t include them, as 5/7 cool neutral ENSO winters have a predominantly -AO in the December-March period, and the two that average positive both had one month that registered -1 or lower.
Some recent La Nina winters have gone huge…95-96 and 10-11 are the best examples, though even a year like 17-18 had some very legitimate cold and snow even if it also torched at times. Others, like 11-12 and 16-17 (even though the latter was still snowy in parts of the interior Northeast) were blow torches. La Nina is a nice starting point, but what “flavor” can we expect this year?
We’ll first start by looking at cool ENSO / La Nina winters by strength:
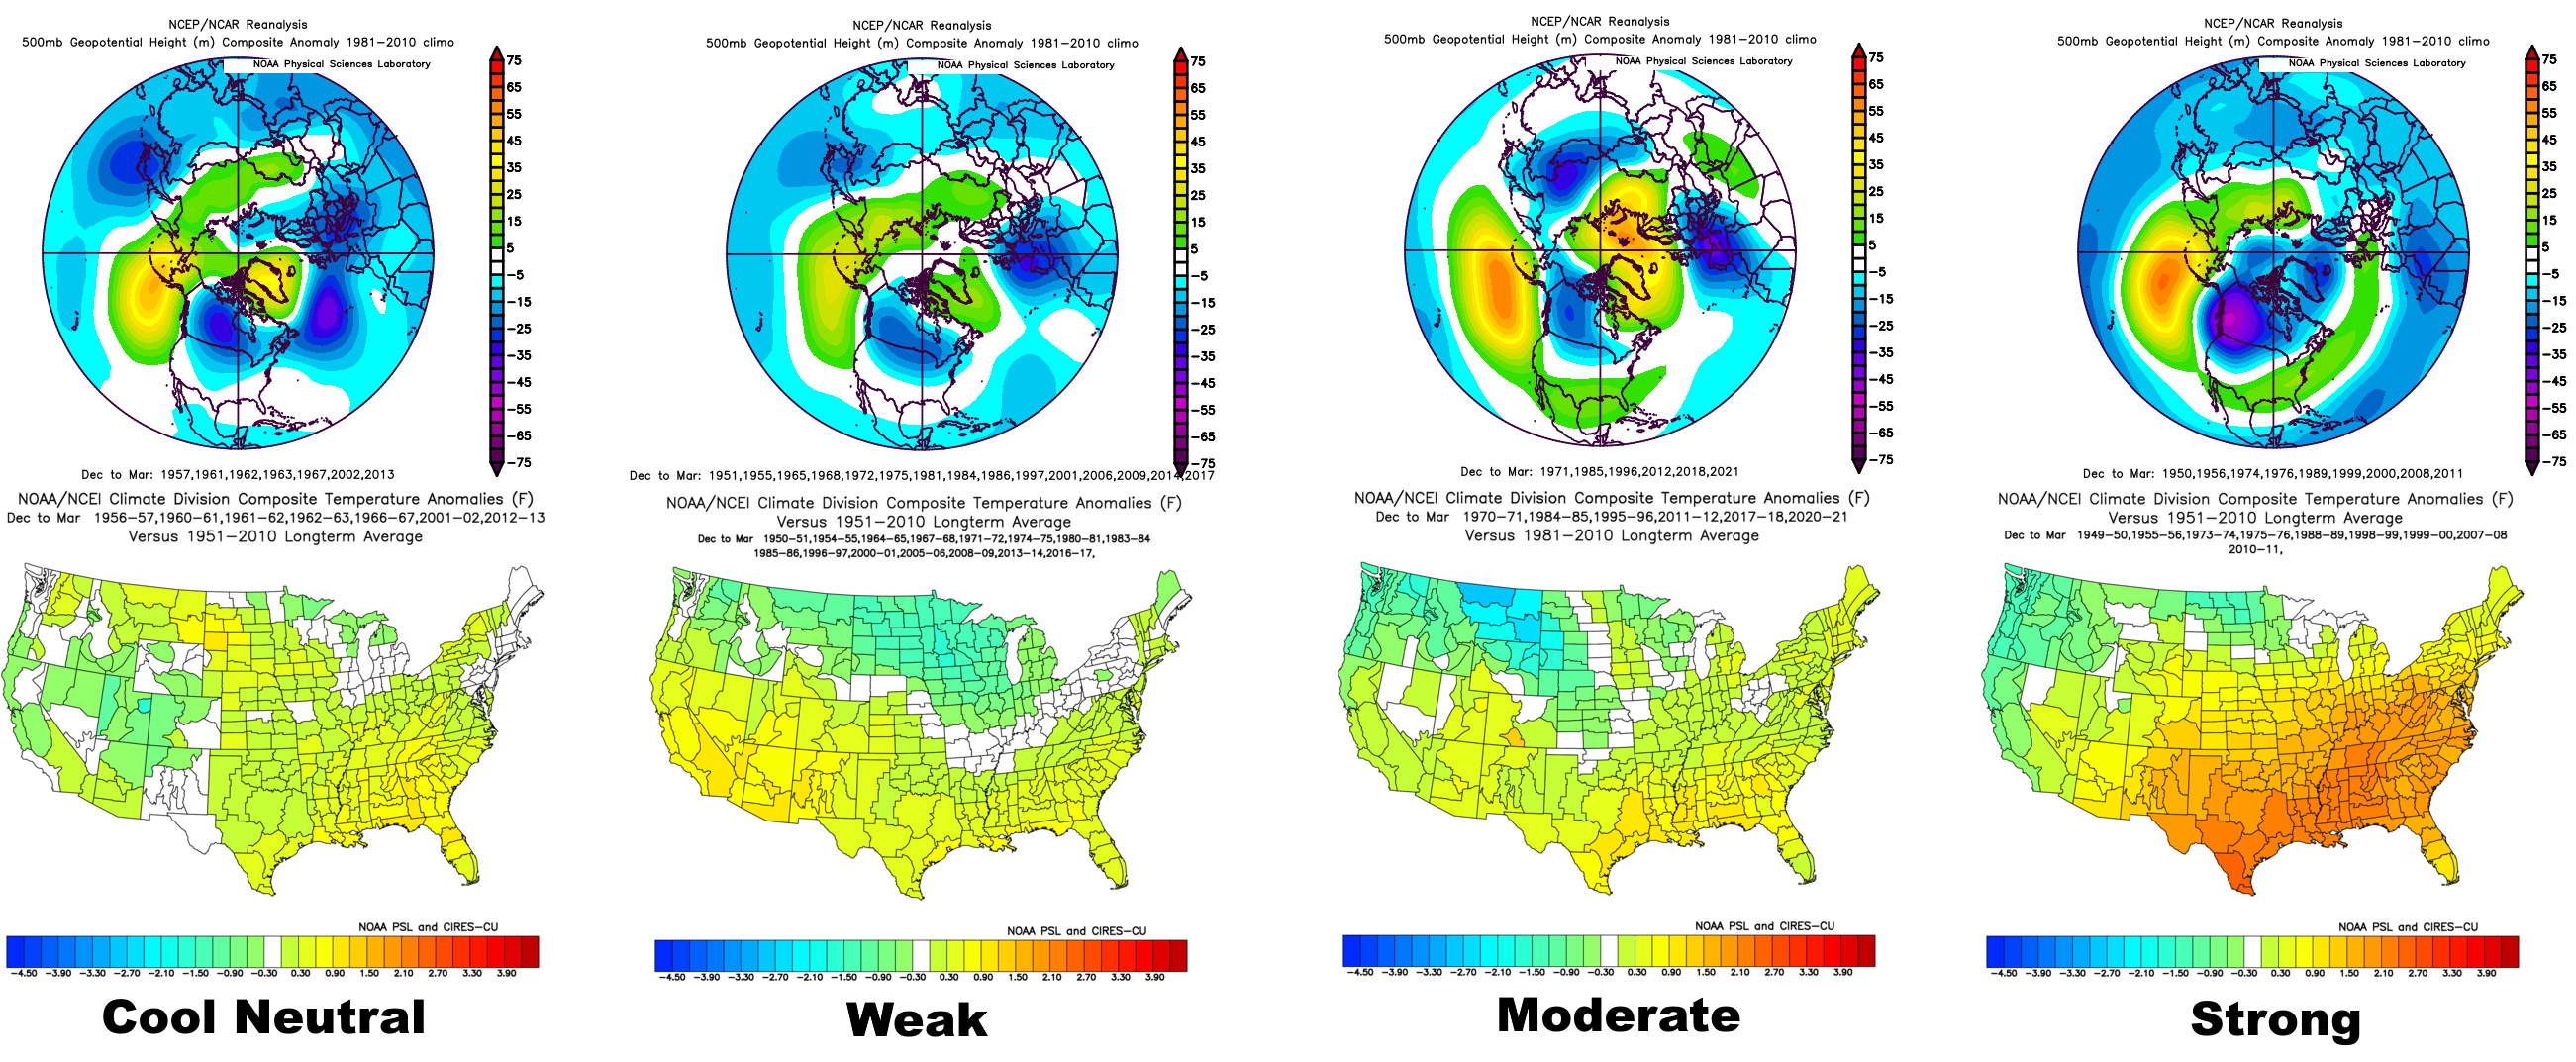
Cool ENSO winter 500mb and CONUS temps by event intensity
Cool neutral looks least “Nina like” with the North Pacific ridge edging farther east, a solidly -NAO, and unsurprisingly given the weak ENSO, a somewhat less defined temperature pattern (and is notably cooler in the Four Corners). Weak to moderate La Ninas begin to take on the most classic pattern, with the mean north Pac ridging shifting south / west, though it’s not totally disastrous until you get to the strong La Nina mean pattern. Note that only the strong La Nina composites have a blatantly +AO and NAO pattern, and unsurprisingly they’re by far the warmest, even with a winter like 2010-11 somehow happening with a strong La Nina.
Some stats to ponder, that will be referenced more throughout. Again, it’s still a small-ish sample for each individual ENSO intensity, so debatable how many of these are statistically significantly, but this isn’t a paper it’s a blog post so let’s not dwell:
Out of all cool ENSO winters since 1950, 15/37 (41%) had an overall -NAO for the December – March period, with 5 more (14%) averaging positive but still having 1 or 2 months with notable blocking. 22/37 (59%) had an overall -AO for the period, with 4 more (11%) averaging positive but still having 1 or 2 months with notable blocking.
“Notable blocking” is defined as one month with a -NAO or -AO (whichever one I’m referencing at the time) with a value of -1 or lower, or two months of -0.5 or lower, even if the overall December-March period averages positive.
The difference between La Nina winters that have a -AO vs a +AO is significant. Here are -AO La Nina winters in the CONUS (leaving out cool neutral years) vs the +AO La Ninas:
Winter La Nina CONUS temperature by AO
Of these 37 cool ENSO events, 32 occurred when reliable records for sudden stratospheric warming events (SSW) have been kept, and 16 of those 32 (50%) had a SSW event. Here is what any La Nina winter (this excludes cool neutral winters) with a SSW looked like, vs any La Nina winter that didn’t have a SSW:
Winter La Nina CONUS temperature by SSW event
Interestingly, there is little difference from the Upper Midwest into New England. However, the mean for La Ninas with a SSW is cooler across the southern U.S. across the board. This likely indicates that cold air punches well south more easily in a La Nina that has a SSW event vs one that doesn’t.
Some more stats:
Cool neutral ENSO winters: 3/7 had a -NAO overall with 1 more having notable blocking. 5/7 had a -AO overall, and the other two had notable blocking. 2 out of 6 possible winters (one being too far back in time for reliable SSW data) had a SSW event.
Weak La Ninas: 6/15 had a -NAO overall, with 4 more having notable blocking at some point. 9/16 had an overall -AO, with 1 more averaging positive for the D-M period but having notable blocking at some point. 6/13 possible had a SSW event.
Moderate La Ninas: 4/6 had an average -NAO, and 1 more had notable blocking. 5/6 had a -AO overall. 4/6 had a SSW.
Strong La Ninas: 2/9 had an overall -NAO, and 3/9 had a -AO, with 1 more having a notable negative month. Surprisingly, 4/7 possible had a SSW.
Overall, 8/16 cool ENSO winters that had a SSW went on to have an overall -NAO, with one more still having a month or two of notable negative NAO. 10/16 had a -AO, with two more still having a notable negative month or two. Overall, the SSW cool ENSO winters as a whole aren’t necessarily more prone to having a -AO than other cool ENSO winters but it does seem to at least somewhat help -NAO prospects.
While La Nina does tend to promote a stronger polar vortex, and hence can help lead to a +NAO, AO, and EPO (quite a warm pattern, just ask January and February of 2020 or much of the 2011-12 season), clearly cool neutral events, along with weak and moderate La Ninas, can be workable with regards to either an overall -NAO or -AO winter, or a winter that averages positive but still features notable blocking episodes.
La Nina Location
Beyond the intensity of La Nina, the location of where the cooling is focused is quite important. This is similar to the whole “El Nino Modoki” thing, except with La Nina, and can make a big difference. The idea of focusing not only on the strength of the La Nina, but also where the cooling is focused, has gained quite a bit of traction in recent years, and this is a commonly referenced paper:
The following figure from that paper shows the differences they found between eastern Pacific and central Pacific-based La Nina events:
Winter sea level pressure and 300mb height anomalies by La Nina location
The EP events (top) have a more neutral AO (whereas the CP events have a very positive AO), along with slightly more ridging into Alaska and a somewhat negative NAO. This results in a much weaker (though, still present) Southeast Ridge compared to the CP events. Overall, the pattern shown for EP La Ninas is not nearly as warm (and futile for snow) in the central and eastern U.S. as CP La Nina events.
Winter 500mb heights and CONUS temperature by La Nina location
I binned the aforementioned 37 “cool” ENSO years into central Pacific, eastern Pacific, and “hybrid” (characteristics of both) based events. Note, a few of the cool neutral events were too undefined and left out. It roughly matches the paper…eastern Pacific-based events have a weak mean -AO and -NAO, with more ridging into Alaska, resulting in the coldest temperature composite across the CONUS. Central Pacific events are least hospitable for cold / snow in the central and eastern U.S. overall, with a +AO, +NAO, and +EPO mean, while the hybrid events are decidedly La Nina-like in the Pacific, with a -PNA, but have enough of a -NAO that they’re somewhat redeemable. In general, central Pacific-based events tend to be stronger than eastern Pacific-based ones.
Winter VP anomalies by La Nina location
Here are the VP anomalies sorted by “location” or “type” of the La Nina…the standing wave is focused near 120-130E in all of them, though CP La Ninas have the strongest sinking anomaly near the Dateline. Dateline convection is good for cold in the central and eastern US, whereas a lack of it isn’t. That seems like the most striking difference to me.
Out of the 12 CP events ID’d, 4/12 had an overall -NAO, though 6/12 managed an overall -AO, with one more having notable blocking at some point.
Out of the 9 hybrid events, 5 had a -NAO and one more had notable -NAO months at some point…interestingly, 5/9 had an overall -AO, but no other years have a +AO but notable blocking in 1-2 months (this is one of the few where there’s more -NAO than -AO).
Out of the 13 EP events ID’d, 5 had an overall -NAO, with 4 more having notable -NAO months worked in. 8/13 had an overall -AO, and 3 more had notable -AO months worked in.
Overall, the CP events seem somewhat less likely to have a -NAO and -AO than overall cool ENSO winters, though some winters have done it. Hybrid events seem a bit more prone to having a -NAO winter, while EP events don’t hurt -NAO chances and really help -AO chances.
This Year’s La Nina
SST anomaly by ENSO region
So far, the surface cooling has been gradual and modest, with Nino 3, 3.4 and 4 near a -0.5C anomaly…Nino 1+2 has been struggling to dip negative, though has cooled a bit recently. The sub-surface is more impressive, however:
Loop of sub-surface water temperature anomalies in the Pacific
There’s a fairly large area of greater than -2C anomalies beneath the central Pacific. So far, it’s been a struggle for this to upwell efficiently, especially the farther west you go, but the sub-surface anomalies are notable…greater than they ever got with last winter’s borderline moderate event:
Upper-ocean heat anomalies in the equatorial Pacific
The SOI averaged +16 in July, +4 in August, and +9 in September, likely coming in near 10 in October based on my very informal eyeballing of forecast MSLP patterns across the Pacific. As long as this keeps up, the surface should continue to at least gradually cool through the fall as the chilly sub-surface water upwells.
With the surface still consistently running warmer than 2020, but with a cooler subsurface and continued positive SOI, it seems like a solid weak La Nina is favored with moderate still possible if we see more surface cooling soon.
CFS model forecast Nino region 3.4 SST anomalies
The CFS continues to advertise a borderline strong La Nina and has consistently been on the strong side of guidance with this event. SSTs over the last couple of months have not been cooling as quickly as the CFS has been insisting on. With a continued +SOI and enhanced trades, to go along with the chilly subsurface, cooling of the surface through the fall is quite likely, but the rapid cooling into October isn’t quite happening so the CFS still seems too strong with its forecast.
European model forecast ENSO region 3.4 SST anomalies
The ECM ENSO plumes are on the other side, with the mean being a borderline weak La Nina that weakens into the spring. The CFS also has the weakening into the spring. However, the ECM is already running slightly too warm with the forecast heading into the beginning of October (we’re right around -0.5C right now), and in my opinion doesn’t have enough cooling through the fall. A few members still touch moderate.
IRI multi-model ENSO plume
The September IRI ENSO plumes seem like a decent middle ground, as the dynamical average (red line) has a tri-monthly peak of around -0.8C. I feel like some strengthening is likely through the fall before weakening into spring, and that a solid weak La Nina is likely with some potential to reach moderate.
From the same aforementioned paper, here is the overall profile / evolution of east based, central based, and “hybrid” La Nina events (respectively):
Time longitude plots of SST anomalies by ENSO type (Zhang et al.)
In the eastern-based events, the cooling is initially centered off the South America coast and gradually propagates westward, whereas in the central Pacific-based events the cooling is centered west of 150W. Hybrid events initially have a more east-based cooling but tend to be stronger and eventually cool more into the central Pacific.
Time longitude plot of SST anomalies in the equatorial Pacific this year, courtesy CPC
This time-longitude plot of the SST anomalies, courtesy of the CPC, shows that cooling was initially east based late spring into early summer, and is still firmly strongest east of 150W. However, Nino regions 1-2 have been somewhat warm until very recently, and there has been a bit more cooling near and west of the Dateline than is typical this early in an east based event. This event is NOT central-based, but it may be something between an east-based and hybrid event as 2020-21’s La Nina was.
First cut of the cool ENSO winters…winters that saw a weak to moderate La Nina that was either east-based or hybrid:
December – March 500mb anomalies in weak-moderate, mixed or east-Pacific La Ninas
CONUS mean temperature departures for the same winters
Certainly not a bad look at all, with ridging in the North Pacific amped enough to force the PV a little farther southeast over North America, which is quite a bit cooler for the central and eastern CONUS. There’s also a somewhat -AO and -NAO in the mean pattern. Somewhat typical La Nina precip pattern, wet in the Pacific NW and northern Rockies, along with the Ohio Valley, though somewhat drier into places like New England. As is often the case most of the south is fairly dry overall in these winters, though places like NM and western TX aren’t quite as dry.
7/14 of these winters had an overall negative December-March NAO, and 5 more were positive overall but had a month or two of notable negative. 10/14 had a -AO overall, with one more having some notable blocking worked in. Overall, a greater share of both -NAO and -AO winters than all cool ENSOs combined. 7/14 had a SSW event.
Second Year La Nina
Before moving on to some QBO stuff, just wanted to touch on 2nd year Ninas, as that’s often a point of emphasis (first vs second year ENSO events) when searching for analogs. Overall, 2nd year cool ENSO events (of all intensity and location) are ugly:
December – March 500mb height anomalies for 2nd year La Ninas
That’s a +EPO, -PNA, and at-best neutral NAO and AO. It’s a mild look for the eastern US with a Southeast Ridge. Taking 2nd year cool ENSO events and limiting it to weak-moderate, east-based and mixed La Ninas, it improves a bit:
December – March 500mb anomalies for 2nd year weak-moderate, mixed or east-Pacific La Ninas
The biggest differences are the EPO being noticeably less positive (and perhaps a bit negative overall), and lower heights over southeastern Canada which would keep the Midwest, Great Lakes and New England colder. Differences at the surface, all 2nd year cool ENSO events on the left, the better ENSO intensity and location matches on the right:
December – March mean CONUS temperature anomalies for all 2nd year La Ninas since 1950 (left), and for 2nd year weak-moderate, mixed or east-Pacific La Ninas (right)
Overall, it’s encouraging that the “better” 2nd year ENSO matches are colder than all 2nd year events. Not many of these winters are great QBO matches (which I’ll get to next) and it’s not a huge sample, so even though 2nd year La Ninas kind of get a bad rap (and you can see why) I don’t think it’s any kind of overwhelming factor here.
Quasi Biennial Oscillation (QBO)
Current QBO progression, courtesy of Goddard Space Flight Center
We’re going to have a -QBO at 30mb and 50mb this winter. The September value at 30mb was -16, and there are stronger easterlies above 30mb that are still downwelling. The 30mb QBO will be quite negative through this winter, potentially starting to rise into spring. We will start first with cool ENSOs that have a negative / easterly QBO at 30mb:
December – March 500mb pattern for La Ninas with an easterly QBO at 30mb
December – March CONUS mean temperature departures for the same years
The main differences to the overall cool ENSO winter composites is a more -NAO and lower heights over much of North America, which mutes the Southeast Ridge somewhat in the means.
9/18 of these east QBO 30mb winters had an overall -NAO, with 3 more having notable blocking for a month or two. 13/18 had an overall -AO. 9/14 possible had a SSW event. Overall, having a -QBO at 30mb in a cool ENSO winter seems to increase the potential for a -NAO, -AO, and a SSW event at least somewhat compared to normal in a cool ENSO winter, which isn’t unsurprising.
When you take just the weak-moderate, east-based or mixed La Ninas with an easterly QBO at 30mb, you get this:
December – March 500mb pattern for weak-moderate, mixed and east-Pacific La Ninas with an easterly QBO at 30mb
CONUS mean temperature departure for the same winters
The big change is a somewhat more -AO and much more -NAO, which results in lower heights across much of the northern and eastern CONUS compared to the full set and is much cooler overall over the eastern US. It’s quite a good look and includes some La Nina winters that went quite “big” in the snow department.
4/6 had a -NAO overall, and the other two had a month or two of notable negative values. 5/6 had a -AO overall. 4/6 had a SSW event at some point.
Closer Examination of this Year’s QBO
If you recall back to the current time-height chart of the QBO, the structure of this year’s QBO is easterlies descending through the stratosphere, with westerlies hanging on below 50mb into the winter. We actually have a decently large set of years to use for this exercise. We have 11 cool ENSO winters with a similar QBO structure / evolution, and 9 with a rather opposite structure / evolution. We will explore what this does now…here are the years with a similar QBO:
December – March 500mb anomalies for cool ENSO winters with a similar QBO progression to this winter
Mean CONUS temperature departures for the same winters
Along with a somewhat -AO and decently -NAO, the EPO is decidedly more negative than all cool ENSO events combined, and even more negative than just easterly 30mb QBO winters with better ENSO matches. The PNA is closer to neutral too (though I’m not sure I buy that given how negative the PDO looks heading into the winter). Overall, 6/10 of these winters had a -NAO overall, with one more with notable blocking for a month or two. 8/10 had a -AO overall, and 7 had a SSW event.
Here are the 9 cool ENSO winters with a relatively opposite QBO structure to this winter:
December – March 500mb pattern for cool ENSO winters with opposite QBO progression to this winter
Mean CONUS temperature departures for the same winters
Definitely a much more -PNA, +EPO and +NAO, giving the cold west, warm east look that pops up and ruins some La Nina winters. Excitedly and probably not surprisingly, this difference holds up when looking at weak-moderate, east-based and hybrid La Nina events:
December – March 500mb anomalies (top) and mean CONUS temperature departures (bottom) for weak-moderate, mixed or east-based La Ninas for years with similar / opposite QBO evolution to this winter
Here’s a look at how similar ENSO (weak-moderate, east based or mixed La Nina) winters act with similar QBO evolution and opposite QBO evolution. The sample size does start getting rather small for the oppose QBO winters, but overall, you can see the large difference in the EPO, PNA, and even NAO domains and how winters with a similar QBO to this winter tend to be colder overall in the CONUS…and tend to be colder in the east and warmer in the west.
The winters with a similar QBO and ENSO (the set on the right in the above image) all have blocking…4/5 have a -NAO, and the other (17-18) had a notable -NAO for one month. They all had an overall -AO. 4/5 of those winters had a SSW event.
Thus far, the anticipated strength and location of the La Nina, along with the QBO (both just having a -QBO at 30mb, but especially the evolution with the easterlies downwelling through the stratosphere during the winter) all point to increased potential for a -AO and -NAO compared the typical cool ENSO winter, along with optimism that the EPO can be neutral to perhaps somewhat negative this winter…most signs, so far, pointing to this being the type of La Nina winter that doesn’t have the stereotypical cold west / warm east look with a +NAO and Southeast Ridge.
Solar Cycle
Graph of sunspot numbers and cycle
We are coming out of a deep solar minimum between solar cycles 24 and 25. Many papers (such as this one: https://agupubs.onlinelibrary.wiley.com/doi/full/10.1029/2005JD006283) have attempted to establish a link between the solar cycle and northern hemisphere winter stratospheric / blocking patterns. In general, years in a solar minimum tend to have a weaker stratospheric polar vortex and are more prone to blocking, with the opposite true in solar maxima winters. There has been some theorizing that the signal lags a bit, i.e. the greatest potential for blocking is during and just after a solar minimum (and vice versa for maxes). Regardless, sunspots are beginning to increase as we head into cycle 25; barring a significant increase this fall this shouldn’t be a negative yet.
Out of the 37 cool ENSO winters examined since 1950, 11 occurred during or within a year or two of a solar minima. Here is what their overall 500mb and temperatures did when blended together:
December – March 500mb pattern for cool ENSO winters with low solar
Mean CONUS temperature departures for the same winters
It’s somewhat reassuring that there are several winters in here that don’t make the previous QBO or “better ENSO” sets, and we still get a signal for somewhat higher heights into AK, a better -NAO signal, and a cooler look overall in the CONUS compared to the “base” for cool ENSO winters. With small sample sizes and the same years showing up in certain sets, it’s tough to filter out what’s legit or not, but there are a few strong La Ninas in here, several winters that are poor QBO matches, and a few central Pacific La Ninas, so perhaps there is at least something there to the idea of being in or just past a solar minimum enhancing blocking potential in a cool ENSO winter.
Out of these 11 winters, 5 had an overall -NAO, though 3 more also had notable negative values for a month or two as well. 7/11 had an overall -AO, and one more had a strongly negative month mixed in. 5/10 possible had a SSW. Small-ish sample, but it does seem that overall this portion of a solar cycle is at least somewhat more conducive to a -AO (and somewhat a -NAO) compared to all cool ENSO winters.
Like everything else, focusing on weak-moderate, east-based or mixed La Ninas makes the Pacific a bit more favorable and doesn’t hurt the -NAO signal overall, which makes things a bit cooler over the central and eastern US:
December – February 500mb pattern for weak-moderate, mixed or east-Pacific La Ninas with low solar
Mean CONUS temperature departures for the same winters
Interestingly only 3/6 have an overall -NAO for December – March, though the 3 that averaged positive (85-86, 96-97, 17-18) still have a month or two of notable negatives. 5/6 had an overall -AO, and the one that didn’t (96-97) still clocked a -1.7 for December. Despite all having an overall -AO/NAO or at least some notable blocking at some point even if it was positive overall, “only” 3/6 had a SSW event. Small sample, but impressive that each winter in a similar point in the solar cycle with a reasonably close ENSO to this year had some notable -AO/NAO at some point (if not simply negative overall for the whole winter).
Indian Ocean and Western Pacific Warm Pool
Moving back towards SSTs and tropical forcing, we have a somewhat negative Indian Ocean Dipole this fall along with a very robust western Pacific warm pool. Out of the 37 cool ENSO years since 1950, only 11 have a somewhat similar or similar combination, likely because the western Pacific warm pool has been growing more robust in general with time. All of these years are 1983-84 or beyond. First, here’s the entire set, regardless of how flimsy the ENSO match is to this year:
December – March 500mb pattern for cool ENSO years with a warm West Pacific and negative-leaning Indian Ocean Dipole
Mean CONUS temperature departures for the same winters
At 500mb and the surface, it’s fairly similar to the last 20 cool ENSO winters overall, though is somewhat cooler overall, especially over the eastern U.S. The EPO is a bit more negative in these winters, as is the AO, compared to all recent cool ENSOs overall. Robust forcing moving through the western Pacific, especially in the late fall and early winter, can help pump ridging into AK and also has been known to lead to disruptions to the stratospheric polar vortex. However, in mid-winter, forcing in those areas does (at least at t=0) tend to correspond to warmer conditions over the eastern CONUS, which may be why the set isn’t especially cold overall in the south and east, despite some encouraging sings for blocking.
Of the 11, only 4 have an overall -NAO for December-March, though 2 more have some -NAO for a month or two as well. 6/11 have an overall -AO, with 3 more having notable -AO for a month or two. Notably, 8/11 have a SSW event.
It’s worth noting that only 4 of these winters are a decent ENSO match..the others are either strong La Ninas, cool neutral, and / or central Pacific-based events. To maintain a somewhat decent sample size while focusing the ENSO a bit more, I’ll go with all weak-moderate La Ninas with a negative-leaning IOD and relatively warm West Pacific. When letting 3 weak central-based Ninas in, that leaves us with 7 winters that are relatively decent matches from the Indian Ocean east across the Pacific. They look like this:
December – March 500mb height anomalies for weak-moderate La Ninas with a warm W Pac and -IOD
Mean CONUS temperature departures for the same winters
3/7 have an overall -NAO, 2 more have at least a month or two of notable negative values, and 1 more (08-09) was weakly positive but averaged quite close to neutral all winter. 5/7 have an overall -AO, 1 more had a strong negative month at least, and the last (08-09) was again very close to neutral but slightly positive. 5/7 have a SSW event.
It’s interesting that the signal for a weak to moderate La Nina with a warmer western Pacific and negative-leaning IOD, like many other analog sets for this year seem to point to, also contributes to a decent likelihood for a -AO and SSW event and doesn’t hurt -NAO chances. It also has a look that’s come up a few times, even with some different years thrown in, of cold focused over the northern Plains / Upper Midwest but still working all the way to the East Coast, with a somewhat muted SE Ridge.
This Year’s Tropical Forcing
Looking at a similar thing from the same way…over the last two months, tropical forcing has been most prominent over the eastern Indian Ocean / western Pacific, and somewhat over the Atlantic towards South America:
Rainfall departures in the tropics for August-September 2021
And the multi-model consensus favors that general pattern of standing waves to continue through the fall. Based on current SSTs, it’s not unreasonable:
Copernicus multi-model precip forecast for October-December 2021 in the tropics
Looking for years with similar feature (in particular, the standing wave near 120E), there are several cool ENSO winters that have similar tropical forcing in the fall. Again, sort of making a guess / assumption here, but I don’t think it’s unreasonable:
December – March 500mb height anomalies for cool ENSO winters following falls with similar tropical forcing to what’s expected in 2021
Mean CONUS temperature departures for the same winters
Strong forcing in the eastern Indian Ocean / western Pacific isn’t a short term “cold” teleconnection for the central and eastern US during the heart of meteorological winter (in fact it’s warm), but as discussed above can eventually encourage blocking and perhaps SSW events. So, the overall pattern in winters following falls that had similar tropical forcing to what’s expected this fall makes sense. Overall it’s fairly blocky with a -AO, -NAO and -EPO on the mean, but the PNA is negative too. The coldest air is focused over the northern Rockies and Plains, but in some of these winters it still consistently powered through all the way to the East Coast.
The Analogs
When factoring all of the above factors…ENSO, QBO, solar cycle, Indian Ocean / western Pacific waters, expected tropical forcing…here are my current analogs, with some weighting:
December – March mean 500mb height anomaly in analog years (some weighting)
Mean CONUS temperature departures for the same years
Mean CONUS precip anomalies for the same years
The October pattern has some similarity to what’s modeled for this year, with a +EPO and ridging over eastern Canada, however, it may not be negative enough with the PNA:
Mean October 500mb height anomalies in analog years
From there, the mean pattern in the analogs begins developing blocking in November, which peaks in December with a trough centered near the Great Lakes. The NAO is negative in November and December, positive in January and more neutral in February. While the AO remains negative on the mean in January and February, the EPO gradually rises and the PNA falls, which allows the southern and eastern US to warm up. In March, a -NAO and -EPO return with a -PNA persisting.
Based on the factors examined and factoring in some uncertainty, I think the mean analog pattern is a very decent starting point for this winter.
Among the analogs, I want to briefly examine which analogs finished with a more negative / positive AO, how they played out, and how they got there:
Analog winter 500mb height and mean CONUS temperature departure by AO
In terms of how the winters play out, it’s interesting. The two +AO winters in the set were blowtorches with little snow in the central and eastern U.S. Between the strong -AO winters and the more variable AO winters, the NAO is much more negative in the strongly -AO winters. The cold isn’t as intense in the northern Plains / Upper Midwest, but it’s much cooler in the Southeast. The more variable AO winters are colder in the northern Plains / Upper Midwest into New England but have a stronger Southeast Ridge…it’s much more of a gradient pattern.
5/7 of the stronger -AO analogs had an SSW event, 3/6 possible of the variable AO analogs had an SSW event, and though 88-89 had an SSW it was in late February…11-12 didn’t have one.
Mean SST anomalies for October-December in analog years by winter AO
In terms of what to watch for to try to determine which way this winter will break, we’ll start with October – December SSTs, something that will be fairly easy to track over the next couple of months. Sort of ignore ENSO strength, as one of the two winters that went +AO was a strong La Nina and skews it. But outside of that, the -AO winters are notably warmer in the western Pacific than the other two sets. The +AO winters are notably warmer farther west in the Indian Ocean and have a -AMO look with a cool north Atlantic, whereas the other two sets have a more neutral to positive AMO look with a warmer north Atlantic (especially the -AO set). The -AO set has warmer waters nosing all the way towards the west coast at 30-40N, while the middle set is more mixed there and the +AO years have colder water working down the west coast in the fall. Here are current SSTs, and the multi-model consensus for this October-December:
Current and forecast fall SSTs, courtesy Tropical Tidbits and Copernicus
The warm West Pac / eastern Indian Ocean, +AMO look / warm north Atlantic, and eastern extent of the stripe of warm waters in the Pacific all look more like either the -AO or more variable set as opposed to the +AO set…though, let’s see if this holds up through the fall.
Mean 500mb pattern in analog Octobers by winter AO
Differences in the pattern leading up to these winters became evident in the fall. Looking at the October pattern, years with a -AO had blocking near Scandinavia and the Urals, whereas the other two sets didn’t. The +AO set has a +EPO/+PNA combination in October that neither other set has. The variable set has a flat ridge south of Alaska and the Aleutians, which neither other set has (though you can argue the -AO set has it but it’s displaced west). Over N America, the -AO set has a western US ridge and ridge over SE Canada. The +AO set has a similar look too, but with much more troughing over the eastern US. The variable set looks most similar to the modeled October pattern for this year in North America in my opinion:
Recent ECM weekly and CFS seasonal forecasts for October 500mb heights
The CFS and ECM Weeklies certainly can be quite wrong, but here are their last bids for the overall October 500mb pattern. They’re both remarkably similar overall. I see a mix of things that match the Octobers proceeding -AO analogs and those proceeding more variable AO analogs, though little that matches the +AO analogs.
Of note, the flat ridge south of the Aleutians and negative anomaly near the West Coast (a -PNA) seems closest too the -AO analogs, though isn’t quite perfect. The Ural / Scandinavian ridge is also closest to the -AO years, as is the modest positive height anomalies near Greenland (the other two sets have negative anomalies). The North American pattern looks most like the variable AO set. The subtle trough extending towards Japan on both models is there in both the variable and +AO set.
Overall, the modeled October pattern would seem to argue against going the way of the +AO analogs, and probably has more pointing towards the -AO analogs outside of North America. But, it looks much more like the more variable / closer to neutral AO analogs over North America.
If there’s any doubt still after October, the analogs that went +AO really started to stand out in November compared to the rest:
Mean November 500mb height anomalies in analog years by winter AO
Seasonal Model Predictions
Looking into some current model forecast guidance, as has been mentioned by many over the last couple of months, the August and September forecasts from two models that have recently done ok in terms of forecasting winter stratospheric polar vortex strength ahead of time, the UKMET and European seasons, are forecasting a relatively weak stratospheric PV in their most recent (September) runs, especially early in the winter:
ECMWF and UKMET season model ensemble forecast 10mb zonal wind anomalies, from Copernicus
Again, these forecasts from the models can certainly be wrong this far out, but they’ve shown some success in recent winters. At the least, it’s not a bad thing that models are trying to hint at a weaker stratospheric polar vortex to start this winter as several analogs corroborate that idea. The September multi-system forecast (Copernicus) mean SST anomalies featured a weak, basin-wide / hybrid / mixed La Nina for the winter:
Mutl-system mean December-February SST anomaly forecast, Copernicus
I think this is overall reasonable, though again can’t rule out a run at moderate. Regardless, it seems to be in a decent spot ENSO wise to look at and compare to some of the analog-based thoughts. Here’s a look at the September runs of the previous-discussed European and UKMET seasonal models, along with the JMA:
December – February mean 500mb height anomaly forecasts from the ECM, UKMET, JMA, and multi-system mean from September runs, Copernicus
The Euro is almost a dead ringer to the “variable” or closer to neutral AO analogs, with a definite -EPO and negative leaning AO overall, but a +NAO allowing for the Southeast ridge to flex more. The UKMET is a little farther west with the ridging over the Pacific and starts sagging the TPV into more dangerous territory over western Canada. It’s too neutral with the NAO for a strong SE ridge not to crop up. The JMA looks more like the -AO years, with a bit more of a negative near Japan and also decent ridging near the North Pole, extending towards Greenland. It has the trough the farthest southeast over North America overall.
The multi-system mean, including many others such as the CFS, Canadian, and French seasonal models, looks a lot like the analogs that had a more variable / closer to neutral overall AO.
2m temperature tercile probabilities, same models same run same valid time
The 2m temperature forecasts suggest more trouble for the cooler air to push into the CONUS than the analogs imply…perhaps there’s a gradual trend towards that due to Hadley Cell expansion, but likely not this quick. Based on what similar 500mb patterns have done in past winters, outside of the UKMET which is closer to being more dangerous I think the 500mb patterns on the ECM, JMA, and overall multi-system mean are encouraging for a cold winter in the northern U.S. with some ridging over the Southwest and Southeast, with a gradient pattern in between. The UK depiction looks similar to weak-moderate La Ninas that have a more opposite QBO downwelling to this winter, which is interesting.
For what it’s worth, the CFS also looks a lot like the analogs that had a more variable AO:
Recent CFS runs valid December – February 2021-22: 700mb height and temperature anomaly forecasts
The 2m colder temperature anomalies, much like some of the other models, also struggle to push south into the CONUS compared to the analogs on the CFS.
Overall, the variable AO look among the analogs is the one I’m currently keying in on, though enough supports a more -NAO too that the analogs that featured a -NAO and were much cooler into the Gulf Coast, Southeast and Mid Atlantic aren’t off the table yet. It currently seems unlikely that we’re moving towards the +AO analogs.
Final Thoughts on Winter 2021-22, for Now
Things to watch for during the fall that could make this winter trend towards a more +AO, NAO and perhaps EPO would be a sharp increase in sunspot activity, a stronger or more central Pacific-based La Nina, more forcing over the Indian Ocean, or a stronger than normal stratospheric polar vortex in the fall that couples to the troposphere.
Things to watch for that could make this winter trend towards more blocking would be the La Nina staying weaker and not being centered too far west, along with a decent amount of western Pacific forcing and less farther west in the Indian Ocean. Sunspots remaining fairly low would be beneficial. Ural / Scandinavian blocking in the fall seems to proceed analogs that had a stronger -AO. The stratospheric polar vortex remaining weaker through the fall and not getting too coupled to the tropospheric PV would seemingly aid the odds of following the strong -AO analogs.
At some point, probably mid to late November, I hope to revisit and really hone in. At that point, I may give monthly temp maps a stab! Let’s see how things evolve through the fall.
There have already been almost too many wintry systems across the central and eastern U.S. since late January to keep track of, including a 20-30”+ whopper of a storm where I’m living in northern New Jersey. And for better or worse, there are three more impactful systems clearly signaled by operational and ensemble guidance between this weekend and the end of next week.
The pattern giving us this activity (representative EPS snapshot above) is not all that favorable for I-95 snowstorms. Before you throw beer bottles at me, I’m not saying it will rain on I-95, but except for maybe Boston don’t expect any of these storms to be predominantly snow along the I-95 corridor. However, it is still an impressive pattern and favors a lot of impactful wintry weather across the CONUS.
The trough over the western and central U.S. has a tap of truly Arctic air, with prolonged, strong high-latitude blocking and a cross-polar flow filling Canada with very cold air as a large piece of the tropospheric polar vortex gets displaced into North America. The lobe of the tropospheric polar vortex grazing the US / Canadian boarder is bringing this Arctic air with it into the CONUS.
However, the problem for I-95 getting all snow is the EPO is rising, the PNA is rather neutral, the NAO is somewhat negative but is east-based, and the coldest air dumped in over the western U.S. This all allows a Southeast Ridge to crop up. That’s good for the Ohio Valley and Great Lakes, but not so much the Mid-Atlantic. However, there is still strong confluence over southeastern Canada and New England in this pattern, favoring surface high pressure there and cold air damming east of the Appalachians. With the air over Canada Arctic in nature, it will be much colder at the surface on the East Coast than the 500mb maps suggest. The pattern strongly favors primary lows tracking into the Ohio Valley, with the confluence encouraging re-development off the East Coast. The primary lows will drive mid-level warmth north ahead of them, and any re-development may help keep places like Upstate NY and New England snowier, but farther south this is an icy look.
Note how there are multiple shots of Arctic air into southeastern Canada as pieces of the TPV move through next week. This will give us a quality airmass to tap. Also note the TPV generally consolidating and the jet becoming more zonal towards the end of next week as the AO briefly spikes, giving us at least a brief break in this very active wintry pattern after next week.
Now that the broad stage has been set, let’s look a little closer at the 3 systems on the radar from this weekend through next week…
This Weekend:
There are a few pieces here that will produce precip, some of it wintry. A vort max rounding the base of the polar vortex will produce a rather light swath of high-ratio snow from the central Plains into the Upper Midwest and Great Lakes Friday – Saturday. The shortwave over the western Gulf will move northeast and bring primarily warm air advection-driven precipitation to much of the southern and eastern U.S Friday night – Sunday. The next shortwave behind it over NM and northern Mexico will largely get sheared out as the next, more potent shortwave dives in from the northwest later this weekend (though if it survives, it is what is bringing the shot of lighter precip later Sunday into early Monday to the SE / Mid Atlantic that some models have). What really hurts over the eastern U.S. is the fact that the wave itself is rather weak, the wave spacing is poor, and there’s broad confluence over much of the eastern U.S. which will tend to shear this feature out as it lifts northeast.
The result will be a weak attempt at a primary low into the Ohio Valley, and a weak attempt at a coastal. Neither will be strong and there won’t be a ton of QPF to play with, with the most QPF over the southeast and lower Mid Atlantic where the shortwave will still be stronger and where PWATs are higher. There may also be a relative uptick over PA, NY and southwestern New England as the vort max rounding the PV adds a bit of lift and improves jet support while the weak coastal makes its closest pass:
QPF will then begin diminishing again heading east across New England as this feature passes and we get into subsidence behind it.
This just isn’t a great set-up for snow due to a lack of robust coastal re-development and warm mid-levels. The bulk of the precip will be driven by low-mid level WAA. This lift briefly improves (with some suggestion of fgen ramping up too) Saturday evening / night as the best upper jet support glances the region, but the strongest fgen is located well below the DGZ across the board and is occurring near the retreating 850mb 0C line, just not a great set-up for a “thump” of snow before flipping to ice or rain. The relatively best shot of snow may be from northern PA and Upstate NY into interior New England where it will be colder and where all of the lift will briefly line up in an area cold enough for snow, but even here more than a localized few inches seems like a stretch.
The problematic aspect to this system is that there will be a tap of very cold and dry air to dam east of the terrain, with the weak coastal also giving a little isallobaric tug to the flow Saturday afternoon – night and re-enforcing this cold air damming. This will allow temperatures to hold below freezing west of the coastal front through much of VA and potentially into NC during this precip – note that cold air damming often trends colder as we get closer. Along much of the I-95 corridor temperatures will be well-below freezing during any wintry precip, so it may accrete or accumulate rather well and impact travel. There isn’t a ton of QPF to go around so in general I don’t expect enough freezing rain for significant power outage issues, though the one exception may be the lower Mid Atlantic (or interior NC if it’s cold enough). The low-levels are quite cold as you head northwest of the I-95 corridor which may favor sleet vs freezing rain for many areas for part of the storm, though a narrow corridor of predominantly freezing rain may play out somewhere near or just NW of I-95.
Monday – Tuesday:
Similar to the weekend wave, but also different. The lobe of the polar vortex is pulling east. While there is strong confluence / surface high pressure behind this feature (and a shot of cold air into the Northeast with it), it is moving to the east ahead of our ejecting shortwave. The shortwave ejecting is much larger as well. With a southeast ridge in place, this will send a robust primary low into the Ohio Valley early next week, followed by secondary development off of the Northeast coast.
There is some uncertainty with regards to the exact details, as exactly how consolidated the wave is when it ejects out will influence the strength of the primary low into the Ohio Valley and can influence the coastal re-development. Some guidance ejects a little piece on Monday, resulting in a wave of overrunning precip well ahead of the main storm, and potentially resulting in a slightly weaker primary low. The next shortwave will also need to be monitored for wave spacing issues if it trends faster, which could also weaken the primary low. How quickly the PV moving across SE Canada ahead of the storm can also influence things; if it moves through slower it may favor a somewhat colder solution, but if it lifts out faster could favor a more amped primary low into the Ohio Valley and warmer solution for the East Coast.
The tl;dr here is to expect a primary low of sorts into the Ohio Valley, followed by eventual re-development off the Northeast coast…this isn’t going to go anywhere as it’s too obvious of a set-up that’s been shown strongly by most operational and ensemble guidance since it came into range, but it may trend more or less amped.
In terms of where this may produce wintry precip…given the record cold surging to the TX Gulf Coast this weekend and early next week, wintry precip is likely all the way to the coast in TX. As the primary lifts into the Ohio Valley a swath of moderate to locally heavy snow is likely across the Mississippi Valley into the Ohio Valley and southern / eastern Great Lakes, though note that there are ways this trends more or less amped. I generally feel these types of lows into the Ohio Valley trend more amped as we get closer, but the very cold air and dominant polar jet may limit that if the lobe of the TPV doesn’t lift out as quickly.
In the east, there will probably be some overrunning snow ahead of the primary low from the northern Mid Atlantic into New England, followed by some enhancement from the coastal from NY into New England. Much of the I-95 corridor (especially Philly and north) may see some snow from overrunning, but should flip to ice before getting a ton of snow.
It’s possible that Boston and Hartford are mainly snow if the primary low is on the weaker side and the coastal takes over quicker…NYC is close to the line but I don’t think they can avoid going over to ice or rain at some point. I think the farthest south this can be primarily snow, even with the colder solutions, is from central PA to maybe northern NJ (but outside of NYC itself) into southern New England (though as of now, I’d favor some ice even in this corridor unless we see the primary low trend weaker…that’s the farthest south I could see mainly snow if this trends less amped and colder).
Despite the primary low likely flooding the mid-levels with warmth, the TPV will bring a shot of very cold and dry air to southeast Canada and New England that will funnel east of the Appalachians into the Mid Atlantic. West of the coastal front will be cold with this storm, certainly through DC and probably through most of VA (the GFS usually underdoes low-level cold in CAD). It is less clear-cut into the Carolinas, though I feel at least interior NC is in play for being cold enough for another round of freezing rain with this storm.
Basically, a lot of areas should get snow from this system, even if the exact placement can wobble. Even in the Northeast many should see snow before any ice, but the very cold / dry air funneling east of the Appalachians combined with a robust primary low into the Ohio Valley screams an icy set-up for a large chunk of the region, likely including NYC, Philly, Baltimore, DC, and possibly even Richmond again. Hartford and Boston are a little more on the fence for mainly snow vs a fair amount of ice, but very well could end up in the latter camp too. My gut here is that this is more likely to trend a little more amped vs flatter as we get closer.
Thursday – Friday:
So this is almost the same thing and I’m tired of labeling and typing out the same thing over and over again (since it’s like midnight). The key difference here for this storm is that there isn’t a lobe of the TPV sitting over SE Canada ahead of our storm, allowing for the SE ridge to extend all the way into eastern Canada. There is enough confluence for some surface high pressure and cold air damming ahead of the storm, but the quality of the air is not as good, the high pressure isn’t as strong, and the Miller B / coastal will be much more apt to track close to the coast given a weaker high pressure and less confluence north of the storm:
There is enough high pressure ahead of the storm for more cold air damming, and probably enough high pressure and confluence to coax a Miller B again, but overall it will be warmer than the Monday – Tuesday storm.
Using the GFS for demonstration purposes, note how along with weaker high pressure ahead of the storm overall (per the EPS images), the cold / dry air over New England and SE Canada is a couple of notches less impressive than what the Monday – Tuesday storm is working with. It’s still cold and dry enough that there may be overrunning snow ahead of the storm and again cold air damming, quite possibly into the Mid Atlantic, but it will be easier for the mid-levels to warm, and the cold air damming may eventually erode a bit more than it will with the early week system.
The result is still another potential swath of snow, both with the primary low from the southern Plains into the Ohio Valley and southeast / eastern Great Lakes and likely again over the interior Northeast, and still more ice, but overall it will probably be a notch or two warmer in the Northeast than the early-week storm.
Note how the ensemble mean snow swath is actually fairly similar on the southern edge to Monday – Tuesday in the Northeast, but definitely has the heaviest swath located even farther inland.
Overall, 3 systems are coming up. In the interior Northeast they may be mainly snow, but closer to I-95 they all likely feature a fair amount of sleet and freezing rain (and maybe some plain rain farther south). Large swaths of impactful wintry weather can be expected with all 3, but especially the Monday – Tuesday and Thursday – Friday storms. Finer details are still a long way from being worked out, but there’s plenty to keep an eye on, including the risk for substantial icing through the week and power outage potential.
The pattern coming up is going to feature plenty of cold / Arctic air over North America to tap, along with a continued tendency for blocking over the Atlantic.
A Rossby wave making machine will be in place over the western Pacific, encouraging persistent north Pacific blocking and a cross polar flow into Canada. This is occurring while a tendency for high latitude blocking continues across the board for multiple reasons.
This loop of the GFS helps show the continued cross polar flow into Canada, and how the retrograding -NAO helps shove the tropospheric polar vortex towards the CONUS this weekend and next week, bringing a cold snap to much of the Lower 48. With the Pacific blocking likely continuing for the forseeable future, the model shows Arctic air reloading towards the end of the run in mid-late February.
One of the reasons we will remain “blocky” for the forseeable future is the continued downwelling of the weakened stratospheric polar vortex into the troposphere, which encourages a -AO and blocking:
On top of that, there’s been a recent uptick in tropical forcing across the western hemisphere, and western Pacific forcing will continue until further notice:
This deposits momentum in the tropics and subtropics (enhances the sub-tropical jet). Because momentum is a conserved quantity, the increase in momentum in the tropics and subtropics results in a decrease in momentum in the higher-latitudes, which causes a tendency for blocking. The 12z GFS is shown as an example of this, note how the stronger sub-tropical jets over the eastern Pacific and eastern Atlantic occur beneath weaker higher-latitude flow, and how this encourages high latitude blocking:
The persistent western Pacific forcing will keep our Pacific blocking in place for most of February, and the Arctic air dropping into North America will encourage continued cyclogenesis near the east coast, which will help encourage Atlantic blocking as well.
Basically, the US will lean cold for much of February. There will be a baroclinic zone across the southern / eastern US, though the cold will seep south and east at times given the -NAO and the quality of the cold that will be available. The Arctic air may lead to near to below average precipitation for a lot of the CONUS (save for perhaps the southeast/east coast), but the pattern will stay at least somewhat active given the baroclinic zone and hints of a subtropical jet. The GEFS and EPS weekly forecasts for the next 30 days speak for themselves:
While suppression and lack of moisture may be a problem at times, we are already in a rather wintry stretch that will probably last through all of February, and perhaps into early March.
I think it’s safe to say “here we go” for Sunday – Tuesday in the Midwest and Northeast!
The pattern features a west-based -NAO, 50/50 low, large shortwave, confluence ahead of it over New England and SE Canada, and ridging out west:
In addition, this storm will occur while the NAO is transitioning, the PNA is spiking, and the AO is persistently, deeply negative:
This all leads to a robust low pressure tracking across the Ohio Valley and then re-developing off the Mid Atlantic coast, with a strong high pressure over southeast Canada:
The TPV that gets shoved through the Northeast Friday – Saturday (and probably bringing snow squalls, gusty wind, and the coldest airmass of the winter so far) will ensure that there is an actual cold airmass in place in front of the storm, with reasonable cold behind it as well:
At first blush, there appear to be some similarities to what was modeled for this Thursday and will end up really suppressed on the East Coast. Here is this Thursday’s set-up:
Note how there’s little wave spacing in front of the storm, with a PV also depressing heights over the Great Lakes, and little ridging behind the storm. This resulted in a solution that was a bit too far south and too late of a bloomer for a more notable East Coast storm. Compare to what’s modeled with the Sunday – Tuesday system:
More wave spacing both in front of and behind our storm, a more amped shortwave itself, and more room to breath over the Great Lakes. This storm should be more amped across the board.
The trends at 500mb over the last few days on the EPS have been for more blocking, a more optimally placed 50/50, a more amped shortwave, and more ridging and wave spacing to the west. All generally argue for a more amped storm, but also force the track farther south especially over the Midwest:
Surface trends match, along with a much better high over southeast Canada:
After these trends, that are still ongoing, the EPS mean 500mb evolution is classic for a slow-moving, sprawling winter storm from the Midwest to the East Coast:
Most of the 12z GFS, Canadian, and Euro ensemble members have a notable swath of snow somewhere across the Midwest or East Coast. Location and amounts vary considerably, especially on the East Coast (note that some snow in the Great Lakes, New England, and southern Mid Atl / SE are from prior events, but any larger swaths are from this storm):
We definitely have a storm to track for a lot of areas! In the Midwest, I feel that eventually the strength of the wave should limit southern shifts, though a couple more are possible if the western ridging or blocking trend any stronger. On the East Coast, I feel this is more likely to trend more amped than extremely suppressed. However, quality cold in front of the storm and good blocking should increase the odds of overrunning snow in front of the storm anyways, even into the Mid Atlantic, and should eventually limit how far north this can trend.
It’s too early to lock in snow in a given spot, but a bunch of areas are in the game for this one.
The weather models are running just as quickly and as often as they can. Outputting nothing. Outputting snow. Outputting rain. Back and forth. Life and death. Snip snap! The fingers are typing and posting on Twitter even faster, if that’s even possible. But yes, actually, there are four “systems” that may produce snow on the East Coast next week, and one of them looks rather delectable, especially from the interior / northern Mid Atlantic into New England.
A quick note on how this pattern is coming to be…
TropicalTidbits.com
The combination of a negative East Asian Mountain Torque event (lower pressure east of the mountains) and piece of the tropospheric polar vortex dropping into Asia is encouraging a somewhat retracted Pacific jet stream (after it was quite strong / extended to end November and start December) and wave breaks over the northern Pacific. This is allowing heights to rise in the northern Pacific, dropping the EPO and WPO. This is greatly increasing polar air in North America after it lacked to start December and prevented last weekend’s storm from being snowier. And by snowier, I mean producing more than 0 snowflakes in New Jersey.
Tropical forcing is centered near 120E right now, registering as a phase 5 MJO, projected to move into phase 6 next week:
The RMM plots have had a hard time tracking this current MJO as it’s constructively interfering with lower frequency forcing near 120-150E. However, it seems there’s still a coherent MJO in there that’s currently in phase 5 and may get into phase 6 or 7 next week. You can see how the lift really intensified over the Indian Ocean last month as the MJO approached the low frequency forcing near Indonesia…and how it seems the MJO is now emerging on the other side towards the western Pacific:
The CFS (above), EPS and GEFS all have some uptick in 200mb upward motion as far east as the Dateline over the next 5-7 days. A phase 5-7 MJO in mid-December strongly suggests blocking in both he EPO and NAO domain:
This period of potential blocking, aided strongly by tropical forcing along with a recent +East Asian Mountain Torque that really beefed up the sub-tropical jet, has been talked about many (including myself) since November. I personally was not as sold on legitimate NAO blocking, but that does seem likely to occur this weekend through next week.
weathermodels.com
It’s quite possible that a disruption to the stratospheric polar vortex, causing it to get split in the lower stratosphere for a time, with a lobe dropping into Asia and another into North America, with ridging / weaker flow in between over the north Pacific and north Atlantic, is encouraging this tropospheric blocking.
stratobserve.com
One can definitely see on the 3D vortex plot from stratobserve.com how the tropospheric and stratospheric blocking across the north Atlantic may be somewhat coupled, and also how the lobe of the tropospheric polar vortex dropping into North America is tied to the stratospheric vortex as well. This activity within the polar vortex is complimenting what the tropical forcing suggests quite nicely…and this disruption is likely tied to a recent strong MJO progression across the Indian Ocean and strong East Asian Mountain Torque event.
I guess this is a long way of saying high latitude blocking, including in the NAO domain (2020 baby!) is quite well-supported next week. Though, do note that phase 5-6 tropical forcing in late December supports troughing over western North America and a Southeast Ridge, and as the MJO eventually weakens and the low frequency forcing takes over later in the month troughing very well may try to slide west. But let’s not skip to that, let’s break down next week’s potentials…
Monday:
Dig polar jet, dig! Ah that’s been the rub against the Monday – Tuesday threat, the lack of ridging out west would keep the polar jet too bottled up to get enough stream interaction for a storm to deepen and come up the East Coast. Is there hope on that front?
There is quite a bit of blocking over the Arctic and north Atlantic. The polar vortex is over Hudson Bay! There isn’t a 50/50 low yet, but the Atlantic side is not inhospitable. The Pacific side is a little more…eh? If ridging off the West Coast is a bit stouter, or if there is just a bit more “traffic” over the Atlantic, perhaps the northern piece can dig a little more.
The trend to raise heights a bit over the Davis Strait and nudge the PV a bit west…and trend on the West Coast to have a little more ridging between shortwaves…may just force the northern stream to dig a bit more. That would result in a better chance at a phase and a more robust coastal. The rub here is there’s no 50/50 low yet (or “traffic”), so a stronger storm would try to cut a bit more. So, I-95 would require a perfectly timed phase for legitimate snow, but inland is in a better position if we trend towards a better phase.
Both the EPS and GEFS runs at 18z like this slightly more phased idea for whatever reason…seems it’s the northern Mid-Atlantic most likely to get snow, especially NW of I-95, with some potential this gets into NY or New England if we see more wholesale changes to slow down / dig the polar jet shortwave more.
weatherbell.com
There are a number of EPS members that are stronger than the mean, though most are northwest of the mean, and the strongest ones are well northwest of the mean. This is evident on both the spread (all to the north/northwest of the mean) and map of the member low locations:
My verdict on this one is to watch for the polar / northern jet shortwave to dig more. If it can, it opens the door for more snow, but may also shift that snow NW of I-95 pretty quickly if we aren’t careful.
Wednesday – Thursday:
This is currently the big-ticket item generating most of the images getting posted on weather social media. A primary low moves towards the Great Lakes, as it runs into confluence over southeast Canada the energy gets shunted east and sparks a coastal (Miller B) off the northern Mid Atlantic or New England coast. With reasonably cold air in place to the north, this may produce a good amount of snow for someone…
The pattern is pretty delectable on the Atlantic side. A strong -AO, -NAO, and 50/50 low. The -NAO and 50/50 low coax that strong confluence over southeast Canada, supporting a surface high pressure that forces the Miller B coastal to form. The tropospheric PV and 50/50 low, which was a lobe that broke off from the PV, mean there’s actual cold air available to tap, unlike last weekend when a robust Nor’easter produced more rain than snow. The Pacific pattern isn’t ideal…the ridge axis is a little southwest of preferable and the polar vortex is a little west/northwest than an ideal location. So, this would likely act to limit any threat in the Southeast and lower Mid-Atlantic. But, the Atlantic blocking and cold air over Canada being so robust would pretty much guarantee snow from much of PA and northern NJ into NY and New England, assuming there’s a storm.
The trends on the EPS over the last few days for this time period are remarkable. The NAO has trending much more negative, with that -NAO also trending more west based, with the strongest anomalies over the Davis Strait! There has also been a trend for a much stronger and more optimally placed 50/50 low. These trends are a result of trends with the Monday system for a more amped northern stream and potentially stronger coastal. The AO blocking has also trended stronger, and perhaps also as important, ridging over the Aleutians has been trending towards mainland Alaska. One more trend in that direction and all of a sudden the PV is nudged a little to the east, which would be a better spot.
Right now, it’s quite a good set-up north of the Mason-Dixon line, especially inland, but if the Pacific side trends a bit better could become something interesting in the lower Mid Atlantic or Southeast.
These are impressive ensemble mean snow swaths for over a week out for the EPS and GEFS this afternoon / evening. The greatest signal is from eastern PA through NYC and Boston, initially favored NW of I-95 but then right along it. There is considerable spread on both sides through. Also note how there is some potential for snow with the primary low over the Ohio Valley too on the other side of the Appalachians.
While there’s great agreement on a general low track off the East Coast next Wednesday – Thursday, there is still a good bit of spread in both track and speed, and intensity at all points. This likely has a lot to do with how well this shortwave interacts with the polar stream, and how strong the Monday system becomes, since it turns into the 50/50 low.
My thoughts on this one are that the Atlantic side is stellar, and the shortwave ejected east across the country is strong. There should be a decent Nor’easter with snow for at least part of the Northeast or Mid-Atlantic. If the Pacific side isn’t as ideal, with the PV centered a bit to the west and the ridge axis southwest of what’s preferable, though some improvements may still occur there based on current trends. These improvements could really up the ante for snow somewhere if they occur.
Otherwise, how the Monday system pans out will also impact this second threat. A stronger Monday system may force this system farther south, turning it into more of a Mid Atlantic problem and perhaps limiting how far north any snow can get. A weaker Monday system could weaken the confluence over Canada enough to allow the primary to cut a bit more, which would limit the threat on the southern extent by pumping in more warm air before the coastal tries to form.
A storm seems likely for someone, but a lot can change where and exactly how much. Wow, I know, I’m such a prophet.
Next Friday and Sunday:
The Atlantic pattern remains decent through next weekend and the AO stays negative…however, the EPO rises and the PNA tries dipping, which will try to flood the CONUS with Pacific air and make it harder to see enough northern stream interaction for a phase or good winter storm. How the Wednesday-Thursday storm plays out will also impact the pattern for Friday’s storm, and Friday’s storm will have an impact on the Sunday storm. See a pattern? This is fun.
If the Pacific side holds onto a more neutral pattern just a bit longer that could really make one of these a more plausible storm. Is that possible? My gosh these questions are why I should be sober when I write. I ask fewer weenie questions while sober.
After the ongoing negative East Asian Mountain Torque, we’ll have a positive torque develop much of next week into the following weekend. This will act to extend the Pacific jet again. There will be a brief window next week where this may encourage a stronger low near the Okhotsk Sea (NW Pacific). As some of this momentum gets dispersed into the sub-tropical jet over the East Pacific, this may combine with the Okhotsk low to try to wedge a ridge between that low and the PV edging into the EPO domain from western Canada. That’s a long way of saying it’s possible it takes the EPO a bit longer to rise than the current ensembles, though it seems inevitable to eventually happen.
My impression is that unless the Wednesday – Thursday storm falls apart that it will make the Friday system unlikely to happen. Or, it will shove it so far south it’s mainly a Mid Atlantic or even Southeast event. The hostile Pacific pattern may limit the potential on next Sunday, though if there is enough polar influence it may again threaten the Mid Atlantic or southern New England.
The takeaways to all of this are that a lot supports high-latitude blocking next week, and we have a few systems that can take advantage. The Wednesday – Thursday is the most likely to be a major storm for the greatest number of people as Monday, Friday, and next Sunday’s threats all need a bit of work. But all are close enough not to rule any out. That’s to say, let the model watching continue…