
Temperature departures from normal from October 26th through November 1st
Quite a contrast the last week has been to much of the fall so far; much of the central and a good portion of the eastern United States have been colder than normal, with parts of the Ohio Valley and mid-Mississippi Valley finishing the week nearly 10 degrees colder than normal! The northern Mid Atlantic and New England have been a notable exception, though even those areas had a couple of colder days to start the week. Many areas saw their first frost or freeze, and parts of the Plains, Midwest, Great Lakes, and Appalachians even saw some snowflakes fly. Unfortunately for snow lovers out there, this cold pattern has already come to an end…

Temperatures as of 4PM EDT Thursday
Most of the big East Coast cities saw 70s on Thursday, with Dallas seeing their first 90 degree day on record in November! The northern Rockies, Plains, and Midwest are still respectably cold, but that cold won’t effectively spill south or east anytime soon.
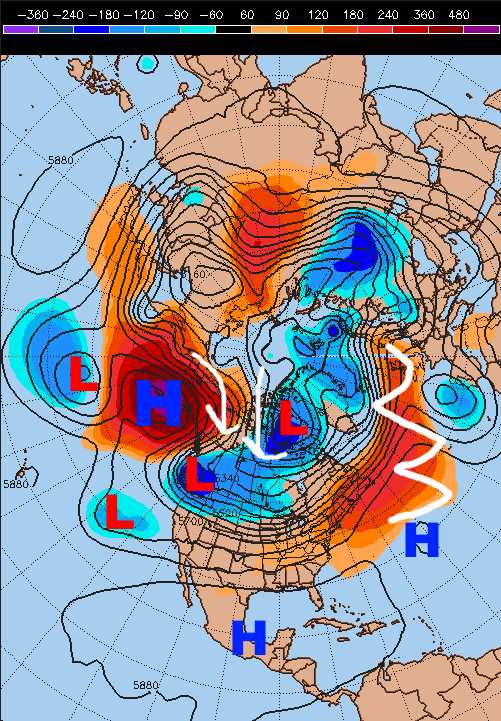
Current large-scale upper-level weather pattern as of Thursday morning
The current large-scale weather pattern is not too uncommon for a La Nina regime; there’s a big, blocking ridge of high pressure in the jet stream over the North Pacific, and this is sending cold air towards the northwest US and western Canada. A ridge over the southern United States and western Atlantic is allowing very mild air to flood that region of the country. With no blocking over the Atlantic or Arctic, this general pattern of cold in the western portions of the continent and warmth over the southern and eastern US will continue for a little while.

Surface temperature departures for normal valid Sunday evening
This cold in the west, warm in the east pattern is evident in the European ensemble forecast surface temperature distribution for Sunday evening, with significant cold departures over the northern Rockies and Plains, but a lot of warmth over the eastern United States. You can see continued “warmth” near Alaska (compared to normal), signifying that the ridge there will remain and continue to pump cold into the west. With this type of pattern, it often takes a big storm to force some cold into the east, and we will see that early next week:

Sea level pressure and anomalies valid Monday morning
A fairly strong low pressure will develop over the northern Plains and move into eastern Canada this weekend into early next week, with Canadian high pressure moving southeast behind it. This will tap some cold air and send it towards the eastern third of the United States through next week. It won’t be as cold as the recent blast, but much of the northern and eastern US will see a few days of mainly below normal weather:

Modelled surface temperature departure from Wednesday, November 8th through Monday, November 13th
As you can see, the coldest of the cold (by far) still remains over central and western Canada, the norther US Rockies, northern Plains, and upper Midwest, but this is a five day mean temperature departure map showing predominantly colder than normal conditions over much of the east. Any snow threats with this will be minimal in the east, though some snow downwind of mainly the northern Great Lakes and perhaps some light snow with any system that tracks through the Northeast and interacts with this cold isn’t impossible…overall though it’s pretty early to talk major snows outside of the northern tier of the US and this airmass doesn’t look THAT cold. In addition, the cold does NOT look to last:
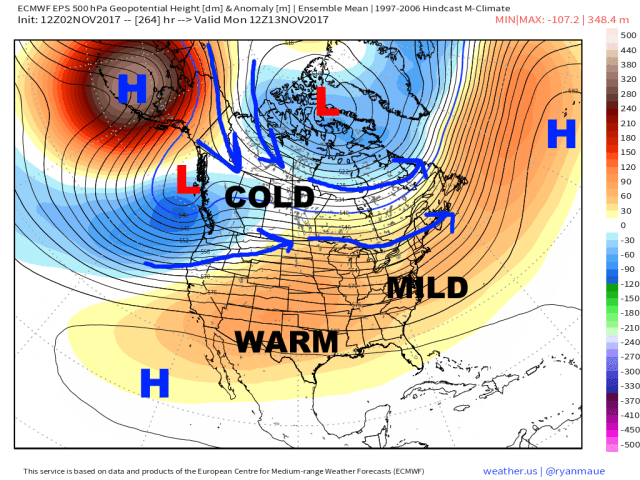
Modelled upper-level weather pattern valid Monday, November 13th
The Euro ensemble mean projected upper-level weather pattern for the beginning of the following week (week of 11/13) is back to the one supporting our current warm-up; a big ridge near Alaska dumping cold towards the west, but a big upper-low near Greenland (called a positive North Atlantic Oscillation, or NAO), encouraging the cold to stay north over Canada and allowing ridging to build over the southern and eastern US…allowing warmth to return.

Modelled temperature departures from November 13th through November 17th
The resulting modelled temperature departures for the week of the 13th show warmth gradually building east. There’s some lingering cold in the Northeast to start the week, but warmth is dominating a large portion of the US. This is 11-15 days in the future, and is an ensemble mean of 51 different ensemble members, so there’s some variation and it’s possible that another little lobe of cold drops in somewhere…but the overall theme here is that outside of the northern Rockies and Plains cold will be hard to sustain as we head through early and mid-November.

“Outgoing Longwave Radiation” near the equator over the last year, showing where areas of thunderstorms (blue) have been most persistent
As mentioned earlier, the ridging over the North Pacific is a classic La Nina signature, and occurs due to enhanced thunderstorms near the equator occurring from near Australia into the western Pacific. These thunderstorms release massive amounts of heat into the upper-levels of the atmosphere, and help to determine where the jet stream lies and how strong it is as we head into winter. The above plot is a quick way of ascertaining where these thunderstorms are most persistent, as the cloud tops are colder than the ocean surface and give off less radiation. The areas of blue represent persistent thunderstorms near the equator.
In an El Nino these thunderstorms occur farther east (of the Dateline or 180 degrees longitude) due to warmer waters over the central and eastern equatorial Pacific. In a La Nina these occur farther west. Note how this fall has featured thunderstorms in a similar area to last fall and winter (also a La Nina), along with a lack of thunderstorms (warmer colors) near and east of the Dateline. Last winter featured a lot of ridging over the North Pacific, and a lot of warmth over the central and eastern US:

Average upper-level weather pattern from December, January, and February of 2016-17
That ridge is located a bit farther south than we’re currently seeing, but the similarities in the patterns are uncanny. Last winter was VERY warm over much of the central and eastern US. This recent pattern has caused some concern for a repeat this winter, and given some similarities (La Nina winter, similar thunderstorm placement in the tropics early on) those concerns aren’t unfounded. However, there are some signs that this winter will be DIFFERENT:

Sea surface temperature difference from October 2016 to October 2017
This year’s La Nina features warmer waters near the Dateline…and colder waters near Australia when compared to 2016 in October. This may still change as we head into winter, but suggests that thunderstorms may not be as tied to the region near Australia this winter and may have some tendency to come east at times. In fact, a fairly strong “Madden Julian Oscillation” or “MJO” recently progressed east, and contributed to the recent cooldown over the central and eastern US:
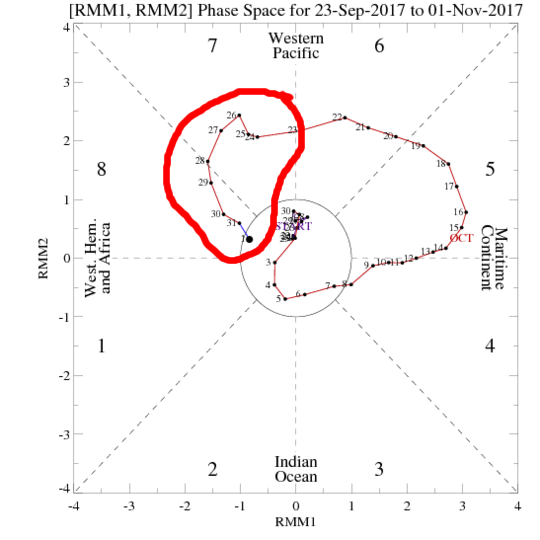
MJO phase and magnitude over the last 45 days)
The MJO is a large-scale circulation in the tropics that moves over the warm waters, influencing where those important tropical thunderstorms occur and having well-known impacts on the jet stream farther north.
The strong MJO through phase 7 and 8 (after moving through phases 5 and 6) is a bit of a departure for normal La Nina activity, and the MJO phase correlations to US temperatures centered on the October-November-December period match warmth in phases 5 and 6 followed by cooler conditions:

MJO phase correlation to October-December temperatures in the US
As the MJO weakens and moves towards/into the “circle of death,” the pattern is returning to one more typical of a La Nina, with ridging over the North Pacific, a western US trough and cold, and a Southeast Ridge and warmth. With the discussion of potential enhanced MJO activity above, should the sea surface temperature differences from last year persist, let’s look at the MJO forecasts moving forward from the GFS (American model) and European model ensembles:
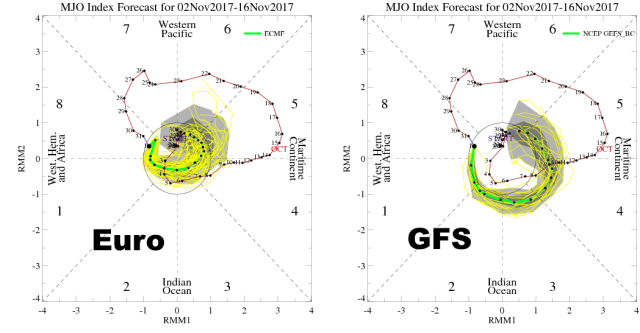
European and GFS ensemble MJO forecasts for the next two weeks
Although they have somewhat different ways of getting there, the GFS and Euro ensembles both hint at another potential MJO pulse towards phases 7 and 8 for the second half of November. This has been hinted at for over a week. This is still a long ways out and may change, but given the recent strong MJO that made it into phase 8 to go along with decent model agreement and persistence for such a long lead time, this is something to watch.
In general, I don’t expect substantial changes to the pattern until potentially Thanksgiving week. The MJO will be weak, and the La Nina pattern with the north Pacific ridge and Southeast US Ridge will persist. Brief cooldowns will be possible in the eastern US, but nothing too significant or sustained. We will watch for changes in the tropical thunderstorms and north Pacific pattern towards late November.
