It’s still a little early on in the game, but we’re getting to the point where we can start narrowing down what various “pattern drivers” may look like this winter and examine analogs and even some seasonal forecast guidance for clues. For the most part, I’ll focus on cool ENSO winters / La Ninas and expand from there, with emphasis on tropical SSTs / forcing and the QBO.
For those who just want the maps, here are my current thoughts on temperature and precip through the winter. I’m lumping March into winter because it’s a month that can still prove to be productive for snow for many areas, and because many analogs are chilly in March. The detailed write-up with reaosning, analogs, and a look at longer range seasonal models follows. I hope to follow up with more focused thoughts in November, time permitting…


My guesses on teleconnections:
AO: Solidly negative.
NAO: Near neutral or slightly negative overall, possibly large swings
EPO: Near neutral or slightly negative overall.
PNA: Negative, especially later in winter
A stronger or more central-Pacific La Nina could pose warmer risks, especially in the central and eastern U.S., as would a strong stratospheric PV early in the winter that’s coupled to the troposphere. A quick increase in sunspots could also be a warmer risk. If forcing ends up more focused farther west into the Indian Ocean it’d likely point to a warmer winter.
The La Nina staying weak to moderate and more basin-wide would point to a chillier outcome with more blocking being more likely. A weaker stratospheric polar vortex early in the winter, and tropospheric blocking developing in November, would also point towards a chillier / blockier outcome. Scandinavian or Ural ridging in October or November would also point towards a chillier and blockier direction, as would sufficient tropical forcing occurring east into the Pacific at times.
I expect a very up and down winter, with very cold air frequently available over Canada that occasionally works south into much of the central and eastern CONUS this winter, along with the Northwest. The Southwest will generally be milder with a somewhat weak sub-tropical jet. The southern Plains, Gulf Coast, Southeast and lower mid-Atlantic will probably lean mild due to sharp warm-ups when blocking relaxes and / or the PNA shifts negative, though a couple of periods of EPO-induced cold all the way to the coast are possible. The most persistent cold will be in the northern Rockies and Upper Midwest. The analogs really like the first part of winter (December into January, possibly starting to turn colder in November) for blocking and cold into the central and eastern US (with cold focused more on the northwest in February). The analogs have a -EPO, -NAO, and -PNA pattern in March.
I’m optimistic about snow in the northern Rockies and Pacific Northwest, along with from the Great Lakes and Ohio / Tennessee Valleys into much of the Northeast and New England. Along I-95 from Baltimore to DC and Richmond, events will be rainy at times when blocking relaxes so snow will struggle to reach or exceed normal, though there should be opportunities for wintry weather when blocking is strong enough to suppress the Southeast Ridge.
The technical write-up / thoughts:
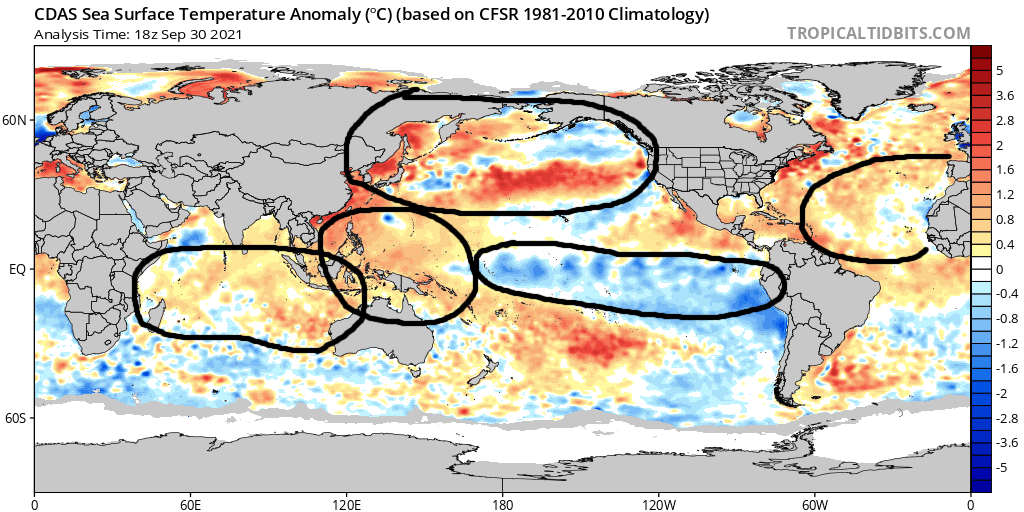
Starting with SSTs…a few features stand out:
- A developing La Nina that appears likely to be weak to moderate and likely “hybrid / basin wide”, perhaps with a modest east lean
- While the North Pacific is warm overall, the PDO is decidedly negative (very warm waters near Japan, cool waters south of Alaska)
- The western Pacific warm pool is quite robust, as has been more common than not lately
- The Indian Ocean Dipole is somewhat negative, similar to last fall
- While not entirely classic, the AMO is positive
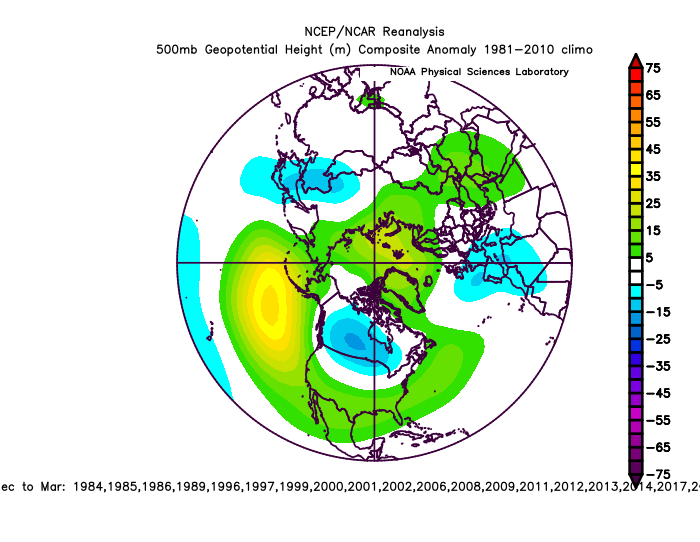
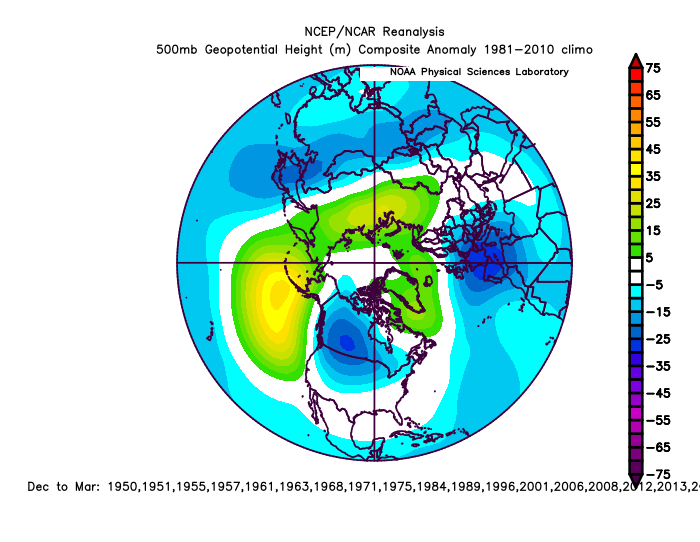
We’ll start with a La Nina focused approach and then expand from there, focusing on winters since 1950. To give the best sample size possible, I initially started with all cool ENSO years (everything from cool neutral to strong La Nina). Here is what the last 20 cool ENSO winters looked like from the December – March period:
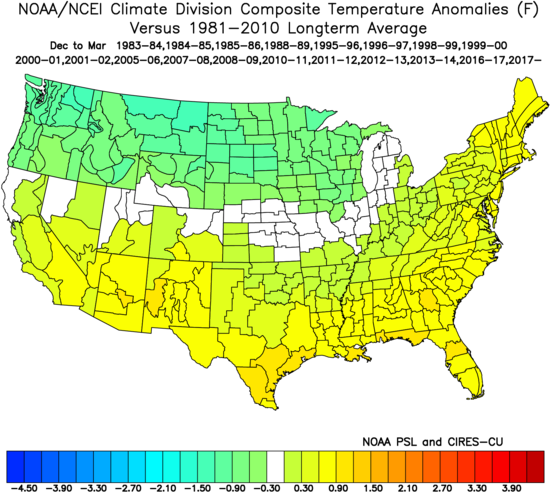

Please note that through this exercise, I use the most representative average on the US Climate Division plots, as using the 91-20 averages will make everything with older years look colder than they should.
It’s overall what you’d expect in a La Nina, with a predominantly -PNA and cold focused over western Canada and the NW US. The inclusion of some cool neutral years probably helps skew the AO and NAO somewhat more negative than if I didn’t include them, as 5/7 cool neutral ENSO winters have a predominantly -AO in the December-March period, and the two that average positive both had one month that registered -1 or lower.
Some recent La Nina winters have gone huge…95-96 and 10-11 are the best examples, though even a year like 17-18 had some very legitimate cold and snow even if it also torched at times. Others, like 11-12 and 16-17 (even though the latter was still snowy in parts of the interior Northeast) were blow torches. La Nina is a nice starting point, but what “flavor” can we expect this year?
We’ll first start by looking at cool ENSO / La Nina winters by strength:
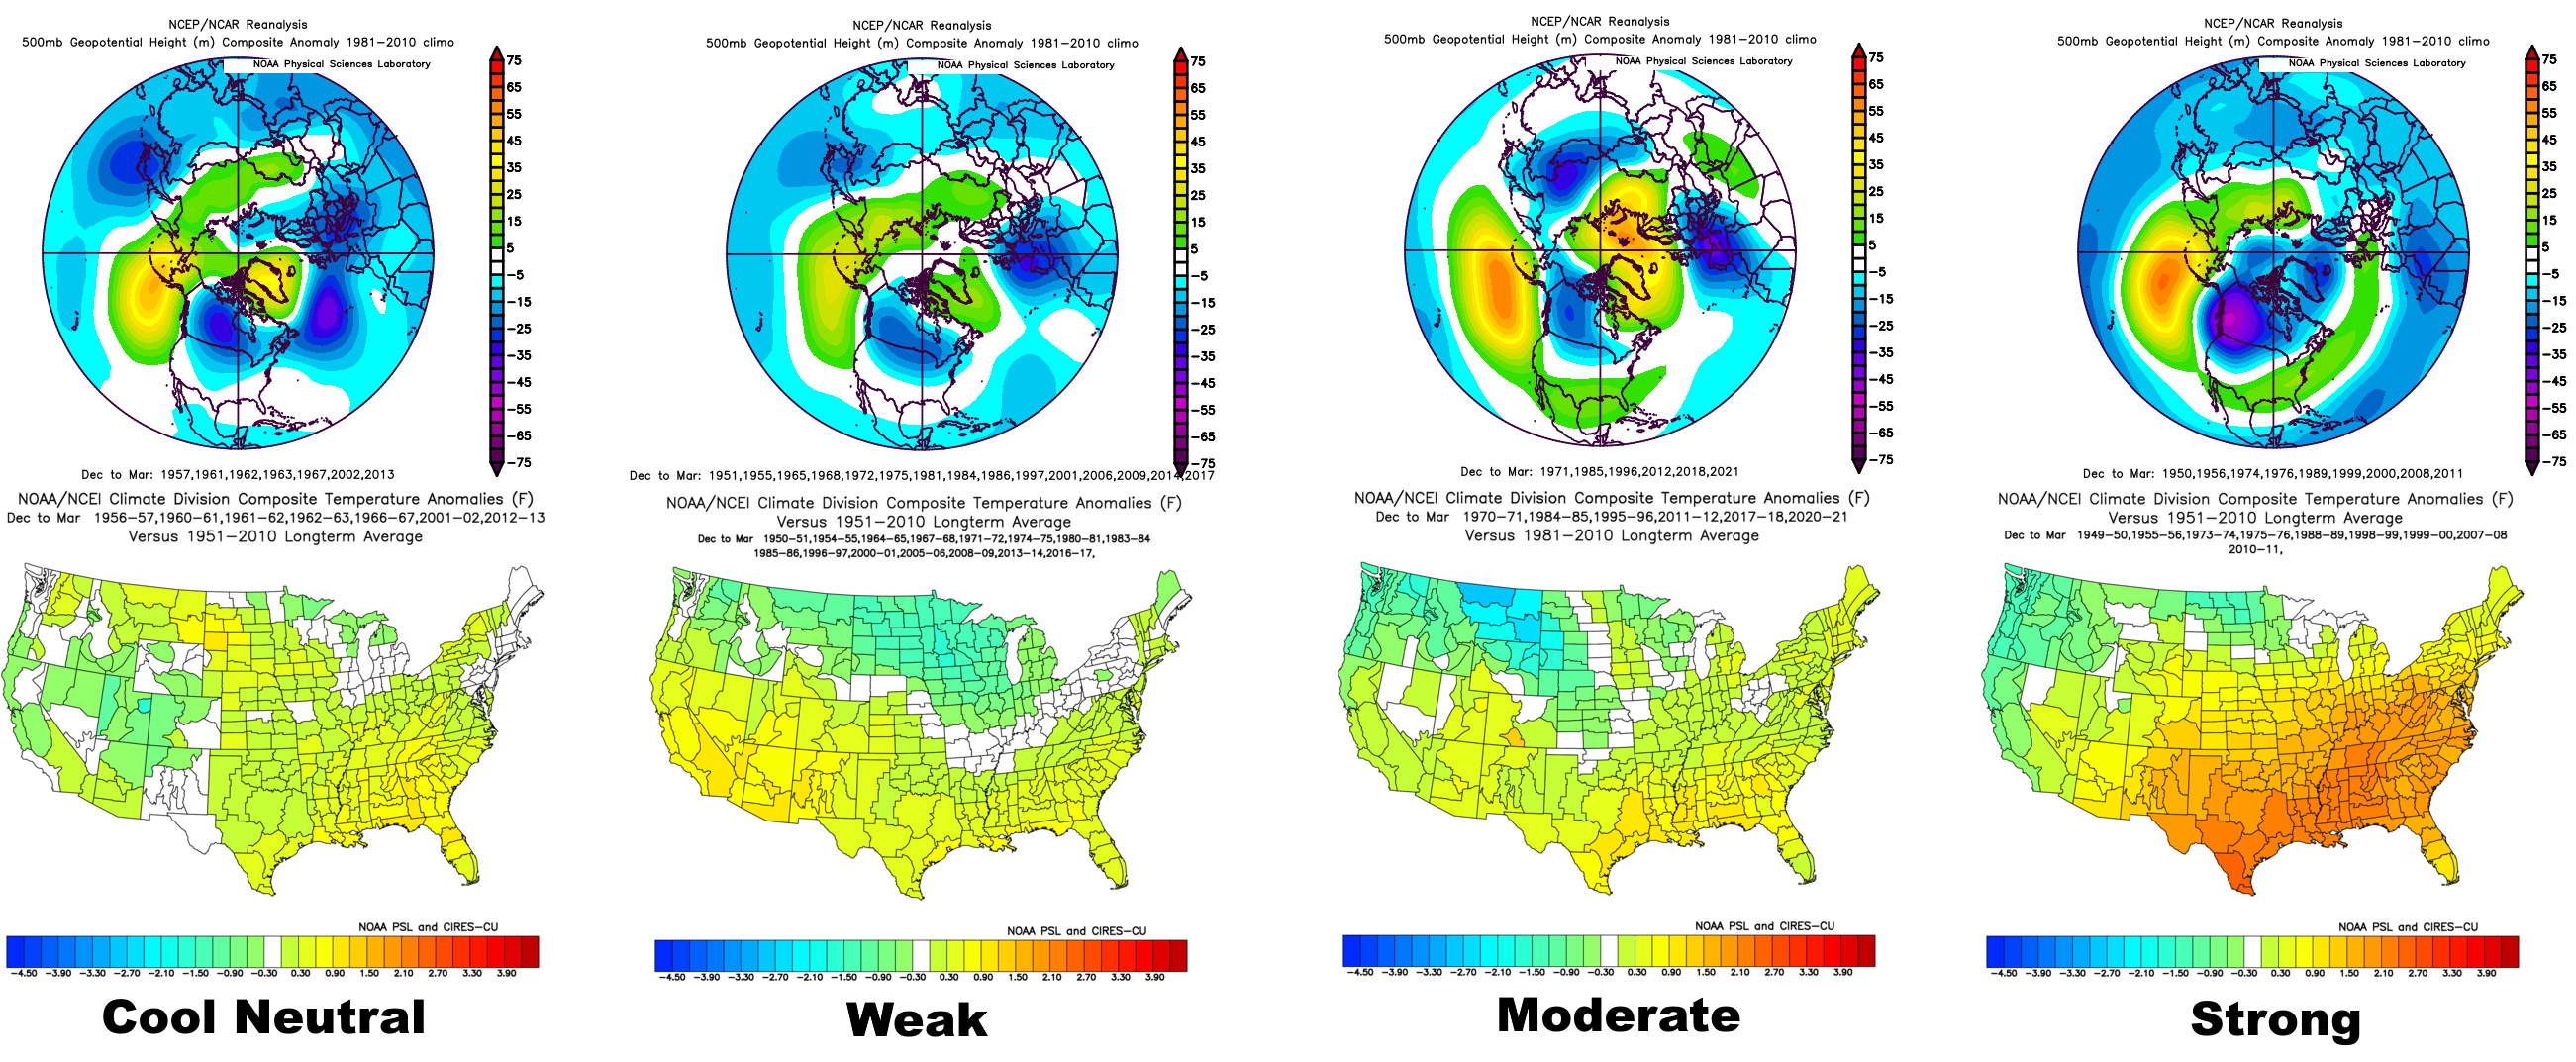
Cool neutral looks least “Nina like” with the North Pacific ridge edging farther east, a solidly -NAO, and unsurprisingly given the weak ENSO, a somewhat less defined temperature pattern (and is notably cooler in the Four Corners). Weak to moderate La Ninas begin to take on the most classic pattern, with the mean north Pac ridging shifting south / west, though it’s not totally disastrous until you get to the strong La Nina mean pattern. Note that only the strong La Nina composites have a blatantly +AO and NAO pattern, and unsurprisingly they’re by far the warmest, even with a winter like 2010-11 somehow happening with a strong La Nina.
Some stats to ponder, that will be referenced more throughout. Again, it’s still a small-ish sample for each individual ENSO intensity, so debatable how many of these are statistically significantly, but this isn’t a paper it’s a blog post so let’s not dwell:
Out of all cool ENSO winters since 1950, 15/37 (41%) had an overall -NAO for the December – March period, with 5 more (14%) averaging positive but still having 1 or 2 months with notable blocking. 22/37 (59%) had an overall -AO for the period, with 4 more (11%) averaging positive but still having 1 or 2 months with notable blocking.
“Notable blocking” is defined as one month with a -NAO or -AO (whichever one I’m referencing at the time) with a value of -1 or lower, or two months of -0.5 or lower, even if the overall December-March period averages positive.
The difference between La Nina winters that have a -AO vs a +AO is significant. Here are -AO La Nina winters in the CONUS (leaving out cool neutral years) vs the +AO La Ninas:

Of these 37 cool ENSO events, 32 occurred when reliable records for sudden stratospheric warming events (SSW) have been kept, and 16 of those 32 (50%) had a SSW event. Here is what any La Nina winter (this excludes cool neutral winters) with a SSW looked like, vs any La Nina winter that didn’t have a SSW:
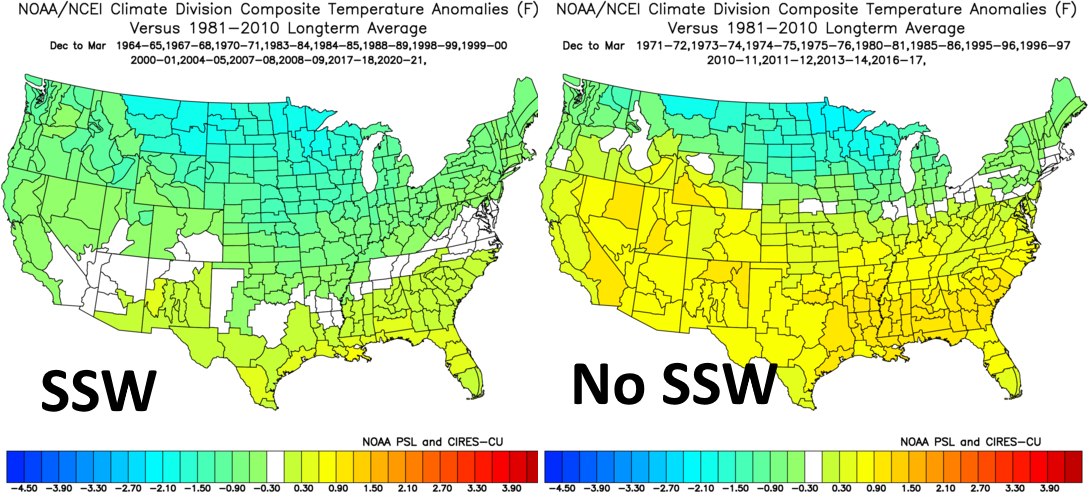
Interestingly, there is little difference from the Upper Midwest into New England. However, the mean for La Ninas with a SSW is cooler across the southern U.S. across the board. This likely indicates that cold air punches well south more easily in a La Nina that has a SSW event vs one that doesn’t.
Some more stats:
Cool neutral ENSO winters: 3/7 had a -NAO overall with 1 more having notable blocking. 5/7 had a -AO overall, and the other two had notable blocking. 2 out of 6 possible winters (one being too far back in time for reliable SSW data) had a SSW event.
Weak La Ninas: 6/15 had a -NAO overall, with 4 more having notable blocking at some point. 9/16 had an overall -AO, with 1 more averaging positive for the D-M period but having notable blocking at some point. 6/13 possible had a SSW event.
Moderate La Ninas: 4/6 had an average -NAO, and 1 more had notable blocking. 5/6 had a -AO overall. 4/6 had a SSW.
Strong La Ninas: 2/9 had an overall -NAO, and 3/9 had a -AO, with 1 more having a notable negative month. Surprisingly, 4/7 possible had a SSW.
Overall, 8/16 cool ENSO winters that had a SSW went on to have an overall -NAO, with one more still having a month or two of notable negative NAO. 10/16 had a -AO, with two more still having a notable negative month or two. Overall, the SSW cool ENSO winters as a whole aren’t necessarily more prone to having a -AO than other cool ENSO winters but it does seem to at least somewhat help -NAO prospects.
While La Nina does tend to promote a stronger polar vortex, and hence can help lead to a +NAO, AO, and EPO (quite a warm pattern, just ask January and February of 2020 or much of the 2011-12 season), clearly cool neutral events, along with weak and moderate La Ninas, can be workable with regards to either an overall -NAO or -AO winter, or a winter that averages positive but still features notable blocking episodes.
La Nina Location
Beyond the intensity of La Nina, the location of where the cooling is focused is quite important. This is similar to the whole “El Nino Modoki” thing, except with La Nina, and can make a big difference. The idea of focusing not only on the strength of the La Nina, but also where the cooling is focused, has gained quite a bit of traction in recent years, and this is a commonly referenced paper:
https://link.springer.com/article/10.1007/s00382-014-2155-z
The following figure from that paper shows the differences they found between eastern Pacific and central Pacific-based La Nina events:

The EP events (top) have a more neutral AO (whereas the CP events have a very positive AO), along with slightly more ridging into Alaska and a somewhat negative NAO. This results in a much weaker (though, still present) Southeast Ridge compared to the CP events. Overall, the pattern shown for EP La Ninas is not nearly as warm (and futile for snow) in the central and eastern U.S. as CP La Nina events.

I binned the aforementioned 37 “cool” ENSO years into central Pacific, eastern Pacific, and “hybrid” (characteristics of both) based events. Note, a few of the cool neutral events were too undefined and left out. It roughly matches the paper…eastern Pacific-based events have a weak mean -AO and -NAO, with more ridging into Alaska, resulting in the coldest temperature composite across the CONUS. Central Pacific events are least hospitable for cold / snow in the central and eastern U.S. overall, with a +AO, +NAO, and +EPO mean, while the hybrid events are decidedly La Nina-like in the Pacific, with a -PNA, but have enough of a -NAO that they’re somewhat redeemable. In general, central Pacific-based events tend to be stronger than eastern Pacific-based ones.
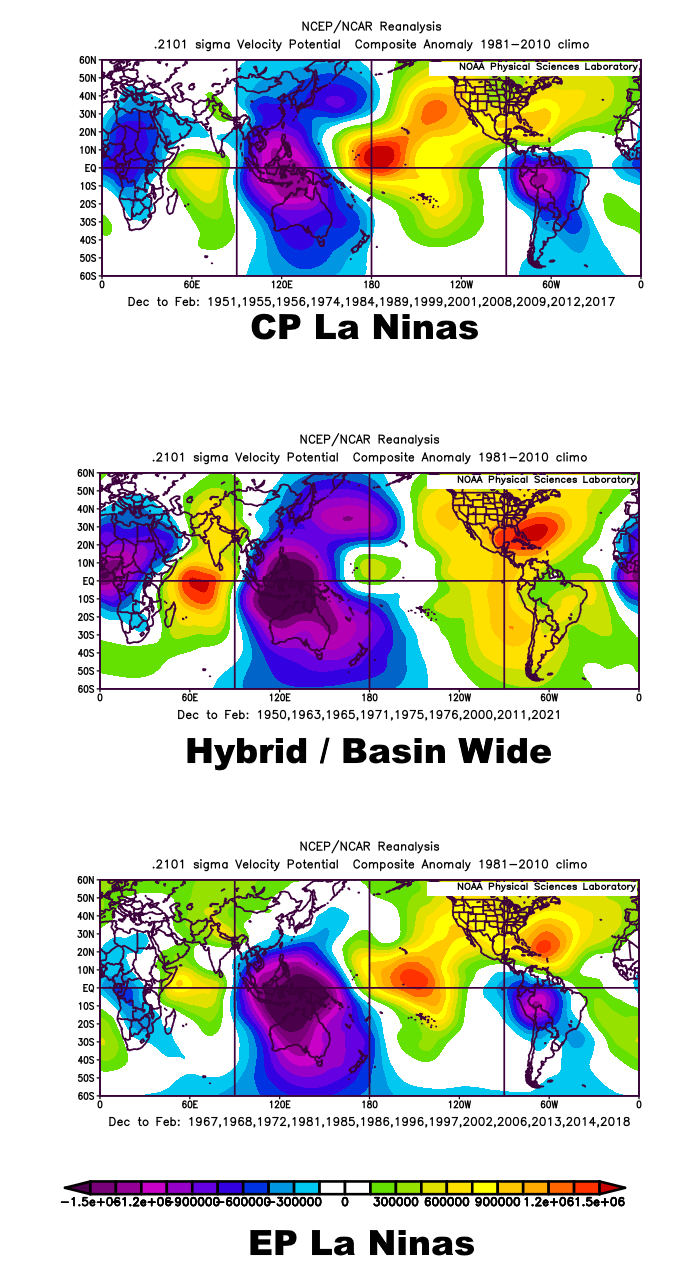
Here are the VP anomalies sorted by “location” or “type” of the La Nina…the standing wave is focused near 120-130E in all of them, though CP La Ninas have the strongest sinking anomaly near the Dateline. Dateline convection is good for cold in the central and eastern US, whereas a lack of it isn’t. That seems like the most striking difference to me.
Out of the 12 CP events ID’d, 4/12 had an overall -NAO, though 6/12 managed an overall -AO, with one more having notable blocking at some point.
Out of the 9 hybrid events, 5 had a -NAO and one more had notable -NAO months at some point…interestingly, 5/9 had an overall -AO, but no other years have a +AO but notable blocking in 1-2 months (this is one of the few where there’s more -NAO than -AO).
Out of the 13 EP events ID’d, 5 had an overall -NAO, with 4 more having notable -NAO months worked in. 8/13 had an overall -AO, and 3 more had notable -AO months worked in.
Overall, the CP events seem somewhat less likely to have a -NAO and -AO than overall cool ENSO winters, though some winters have done it. Hybrid events seem a bit more prone to having a -NAO winter, while EP events don’t hurt -NAO chances and really help -AO chances.
This Year’s La Nina
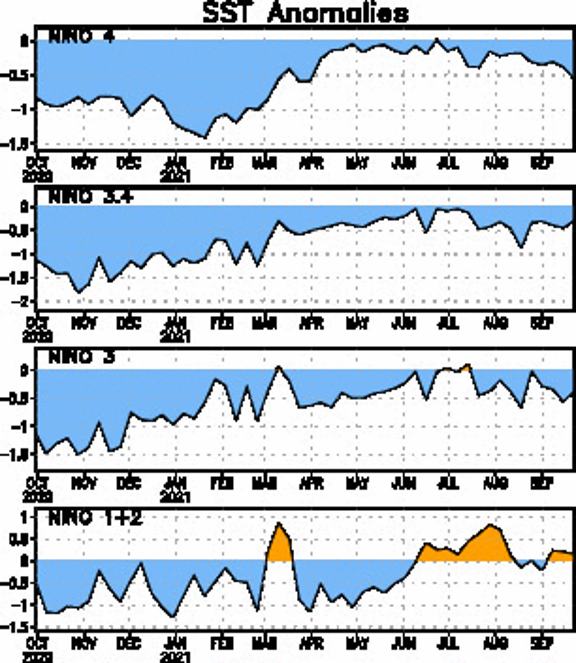
So far, the surface cooling has been gradual and modest, with Nino 3, 3.4 and 4 near a -0.5C anomaly…Nino 1+2 has been struggling to dip negative, though has cooled a bit recently. The sub-surface is more impressive, however:

There’s a fairly large area of greater than -2C anomalies beneath the central Pacific. So far, it’s been a struggle for this to upwell efficiently, especially the farther west you go, but the sub-surface anomalies are notable…greater than they ever got with last winter’s borderline moderate event:

The SOI averaged +16 in July, +4 in August, and +9 in September, likely coming in near 10 in October based on my very informal eyeballing of forecast MSLP patterns across the Pacific. As long as this keeps up, the surface should continue to at least gradually cool through the fall as the chilly sub-surface water upwells.
With the surface still consistently running warmer than 2020, but with a cooler subsurface and continued positive SOI, it seems like a solid weak La Nina is favored with moderate still possible if we see more surface cooling soon.
The CFS continues to advertise a borderline strong La Nina and has consistently been on the strong side of guidance with this event. SSTs over the last couple of months have not been cooling as quickly as the CFS has been insisting on. With a continued +SOI and enhanced trades, to go along with the chilly subsurface, cooling of the surface through the fall is quite likely, but the rapid cooling into October isn’t quite happening so the CFS still seems too strong with its forecast.

The ECM ENSO plumes are on the other side, with the mean being a borderline weak La Nina that weakens into the spring. The CFS also has the weakening into the spring. However, the ECM is already running slightly too warm with the forecast heading into the beginning of October (we’re right around -0.5C right now), and in my opinion doesn’t have enough cooling through the fall. A few members still touch moderate.
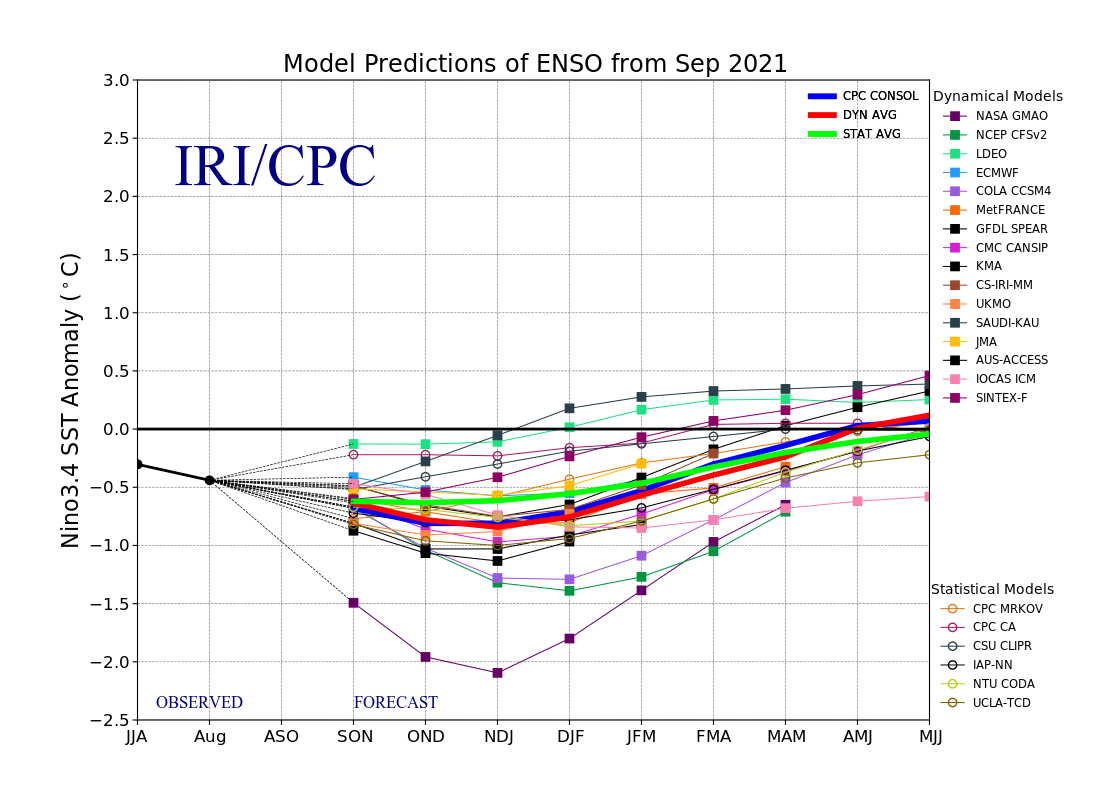
The September IRI ENSO plumes seem like a decent middle ground, as the dynamical average (red line) has a tri-monthly peak of around -0.8C. I feel like some strengthening is likely through the fall before weakening into spring, and that a solid weak La Nina is likely with some potential to reach moderate.
From the same aforementioned paper, here is the overall profile / evolution of east based, central based, and “hybrid” La Nina events (respectively):
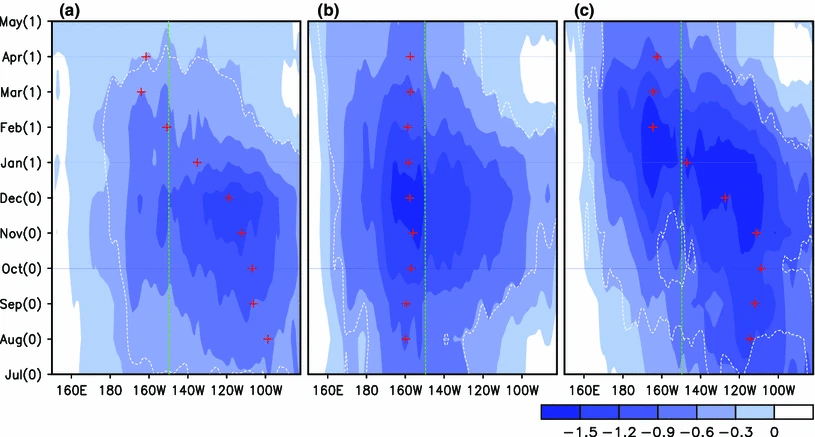
In the eastern-based events, the cooling is initially centered off the South America coast and gradually propagates westward, whereas in the central Pacific-based events the cooling is centered west of 150W. Hybrid events initially have a more east-based cooling but tend to be stronger and eventually cool more into the central Pacific.
This time-longitude plot of the SST anomalies, courtesy of the CPC, shows that cooling was initially east based late spring into early summer, and is still firmly strongest east of 150W. However, Nino regions 1-2 have been somewhat warm until very recently, and there has been a bit more cooling near and west of the Dateline than is typical this early in an east based event. This event is NOT central-based, but it may be something between an east-based and hybrid event as 2020-21’s La Nina was.
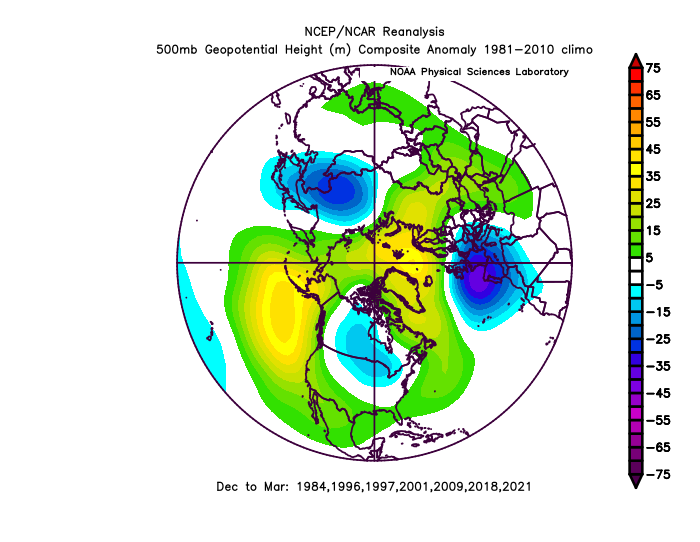
First cut of the cool ENSO winters…winters that saw a weak to moderate La Nina that was either east-based or hybrid:


Certainly not a bad look at all, with ridging in the North Pacific amped enough to force the PV a little farther southeast over North America, which is quite a bit cooler for the central and eastern CONUS. There’s also a somewhat -AO and -NAO in the mean pattern. Somewhat typical La Nina precip pattern, wet in the Pacific NW and northern Rockies, along with the Ohio Valley, though somewhat drier into places like New England. As is often the case most of the south is fairly dry overall in these winters, though places like NM and western TX aren’t quite as dry.
7/14 of these winters had an overall negative December-March NAO, and 5 more were positive overall but had a month or two of notable negative. 10/14 had a -AO overall, with one more having some notable blocking worked in. Overall, a greater share of both -NAO and -AO winters than all cool ENSOs combined. 7/14 had a SSW event.
Second Year La Nina
Before moving on to some QBO stuff, just wanted to touch on 2nd year Ninas, as that’s often a point of emphasis (first vs second year ENSO events) when searching for analogs. Overall, 2nd year cool ENSO events (of all intensity and location) are ugly:

That’s a +EPO, -PNA, and at-best neutral NAO and AO. It’s a mild look for the eastern US with a Southeast Ridge. Taking 2nd year cool ENSO events and limiting it to weak-moderate, east-based and mixed La Ninas, it improves a bit:

The biggest differences are the EPO being noticeably less positive (and perhaps a bit negative overall), and lower heights over southeastern Canada which would keep the Midwest, Great Lakes and New England colder. Differences at the surface, all 2nd year cool ENSO events on the left, the better ENSO intensity and location matches on the right:

Overall, it’s encouraging that the “better” 2nd year ENSO matches are colder than all 2nd year events. Not many of these winters are great QBO matches (which I’ll get to next) and it’s not a huge sample, so even though 2nd year La Ninas kind of get a bad rap (and you can see why) I don’t think it’s any kind of overwhelming factor here.
Quasi Biennial Oscillation (QBO)
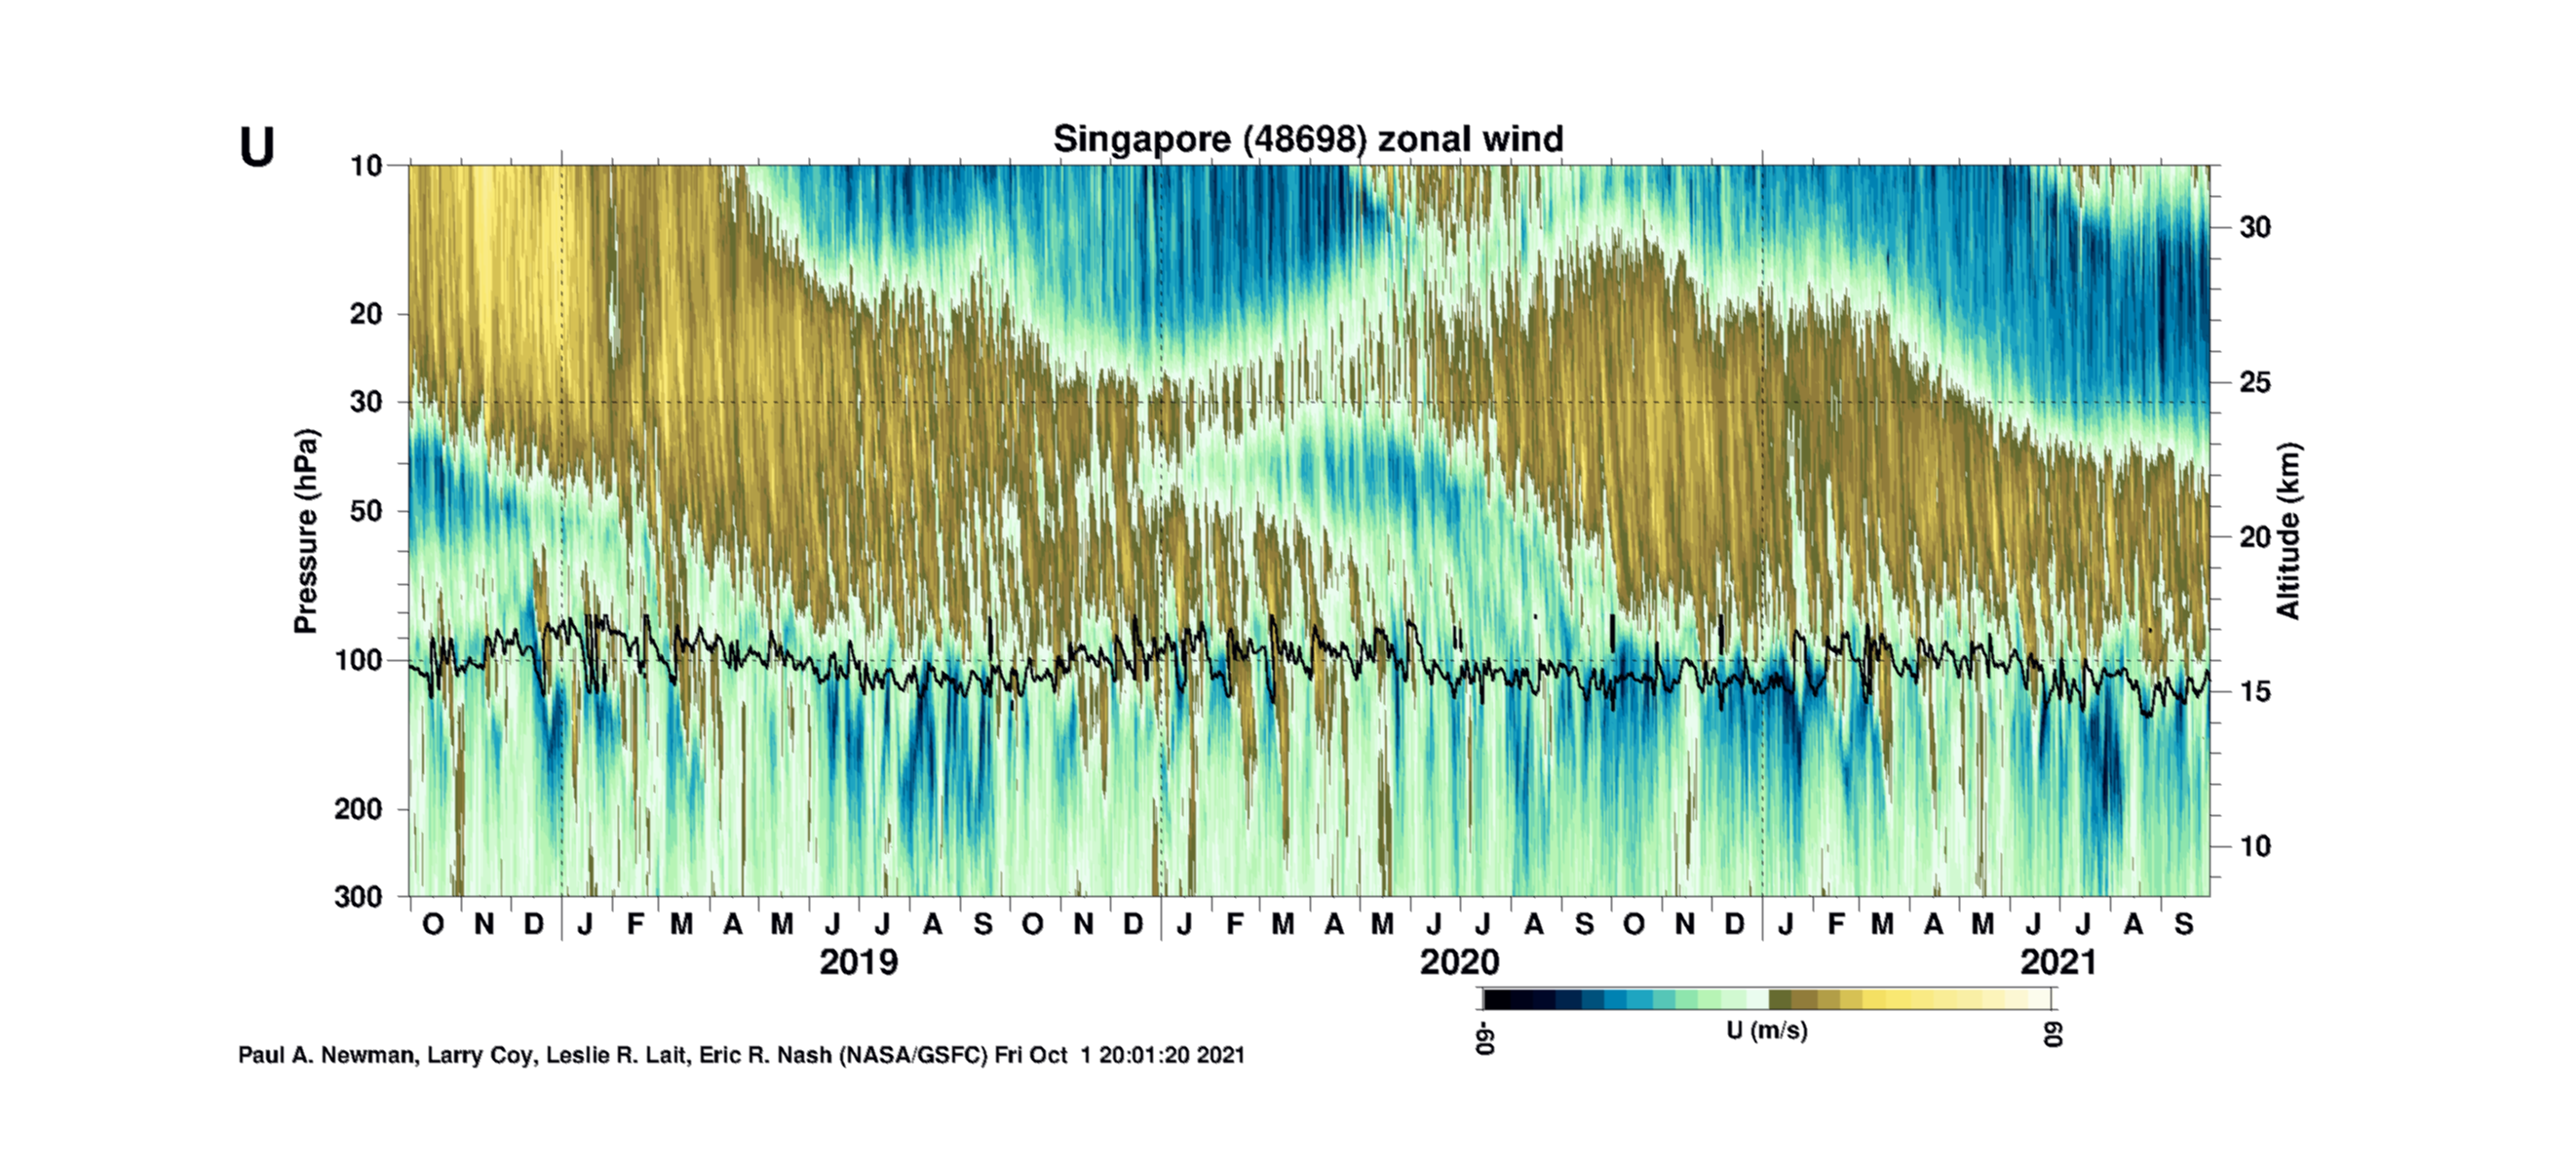
We’re going to have a -QBO at 30mb and 50mb this winter. The September value at 30mb was -16, and there are stronger easterlies above 30mb that are still downwelling. The 30mb QBO will be quite negative through this winter, potentially starting to rise into spring. We will start first with cool ENSOs that have a negative / easterly QBO at 30mb:

The main differences to the overall cool ENSO winter composites is a more -NAO and lower heights over much of North America, which mutes the Southeast Ridge somewhat in the means.
9/18 of these east QBO 30mb winters had an overall -NAO, with 3 more having notable blocking for a month or two. 13/18 had an overall -AO. 9/14 possible had a SSW event. Overall, having a -QBO at 30mb in a cool ENSO winter seems to increase the potential for a -NAO, -AO, and a SSW event at least somewhat compared to normal in a cool ENSO winter, which isn’t unsurprising.
When you take just the weak-moderate, east-based or mixed La Ninas with an easterly QBO at 30mb, you get this:
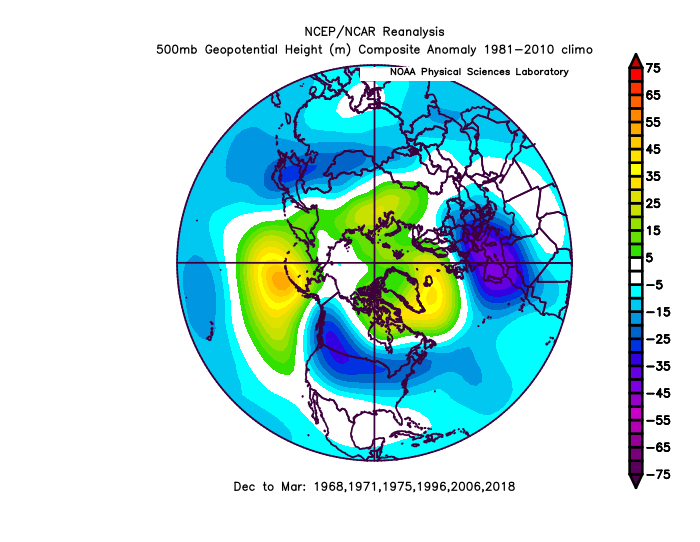

The big change is a somewhat more -AO and much more -NAO, which results in lower heights across much of the northern and eastern CONUS compared to the full set and is much cooler overall over the eastern US. It’s quite a good look and includes some La Nina winters that went quite “big” in the snow department.
4/6 had a -NAO overall, and the other two had a month or two of notable negative values. 5/6 had a -AO overall. 4/6 had a SSW event at some point.
Closer Examination of this Year’s QBO
If you recall back to the current time-height chart of the QBO, the structure of this year’s QBO is easterlies descending through the stratosphere, with westerlies hanging on below 50mb into the winter. We actually have a decently large set of years to use for this exercise. We have 11 cool ENSO winters with a similar QBO structure / evolution, and 9 with a rather opposite structure / evolution. We will explore what this does now…here are the years with a similar QBO:


Along with a somewhat -AO and decently -NAO, the EPO is decidedly more negative than all cool ENSO events combined, and even more negative than just easterly 30mb QBO winters with better ENSO matches. The PNA is closer to neutral too (though I’m not sure I buy that given how negative the PDO looks heading into the winter). Overall, 6/10 of these winters had a -NAO overall, with one more with notable blocking for a month or two. 8/10 had a -AO overall, and 7 had a SSW event.
Here are the 9 cool ENSO winters with a relatively opposite QBO structure to this winter:
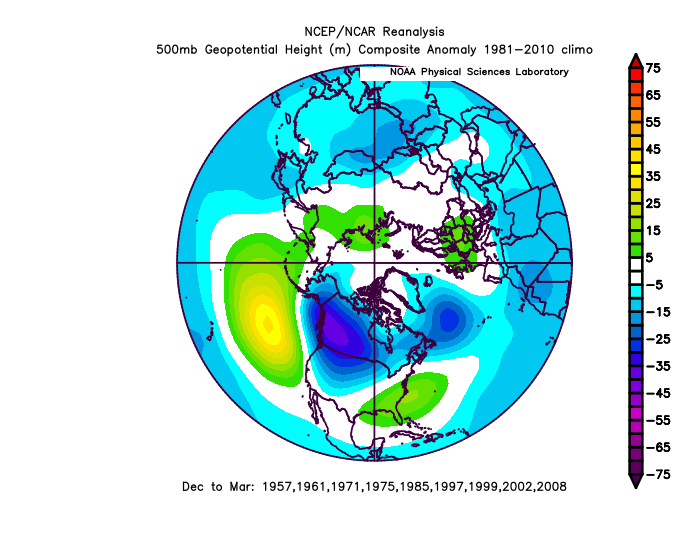

Definitely a much more -PNA, +EPO and +NAO, giving the cold west, warm east look that pops up and ruins some La Nina winters. Excitedly and probably not surprisingly, this difference holds up when looking at weak-moderate, east-based and hybrid La Nina events:

Here’s a look at how similar ENSO (weak-moderate, east based or mixed La Nina) winters act with similar QBO evolution and opposite QBO evolution. The sample size does start getting rather small for the oppose QBO winters, but overall, you can see the large difference in the EPO, PNA, and even NAO domains and how winters with a similar QBO to this winter tend to be colder overall in the CONUS…and tend to be colder in the east and warmer in the west.
The winters with a similar QBO and ENSO (the set on the right in the above image) all have blocking…4/5 have a -NAO, and the other (17-18) had a notable -NAO for one month. They all had an overall -AO. 4/5 of those winters had a SSW event.
Thus far, the anticipated strength and location of the La Nina, along with the QBO (both just having a -QBO at 30mb, but especially the evolution with the easterlies downwelling through the stratosphere during the winter) all point to increased potential for a -AO and -NAO compared the typical cool ENSO winter, along with optimism that the EPO can be neutral to perhaps somewhat negative this winter…most signs, so far, pointing to this being the type of La Nina winter that doesn’t have the stereotypical cold west / warm east look with a +NAO and Southeast Ridge.
Solar Cycle
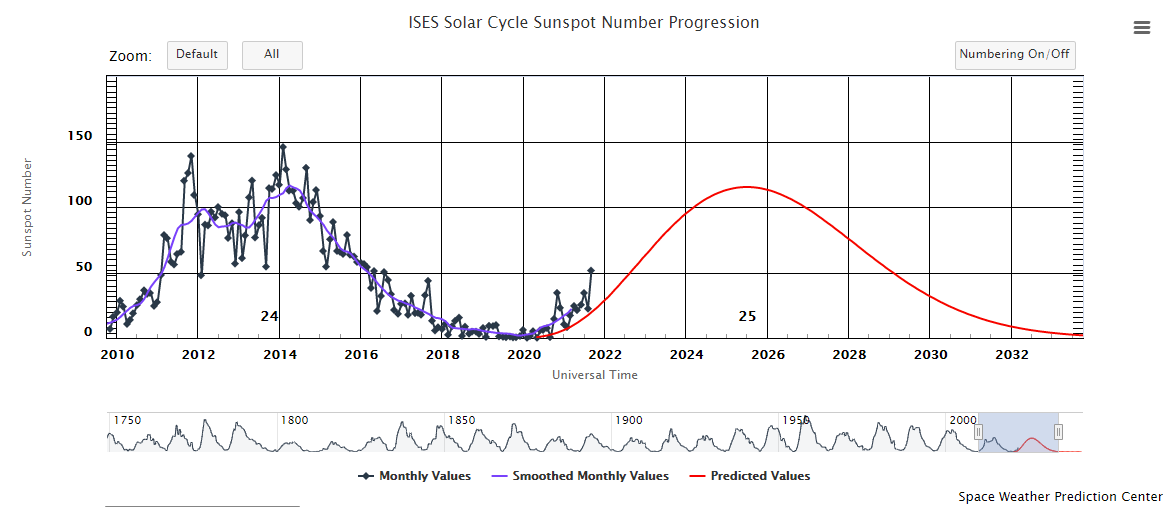
We are coming out of a deep solar minimum between solar cycles 24 and 25. Many papers (such as this one: https://agupubs.onlinelibrary.wiley.com/doi/full/10.1029/2005JD006283) have attempted to establish a link between the solar cycle and northern hemisphere winter stratospheric / blocking patterns. In general, years in a solar minimum tend to have a weaker stratospheric polar vortex and are more prone to blocking, with the opposite true in solar maxima winters. There has been some theorizing that the signal lags a bit, i.e. the greatest potential for blocking is during and just after a solar minimum (and vice versa for maxes). Regardless, sunspots are beginning to increase as we head into cycle 25; barring a significant increase this fall this shouldn’t be a negative yet.
Out of the 37 cool ENSO winters examined since 1950, 11 occurred during or within a year or two of a solar minima. Here is what their overall 500mb and temperatures did when blended together:
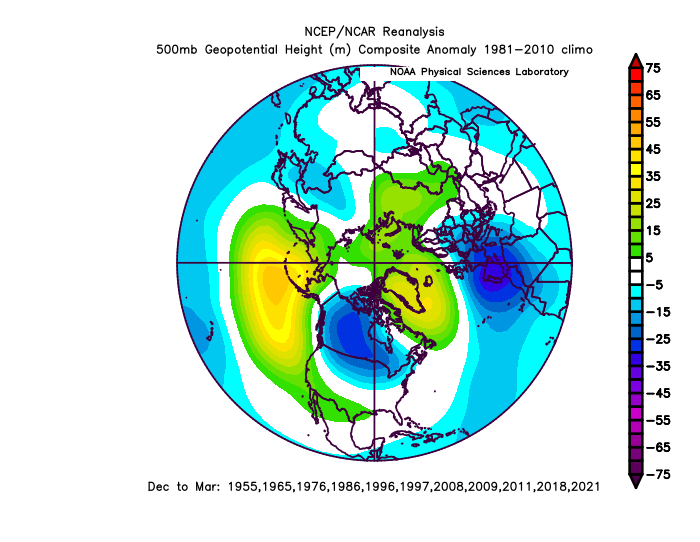

It’s somewhat reassuring that there are several winters in here that don’t make the previous QBO or “better ENSO” sets, and we still get a signal for somewhat higher heights into AK, a better -NAO signal, and a cooler look overall in the CONUS compared to the “base” for cool ENSO winters. With small sample sizes and the same years showing up in certain sets, it’s tough to filter out what’s legit or not, but there are a few strong La Ninas in here, several winters that are poor QBO matches, and a few central Pacific La Ninas, so perhaps there is at least something there to the idea of being in or just past a solar minimum enhancing blocking potential in a cool ENSO winter.
Out of these 11 winters, 5 had an overall -NAO, though 3 more also had notable negative values for a month or two as well. 7/11 had an overall -AO, and one more had a strongly negative month mixed in. 5/10 possible had a SSW. Small-ish sample, but it does seem that overall this portion of a solar cycle is at least somewhat more conducive to a -AO (and somewhat a -NAO) compared to all cool ENSO winters.
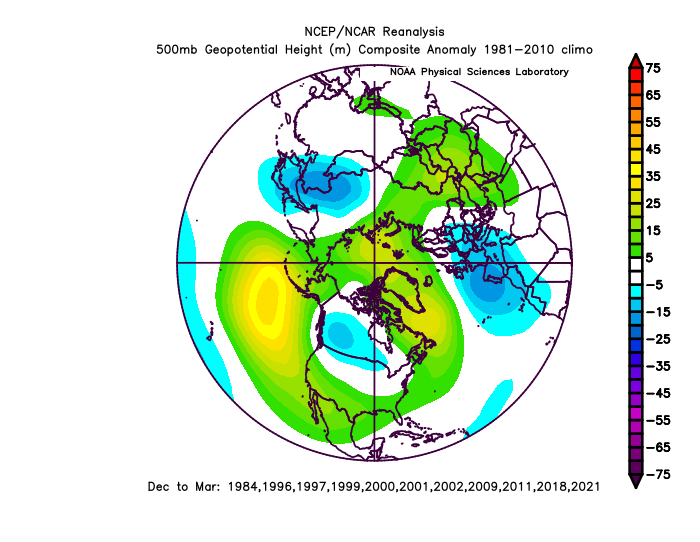
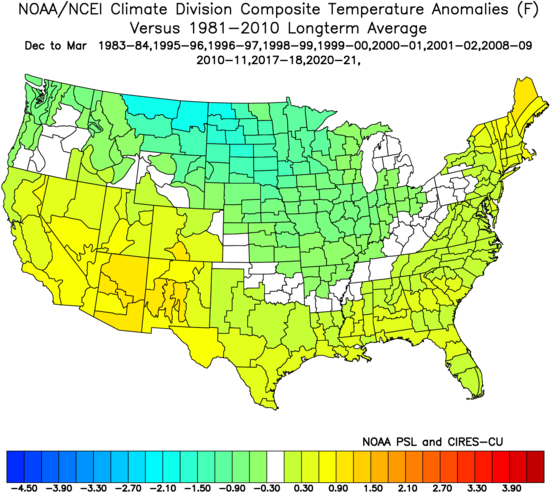
Like everything else, focusing on weak-moderate, east-based or mixed La Ninas makes the Pacific a bit more favorable and doesn’t hurt the -NAO signal overall, which makes things a bit cooler over the central and eastern US:


Interestingly only 3/6 have an overall -NAO for December – March, though the 3 that averaged positive (85-86, 96-97, 17-18) still have a month or two of notable negatives. 5/6 had an overall -AO, and the one that didn’t (96-97) still clocked a -1.7 for December. Despite all having an overall -AO/NAO or at least some notable blocking at some point even if it was positive overall, “only” 3/6 had a SSW event. Small sample, but impressive that each winter in a similar point in the solar cycle with a reasonably close ENSO to this year had some notable -AO/NAO at some point (if not simply negative overall for the whole winter).
Indian Ocean and Western Pacific Warm Pool
Moving back towards SSTs and tropical forcing, we have a somewhat negative Indian Ocean Dipole this fall along with a very robust western Pacific warm pool. Out of the 37 cool ENSO years since 1950, only 11 have a somewhat similar or similar combination, likely because the western Pacific warm pool has been growing more robust in general with time. All of these years are 1983-84 or beyond. First, here’s the entire set, regardless of how flimsy the ENSO match is to this year:
At 500mb and the surface, it’s fairly similar to the last 20 cool ENSO winters overall, though is somewhat cooler overall, especially over the eastern U.S. The EPO is a bit more negative in these winters, as is the AO, compared to all recent cool ENSOs overall. Robust forcing moving through the western Pacific, especially in the late fall and early winter, can help pump ridging into AK and also has been known to lead to disruptions to the stratospheric polar vortex. However, in mid-winter, forcing in those areas does (at least at t=0) tend to correspond to warmer conditions over the eastern CONUS, which may be why the set isn’t especially cold overall in the south and east, despite some encouraging sings for blocking.
Of the 11, only 4 have an overall -NAO for December-March, though 2 more have some -NAO for a month or two as well. 6/11 have an overall -AO, with 3 more having notable -AO for a month or two. Notably, 8/11 have a SSW event.
It’s worth noting that only 4 of these winters are a decent ENSO match..the others are either strong La Ninas, cool neutral, and / or central Pacific-based events. To maintain a somewhat decent sample size while focusing the ENSO a bit more, I’ll go with all weak-moderate La Ninas with a negative-leaning IOD and relatively warm West Pacific. When letting 3 weak central-based Ninas in, that leaves us with 7 winters that are relatively decent matches from the Indian Ocean east across the Pacific. They look like this:

3/7 have an overall -NAO, 2 more have at least a month or two of notable negative values, and 1 more (08-09) was weakly positive but averaged quite close to neutral all winter. 5/7 have an overall -AO, 1 more had a strong negative month at least, and the last (08-09) was again very close to neutral but slightly positive. 5/7 have a SSW event.
It’s interesting that the signal for a weak to moderate La Nina with a warmer western Pacific and negative-leaning IOD, like many other analog sets for this year seem to point to, also contributes to a decent likelihood for a -AO and SSW event and doesn’t hurt -NAO chances. It also has a look that’s come up a few times, even with some different years thrown in, of cold focused over the northern Plains / Upper Midwest but still working all the way to the East Coast, with a somewhat muted SE Ridge.
This Year’s Tropical Forcing
Looking at a similar thing from the same way…over the last two months, tropical forcing has been most prominent over the eastern Indian Ocean / western Pacific, and somewhat over the Atlantic towards South America:
And the multi-model consensus favors that general pattern of standing waves to continue through the fall. Based on current SSTs, it’s not unreasonable:

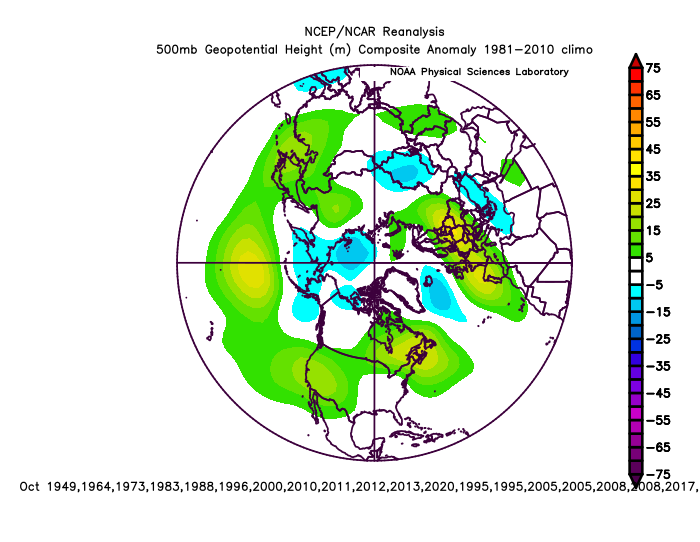
Looking for years with similar feature (in particular, the standing wave near 120E), there are several cool ENSO winters that have similar tropical forcing in the fall. Again, sort of making a guess / assumption here, but I don’t think it’s unreasonable:


Strong forcing in the eastern Indian Ocean / western Pacific isn’t a short term “cold” teleconnection for the central and eastern US during the heart of meteorological winter (in fact it’s warm), but as discussed above can eventually encourage blocking and perhaps SSW events. So, the overall pattern in winters following falls that had similar tropical forcing to what’s expected this fall makes sense. Overall it’s fairly blocky with a -AO, -NAO and -EPO on the mean, but the PNA is negative too. The coldest air is focused over the northern Rockies and Plains, but in some of these winters it still consistently powered through all the way to the East Coast.
The Analogs
When factoring all of the above factors…ENSO, QBO, solar cycle, Indian Ocean / western Pacific waters, expected tropical forcing…here are my current analogs, with some weighting:


The October pattern has some similarity to what’s modeled for this year, with a +EPO and ridging over eastern Canada, however, it may not be negative enough with the PNA:
From there, the mean pattern in the analogs begins developing blocking in November, which peaks in December with a trough centered near the Great Lakes. The NAO is negative in November and December, positive in January and more neutral in February. While the AO remains negative on the mean in January and February, the EPO gradually rises and the PNA falls, which allows the southern and eastern US to warm up. In March, a -NAO and -EPO return with a -PNA persisting.
Based on the factors examined and factoring in some uncertainty, I think the mean analog pattern is a very decent starting point for this winter.
Among the analogs, I want to briefly examine which analogs finished with a more negative / positive AO, how they played out, and how they got there:

In terms of how the winters play out, it’s interesting. The two +AO winters in the set were blowtorches with little snow in the central and eastern U.S. Between the strong -AO winters and the more variable AO winters, the NAO is much more negative in the strongly -AO winters. The cold isn’t as intense in the northern Plains / Upper Midwest, but it’s much cooler in the Southeast. The more variable AO winters are colder in the northern Plains / Upper Midwest into New England but have a stronger Southeast Ridge…it’s much more of a gradient pattern.
5/7 of the stronger -AO analogs had an SSW event, 3/6 possible of the variable AO analogs had an SSW event, and though 88-89 had an SSW it was in late February…11-12 didn’t have one.

In terms of what to watch for to try to determine which way this winter will break, we’ll start with October – December SSTs, something that will be fairly easy to track over the next couple of months. Sort of ignore ENSO strength, as one of the two winters that went +AO was a strong La Nina and skews it. But outside of that, the -AO winters are notably warmer in the western Pacific than the other two sets. The +AO winters are notably warmer farther west in the Indian Ocean and have a -AMO look with a cool north Atlantic, whereas the other two sets have a more neutral to positive AMO look with a warmer north Atlantic (especially the -AO set). The -AO set has warmer waters nosing all the way towards the west coast at 30-40N, while the middle set is more mixed there and the +AO years have colder water working down the west coast in the fall. Here are current SSTs, and the multi-model consensus for this October-December:

The warm West Pac / eastern Indian Ocean, +AMO look / warm north Atlantic, and eastern extent of the stripe of warm waters in the Pacific all look more like either the -AO or more variable set as opposed to the +AO set…though, let’s see if this holds up through the fall.

Differences in the pattern leading up to these winters became evident in the fall. Looking at the October pattern, years with a -AO had blocking near Scandinavia and the Urals, whereas the other two sets didn’t. The +AO set has a +EPO/+PNA combination in October that neither other set has. The variable set has a flat ridge south of Alaska and the Aleutians, which neither other set has (though you can argue the -AO set has it but it’s displaced west). Over N America, the -AO set has a western US ridge and ridge over SE Canada. The +AO set has a similar look too, but with much more troughing over the eastern US. The variable set looks most similar to the modeled October pattern for this year in North America in my opinion:

The CFS and ECM Weeklies certainly can be quite wrong, but here are their last bids for the overall October 500mb pattern. They’re both remarkably similar overall. I see a mix of things that match the Octobers proceeding -AO analogs and those proceeding more variable AO analogs, though little that matches the +AO analogs.
Of note, the flat ridge south of the Aleutians and negative anomaly near the West Coast (a -PNA) seems closest too the -AO analogs, though isn’t quite perfect. The Ural / Scandinavian ridge is also closest to the -AO years, as is the modest positive height anomalies near Greenland (the other two sets have negative anomalies). The North American pattern looks most like the variable AO set. The subtle trough extending towards Japan on both models is there in both the variable and +AO set.
Overall, the modeled October pattern would seem to argue against going the way of the +AO analogs, and probably has more pointing towards the -AO analogs outside of North America. But, it looks much more like the more variable / closer to neutral AO analogs over North America.
If there’s any doubt still after October, the analogs that went +AO really started to stand out in November compared to the rest:

Seasonal Model Predictions
Looking into some current model forecast guidance, as has been mentioned by many over the last couple of months, the August and September forecasts from two models that have recently done ok in terms of forecasting winter stratospheric polar vortex strength ahead of time, the UKMET and European seasons, are forecasting a relatively weak stratospheric PV in their most recent (September) runs, especially early in the winter:

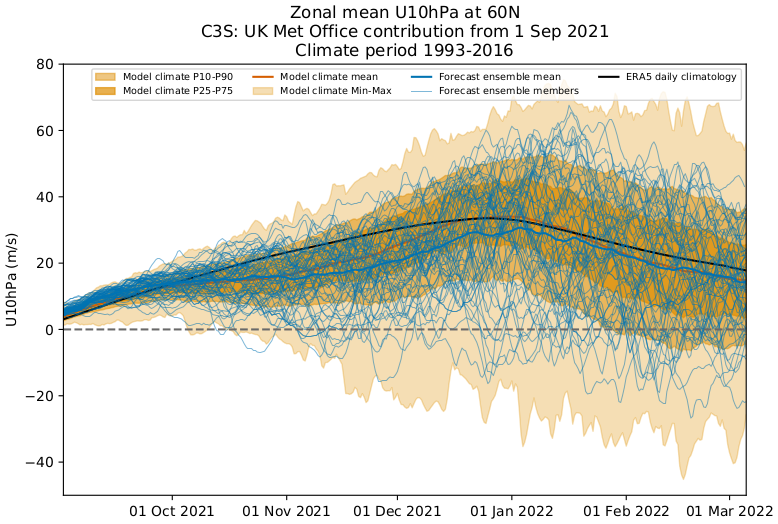
Again, these forecasts from the models can certainly be wrong this far out, but they’ve shown some success in recent winters. At the least, it’s not a bad thing that models are trying to hint at a weaker stratospheric polar vortex to start this winter as several analogs corroborate that idea. The September multi-system forecast (Copernicus) mean SST anomalies featured a weak, basin-wide / hybrid / mixed La Nina for the winter:

I think this is overall reasonable, though again can’t rule out a run at moderate. Regardless, it seems to be in a decent spot ENSO wise to look at and compare to some of the analog-based thoughts. Here’s a look at the September runs of the previous-discussed European and UKMET seasonal models, along with the JMA:
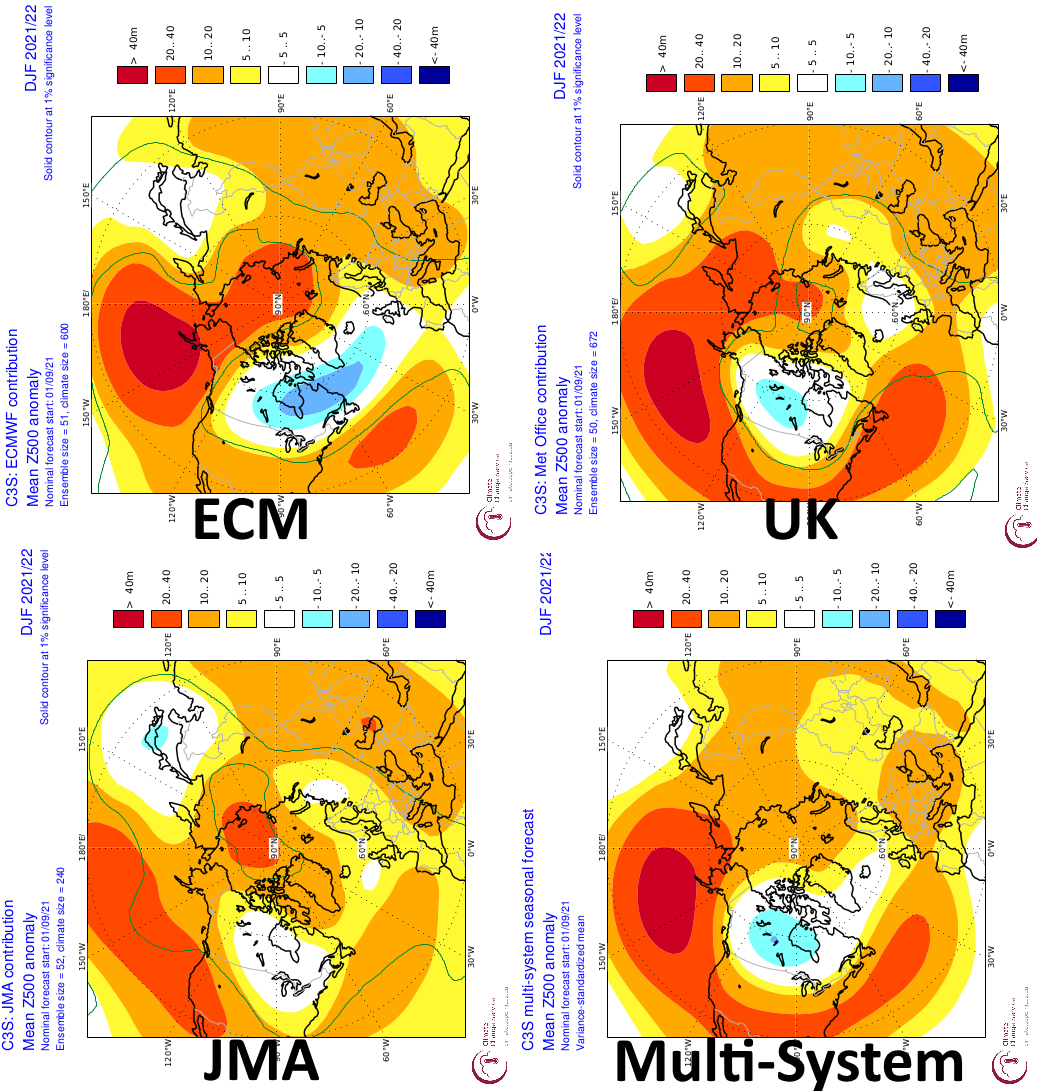
The Euro is almost a dead ringer to the “variable” or closer to neutral AO analogs, with a definite -EPO and negative leaning AO overall, but a +NAO allowing for the Southeast ridge to flex more. The UKMET is a little farther west with the ridging over the Pacific and starts sagging the TPV into more dangerous territory over western Canada. It’s too neutral with the NAO for a strong SE ridge not to crop up. The JMA looks more like the -AO years, with a bit more of a negative near Japan and also decent ridging near the North Pole, extending towards Greenland. It has the trough the farthest southeast over North America overall.
The multi-system mean, including many others such as the CFS, Canadian, and French seasonal models, looks a lot like the analogs that had a more variable / closer to neutral overall AO.

The 2m temperature forecasts suggest more trouble for the cooler air to push into the CONUS than the analogs imply…perhaps there’s a gradual trend towards that due to Hadley Cell expansion, but likely not this quick. Based on what similar 500mb patterns have done in past winters, outside of the UKMET which is closer to being more dangerous I think the 500mb patterns on the ECM, JMA, and overall multi-system mean are encouraging for a cold winter in the northern U.S. with some ridging over the Southwest and Southeast, with a gradient pattern in between. The UK depiction looks similar to weak-moderate La Ninas that have a more opposite QBO downwelling to this winter, which is interesting.
For what it’s worth, the CFS also looks a lot like the analogs that had a more variable AO:

The 2m colder temperature anomalies, much like some of the other models, also struggle to push south into the CONUS compared to the analogs on the CFS.
Overall, the variable AO look among the analogs is the one I’m currently keying in on, though enough supports a more -NAO too that the analogs that featured a -NAO and were much cooler into the Gulf Coast, Southeast and Mid Atlantic aren’t off the table yet. It currently seems unlikely that we’re moving towards the +AO analogs.
Final Thoughts on Winter 2021-22, for Now
Things to watch for during the fall that could make this winter trend towards a more +AO, NAO and perhaps EPO would be a sharp increase in sunspot activity, a stronger or more central Pacific-based La Nina, more forcing over the Indian Ocean, or a stronger than normal stratospheric polar vortex in the fall that couples to the troposphere.
Things to watch for that could make this winter trend towards more blocking would be the La Nina staying weaker and not being centered too far west, along with a decent amount of western Pacific forcing and less farther west in the Indian Ocean. Sunspots remaining fairly low would be beneficial. Ural / Scandinavian blocking in the fall seems to proceed analogs that had a stronger -AO. The stratospheric polar vortex remaining weaker through the fall and not getting too coupled to the tropospheric PV would seemingly aid the odds of following the strong -AO analogs.
At some point, probably mid to late November, I hope to revisit and really hone in. At that point, I may give monthly temp maps a stab! Let’s see how things evolve through the fall.
