Quick Summary:
The very mild pattern that has developed to end December will slowly transition to a colder pattern through the first half of January…however, a positive AO and EPO, with a lobe of the polar vortex settling over Alaska to end December and start January, will slow the transition back to a colder pattern. Any cold through the middle third of January is likely driven by improvements to the Pacific pattern, with a likely lack of a -AO or -NAO. The Pacific pattern may become quite conducive to significant cold shots from late January into February, with the AO and NAO also likely trending more negative starting in late January. Basically, winter will gradually return and then worsen through January if I’m correct, though don’t rush the transition in early-mid January.
Very detailed, technical discussion:
The fall and first few weeks of meteorological winter have been interesting…there have been periods of active convection in the western/central Pacific, resulting in relatively higher AAM orbits, some shots to the stratospheric PV, and a generally amplified ridge near the West Coast and into Alaska. There have also been periods of very little convection in the western/central Pacific and lower AAM when Indian Ocean forcing has dominated, during which we’ve generally seen the stratospheric PV strengthen with the Pacific pattern turning less conducive for cold weather in the central/eastern U.S.
The NAO has been variable and overall somewhat positive, though a period of –NAO in late November contributed to a Miller B off the northern Mid-Atlantic coast to start December that brought wintry weather from parts of PA and NJ into New England, and while an ongoing –NAO is temporarily staving off a significant Pacific-side-induced warmup. The NAO was staunchly positive for much of early-mid December. The AO has also been quite variable, with at least some of that variability tied to the evolution of the stratospheric PV.
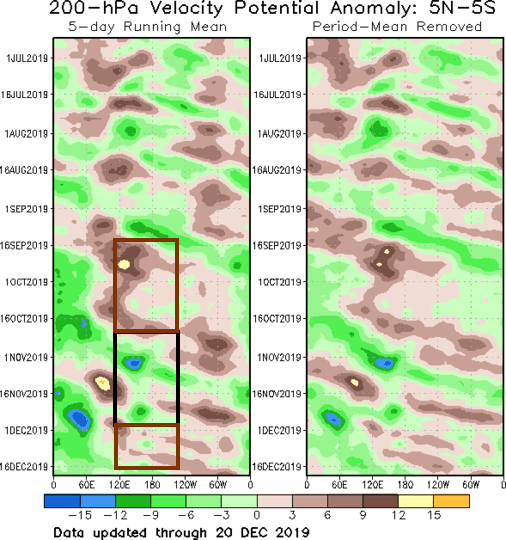
We’ll start by looking at the analyzed 200mb velocity potential anomalies…the strong positive Indian Ocean Dipole is a constant feature, with uplift over the western Pacific much more variable. There was a distinct lack of Pacific forcing from mid-September through much of October, generally more forcing for most of November (though even then, it waxed and waned a bit), and then generally less during the first half of December.
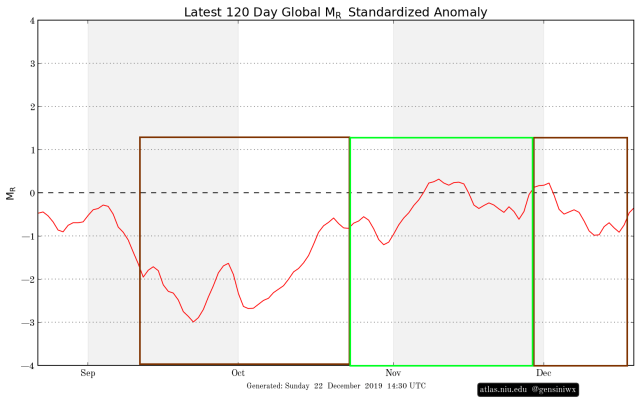
I’ve marked the periods of relatively inactive/active western Pacific convection on a plot of the overall global AAM anomaly over the last 120 days…note how generally, lower AAM has occurred when convection is quieter over the western Pacific, and higher AAM occurred when convection was more active over the Pacific. There are other factors influencing momentum, such as mountain and frictional torques, and positive East Asian mountain torque events occurred in early November, and again in late November/early December, helping to add momentum. Mountain torques are currently negative.
The generally more amplified Pacific pattern that has occurred during periods of more active western Pacific convection and higher momentum has featured a more +PNA/-EPO, and has also favored disruptions to the stratospheric polar vortex. The opposite has been true during periods of less western Pacific forcing/lower momentum, and this general evolution is clear when looking at the evolution of the annular mode/zonal wind anomalies with height since late October:
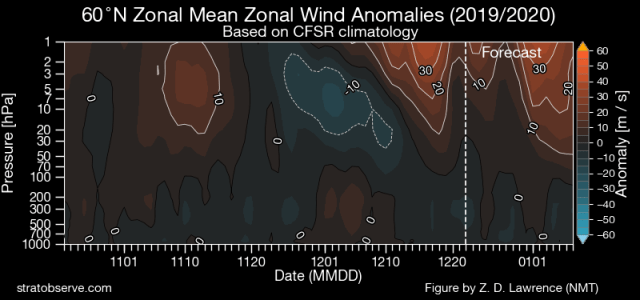

On both charts, warm colors indicate a stronger polar vortex/annular mode/Arctic Oscillation. Note how during October and the first half of November, following a prolonged, deep period of low momentum and little western Pacific forcing, the strat PV intensified quicker than average. However, the period of increased Pacific forcing and higher momentum in November resulted in an amplified/blocky tropospheric pattern that favored disruptions to the stratospheric PV. These disruptions weakened the stratospheric PV in late November and early December, with that weakened PV/stratospheric -AO downwelling into the troposphere in mid-December and contributing to the recent shot of colder weather in the Northeast U.S. It should be noted that any vortex disruptions/warmings were considered minor, but it’s cool to see the troposphere -> stratosphere -> troposphere interaction on the above graphics, and tie it back to other processes (tropical forcing/AAM).
The recent period of a lack of Pacific forcing and lower AAM has again resulted in a strengthening vortex, with no sign of significant disruption into the start of the New Year.
Based on all of this, it’s possible that both camps in the little Twitter/forum disagreement about the AAM/stratosphere have merits to their argument. There have been periods of a lack of Pacific forcing and low AAM that have resulted in a stronger strat PV…there have also been periods of more notable western Pacific forcing, relatively higher momentum, a more amplified tropospheric pattern and resultant disruptions to the stratospheric vortex. At this point, I’d say the former has outweighed the latter over the course of the last few months, though both have occurred at times.
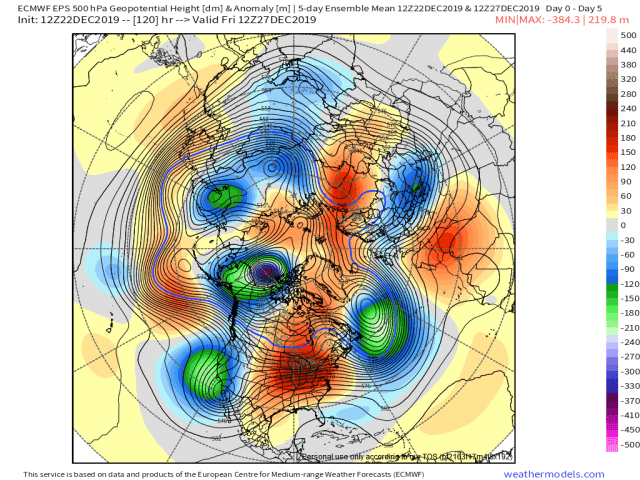
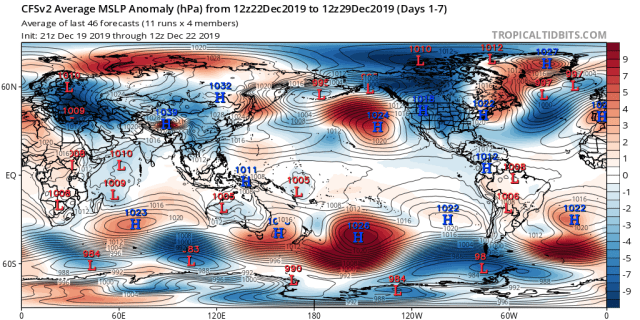
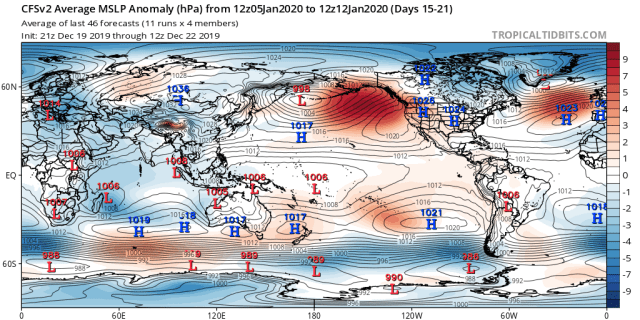
We’re getting our annual Christmas “torch” this week, mostly driven by a very poor pattern on the Pacific side…the PNA is negative with a strongly positive EPO as a large tropospheric polar vortex (TPV) anomaly sinks into Alaska. There is enough of a –NAO to induce confluence just east of New England, which keeps the warmest surface temperature anomalies west of the East Coast. Regardless, this isn’t a good pattern for snow for anyone in the central or eastern U.S.
 ‘
‘
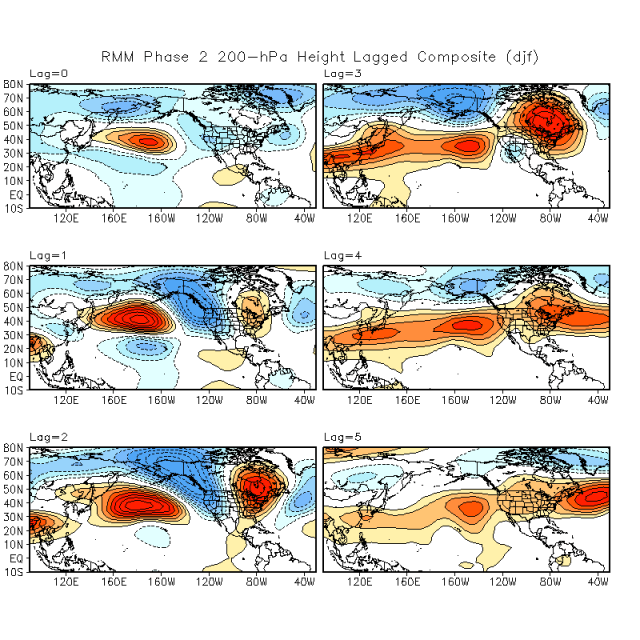
As mentioned above, Indian Ocean forcing has largely dominated this month as a coherent MJO constructively interfered with the uplift over the western Indian Ocean that has been in place all fall due to the strong +IOD. This registered as a prolonged phase 2 RMM, moving into phase 3 after mid-month. The lagged phase 2 RMM composites for DJF show a propensity for much lower heights from AK down the west coast, as we’re seeing now, especially at lags 1-4. Each lag corresponds to about 5 days:
The phase 3 composites show a similar pattern, except moved up roughly 1 lag:
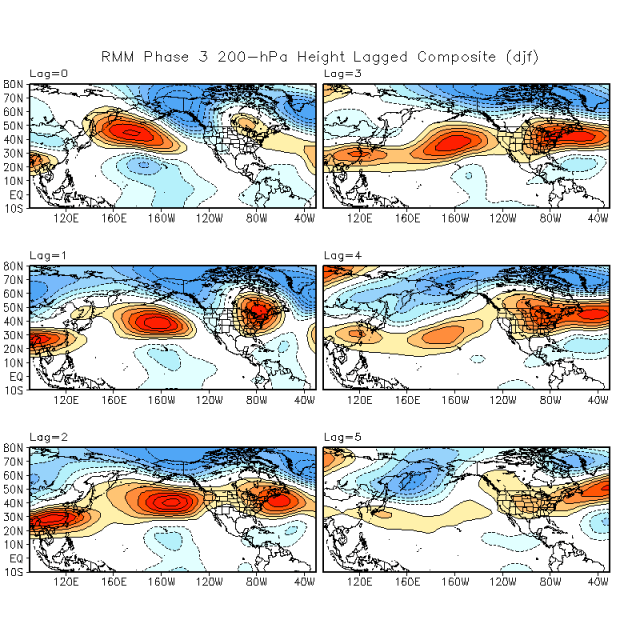
These lagged composites do show a strongly +NAO and AO, which does not match what we’re currently seeing. So, it’s likely that a combination of the Indian Ocean dominated forcing and low momentum has resulted in our very poor Pacific pattern, while the lingering effects of the late-November/early-December minor stratospheric warming along with other, smaller-scale features (such as cyclonic wave breaking over the NW Atlantic) are still influencing the pattern over the high-latitudes and Atlantic. The ultimate result is the torch isn’t quite as torchy for the East Coast, but both factors are worth consideration moving forward.
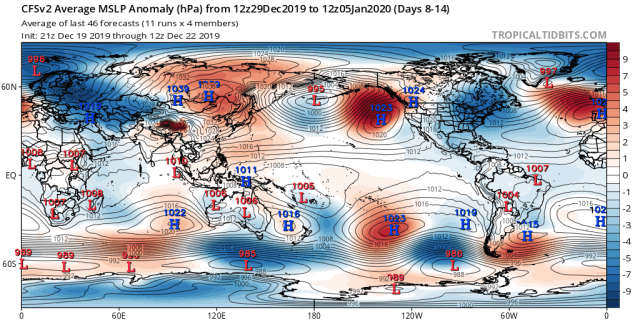
Moving forward, the easiest ways to dislodge the TPV anomaly over AK and overall unfavorable Pacific pattern are to bring a return of forcing to the western Pacific and to increase the AAM. Both start happening soon, but I’m not sure how much I want to rush this pattern change given 1) how long the phase 2-3 lags take to become more favorable 2) the strength of the TPV anomaly over AK and 3) how the lower AAM state with dominant western IO forcing has been the “base state” (though as November/early December showed, are not as overwhelming as they were earlier in the fall).
I’ll try to tackle the convection/tropical forcing portion of this equation first:
As the longer-running 200mb VP anomaly time-longitude plot above showed, we have recently seen a notable uptick in convection/forcing over the western Pacific. Another area of enhanced lift is approaching the central Indian Ocean, though is not quite as convectively active currently.
Multiple sources suggest that the activity over the Pacific right now is associated with higher-frequency forcing, while the activity over the Indian Ocean is associated with the slower-moving and more coherent MJO.

Carl Schreck’s 200mb chi anomaly plots suggest that the MJO is still over the central Indian Ocean, and that the current uptick in western Pacific convection is as a result of an Equatorial Rossby wave and perhaps a convectively coupled Kelvin Wave juxtaposed over the lower-frequency uplift over the western Pacific. These plots suggest the MJO emerging over the western Pacific during the second week of January, when the MJO itself may then constructively interfere with western Pacific warm pool uplift.
Mike Ventrice’s analysis plots also suggest the MJO is still somewhere over the Indian Ocean, with the bulk of the forcing over the Pacific a result of higher frequency processes. Along with the forecast plot two images up, the EPS, via multiple different plots, suggests the MJO emerging over the western Pacific during the first half of January:
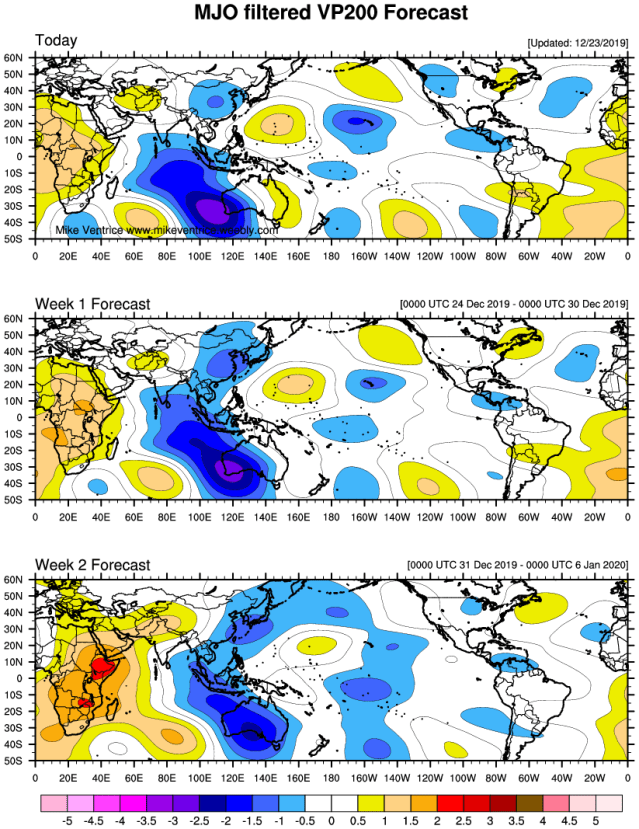
Mike Ventrice’s EPS plots clearly show a coherent MJO progressing east, slowly, across the eastern Indian Ocean and Maritimes over the next two weeks. As this occurs it will destructively interfere with the subsidence from the +IOD, so it will not be that convectively active.
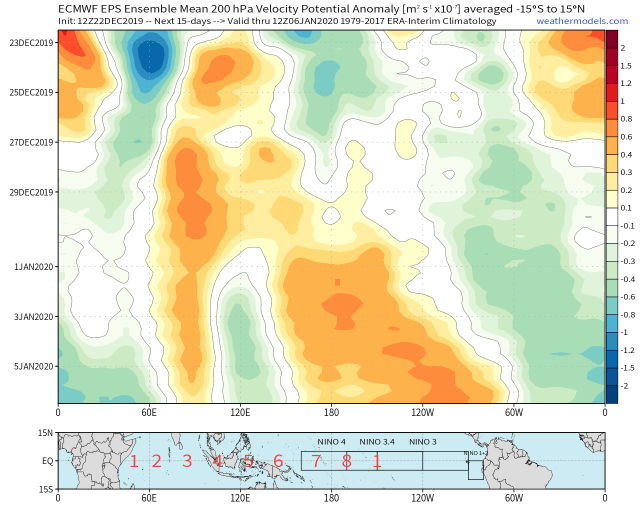
The Weathermodels VP anomaly charts also show a more coherent, slowly-propagating area of uplift emerging east of the subsidence in early January, and moving towards the Pacific, jiving with both the CFS forecasts above and Mike Ventrice’s plot.
The multiple sources for lift and convection are likely causing the strange RMM behavior on the models over the next two weeks…there’s the shorter term western Pacific forcing from higher-frequency processes (that are resulting in more convection than the actual MJO over the Indian Ocean), with the MJO then emerging in the western Pacific likely during week 3, around or just after the end of these plots. That would likely result in a more coherent RMM propagation in early-mid January.
Based on generally weaker convergence over the western Indian Ocean, along with strengthening convergence over the central Pacific, it seems that the +IOD is slowly losing its dominance while Pacific forcing is gradually starting to take hold. Given the waters over the western Pacific being warmer than average and the lower stratosphere remaining colder than normal over the tropics for the foreseeable future, it seems distinctly likely that once the MJO reaches the western Pacific during the first half of January that it becomes quite convectively active and propagates coherently through phases 5-8. While some affects from the +IOD will remain, I don’t think they’ll be able to dominate as much as they did in the fall. This has been my feeling for a while, though the general progression is a week or so slower than my thoughts in late November, which will likely slow the pattern’s evolution somewhat in January compared to my prior thoughts. As I mentioned in my last very long post, MJO propagation through the western and central Pacific tends to lead to blocking down the road at increasingly short lags from phases 4-8…for perspective, here’s phase 6’s lagged composites, where we may be somewhere around January 5-10th:
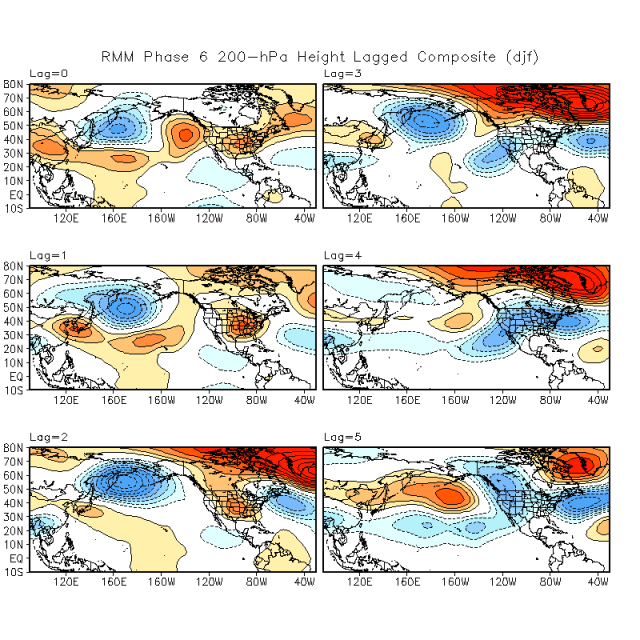
So, tropical forcing should lend itself to a more favorable pattern for high-latitude (in particular, Atlantic) blocking during the second half of January, though the current convection over the Pacific is from higher-frequency forcing and may not have as significant of an impact in early January.
In terms of AAM/mountain/frictional torques…using the CFS for time/simplicity’s sake, though it’s not completely different from the EPS over the next two weeks…
There will be a very brief, weak +East Asian Mountain Torque during week 1 (so brief it doesn’t really show up in the mean forecast for the entire week on the CFS), a –Rocky Mountain Torque, and probably a modest increase in Frictional Torque due to the somewhat lower pressures just west of the Dateline than what we’ve seen. Overall, this will (and already is starting to) result in a very brief, modest increase in AAM…but not enough to really shake things up.
The CFS and EPS both have a much more substantial +EAMT during the first week to 10 days of January. This would add a more significant amount of momentum.
During week 3 the EPS and CFS suggest the +EAMT weakens (though does not turn as negative as it has recently been), though lowering pressures over the western Pacific likely result in some increase in FT. The CFS suggests a +RMT in week 3 as cold air descends east of the Rockies, though the EPS is more persistent with the +EPO and likely would maintain a –RMT in week 3.
The CFS and EPS weeklies both hint at a potentially more significant +EAMT in late January while FT remains positive.
In general, it seems like AAM will increase modestly this week but likely remain slightly negative through the end of the year…however, I think between an increase in FT and a strong +EAMT during the first week of January that we will see the AAM go modestly positive in early January. With FT increasing as lower frequency forcing returns to the Pacific and no signs of a prolonged –EAMT through January, along with some potential for RMT to increase if we develop a –EPO, the AAM will likely be neutral to modestly positive through much of January, with some potential for a more bonafide positive orbit the last week of January into early February.

As alluded to above, the stratospheric PV is intensifying after the displacement event earlier this month. The GEFS and EPS suggest a pattern the last couple days of December that may yield some disruption in early January, with hints of a stronger Aleutian low for a brief time along with a Scandinavian ridge. The Euro does show the first hints of some minor warming in early January. However, the pattern thereafter at the end of the EPS does not look conducive to further warming. The CFS, above, shows some modest weakening to the strat PV in early January, but has incredible spread thereafter, with a few members showing a more significant weakening in mid-late January while a larger portion intensify the vortex further. The anticipated propensity for more Pacific forcing by mid-January, and likely somewhat higher AAM state, may argue against the vortex continuing to intensify through mid-January, but it’s difficult to anticipate a significant warming event anytime soon.
Trying to sum it up…
The tendency this fall/early winter has been for a +PNA/-EPO to occur when there’s forcing over the western or central Pacific along with a relatively higher (near neutral or weakly positive) AAM…however, Indian Ocean forcing has been more dominant at times, resulting in multiple prolonged periods of limited/no Pacific forcing and lower AAM. One such period during most of December has resulted in our current +EPO/-PNA, lower AAM pattern along with a strengthening stratospheric PV.
A strong +EAMT in early January will attempt to amplify ridging towards Alaska…however, the current high-frequency forcing in the Pacific will dwindle by early January while the MJO remains over the eastern Indian Ocean. Along with the strong TPV anomaly currently over Alaska being tough to displace, this all will likely slow the flip to a much colder pattern in the CONUS. The AO should trend positive in early January beneath the intensifying strat PV, and the NAO also looks to trend positive too. So, we will need to rely on the Pacific side for cold. I do think we see a cool down over Canada in early January as the cold air with the PV over AK begins spilling southeast, but with a +AO and EPO (at least initially) it will likely struggle to surge south into the CONUS. We may see most of the CONUS average near or above normal for the first half of January with a north-south gradient, with places like the northern Rockies and upper Midwest likely averaging normal or somewhat colder and the STJ perhaps keeping the southern tier from completely torching. It’s not the warmest pattern ever, but with a +AO and EPO to start January it will be tough to see any large-scale negative anomalies over the CONUS for the first 10-15 days of January. Given the location of the PV and overall teleconnections to start January, I think there’s more risk to bust warmer than colder the first 10-15 days of the month…though for now I’m not forecasting a torch by any stretch.
As forcing returns more permanently to the western/central Pacific by the middle of January, I think we can more effectively improve the PNA and EPO and turn colder in most of the CONUS by late January. Increasing frictional torque (and perhaps Rocky Mountain torque) should make up for a likely downturn in East Asian MT around mid-January, keeping AAM from returning to negative values that dominated much of December. If East Asian torque increases more substantially again in late January as the CFS and to some extent the EPS weeklies suggest, the AAM may turn more significantly positive. If this occurs quickly enough, it may combine with any PV disruptions that occur in early-mid January for a more noteworthy weakening of the strat PV in late January. This could combine, along with the MJO progression I expect through early-mid January, to drop the AO and NAO late January into February.
In general, the pattern we’ve been in for the last few months with a tendency for amped ridging into the EPO region whenever we see an increase in Pacific forcing and AAM can be good for the central and eastern U.S., but we have gotten away from that recently and it likely won’t return immediately in early January. If this pattern continued through the winter, a 13-14 or 14-15 type look where we see PNA/EPO induced cold with less NAO help is doable. Assuming Indian Ocean forcing doesn’t overwhelm again for any extended periods and the strat PV doesn’t become too strong, that is a possibility. We have seen a tendency for cyclonic wave breaks and a –NAO over the NW Atlantic at times, and have to assume that without a major shakeup that tendency could return in later January/February when the tropical forcing becomes more conducive, and when the strat PV hopefully weakens a bit.
What I’m saying is for the central and eastern CONUS, we don’t need a significant strat warming event for a decent second half of winter in the central/eastern U.S. (the UK may be a bit different), as long as the vortex doesn’t remain uninterrupted well into January. A SSW would likely shake-up the pattern if it occurred, perhaps bringing a temporary +AO and warmup when it occurred followed by an increased risk for a –AO and –NAO. This currently seems less likely to occur, but given signs that the tropical forcing and AAM may become more supportive of disrupting the strat PV during the month of January, it’s something that can’t be at all ruled out. A SSW would change the evolution of things from late January through March, and I don’t want to speculate on how until one appears more probable.
