It’s past November’s midpoint, so I’m clearly late to the party with this more technical write-up on what I think will happen this winter. My thoughts to date have been posted by me at times on weather forums and hinted at on Twitter, and my employer has also posted a couple of YouTube videos…but, this is the first time I’ve been able to fully sit down and write everything down. Given how late it is, my thoughts have evolved some from October.
This write-up will have 3 sections of discussion and then finish with the actual forecast. I’ll go through the drivers heading into the winter and what they may mean, some analogs based on said drivers, and also the recent / current pattern, how that may move forward and how that compares to some of the analogs.
Since I understand some people just want the maps, I will post them first, but the fun obviously comes from the write-up 😉
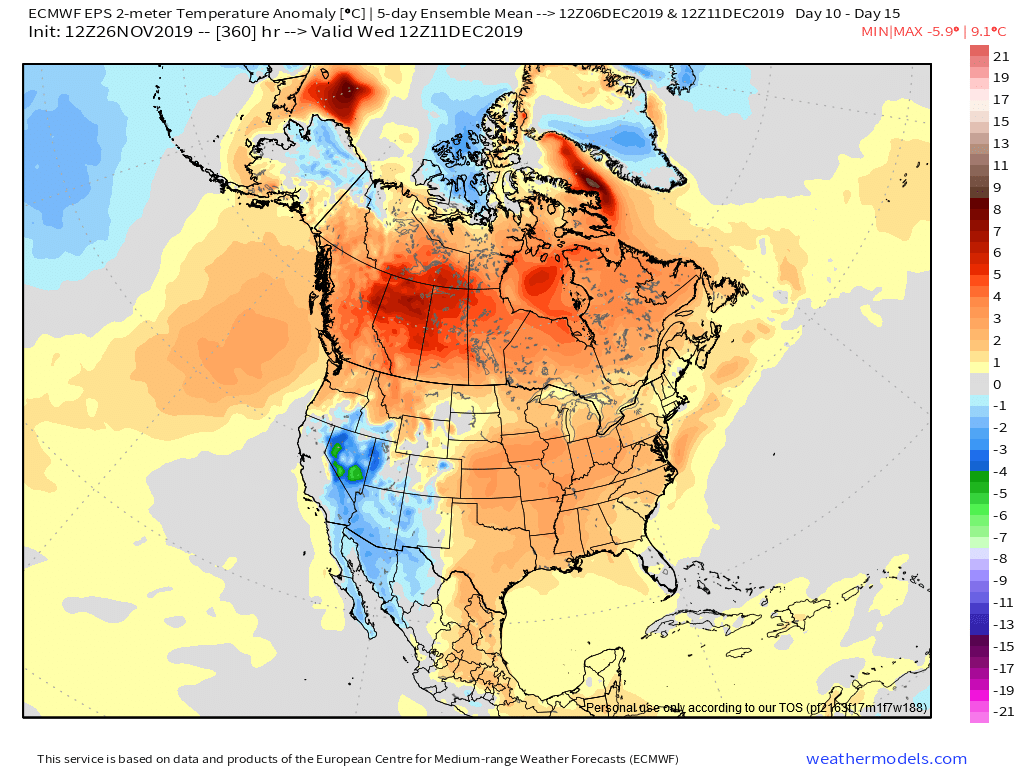
December temperatures:
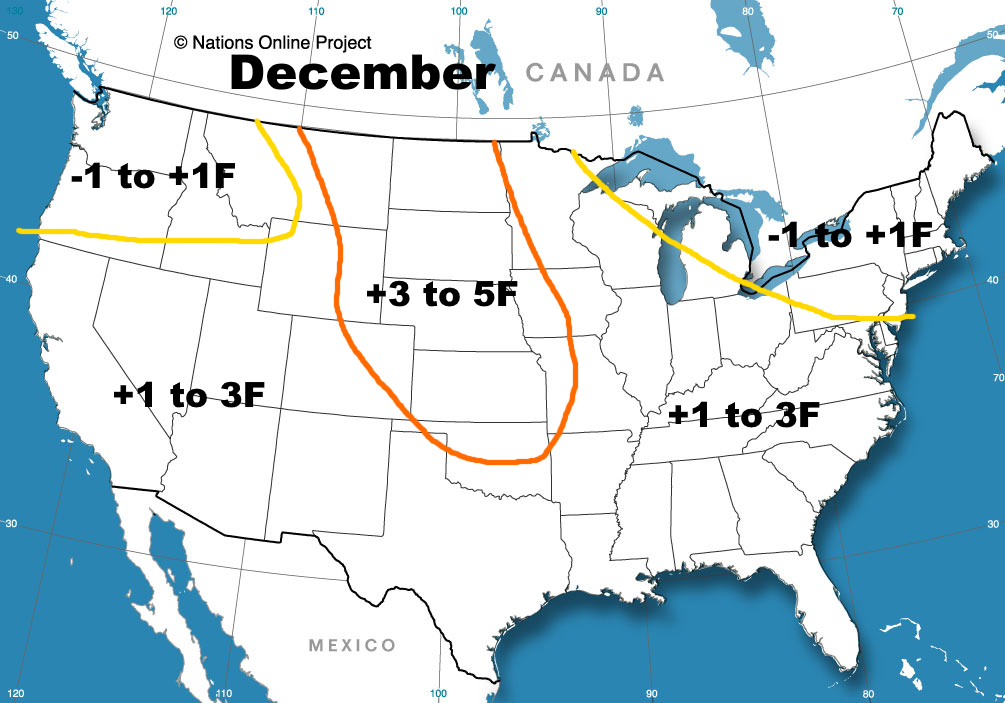
Please note that I expect a week or two of normal to below normal temperatures in the Great Lakes, Northeast, and perhaps Ohio Valley and Mid Atlantic, along with windows where snow is possible, despite the overall mild temperatures in December.
January temperatures:

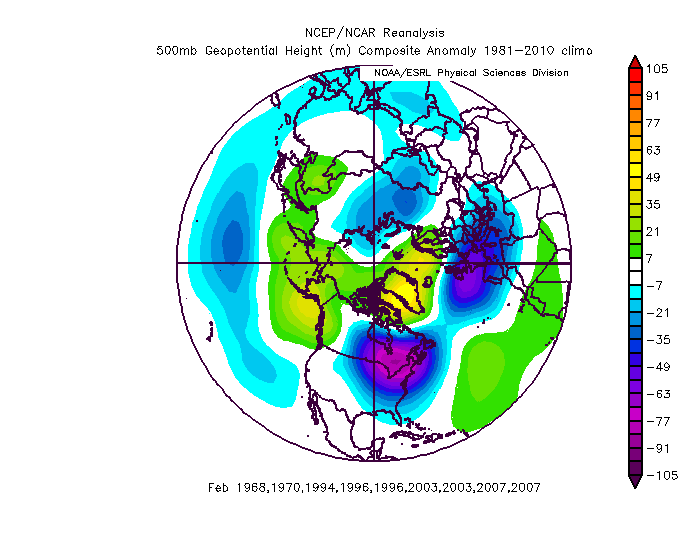
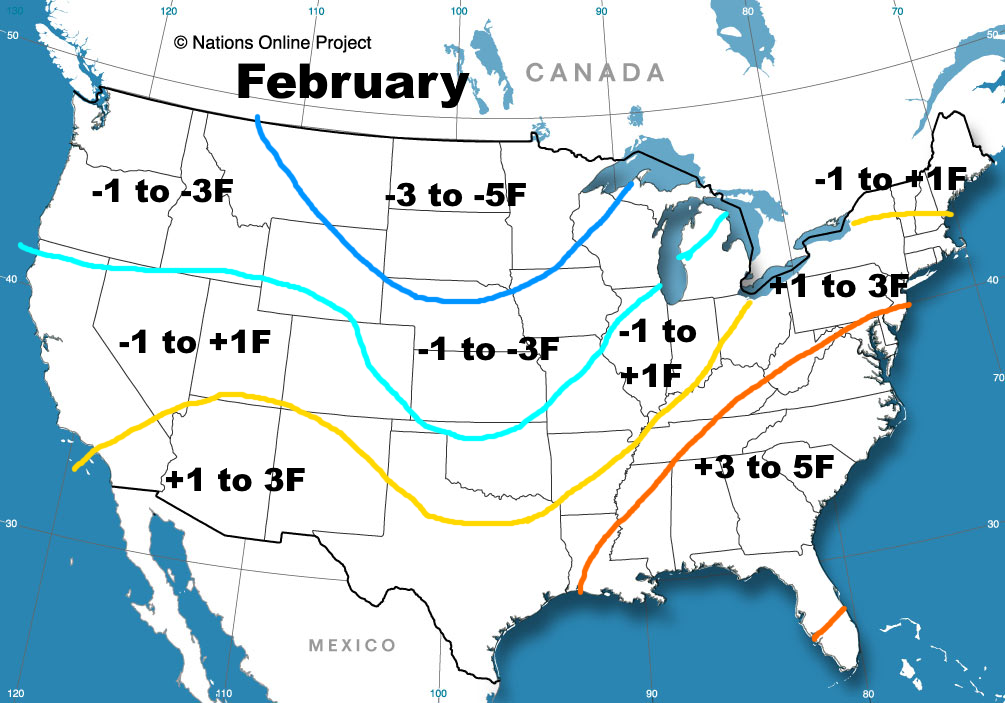
February temperatures:
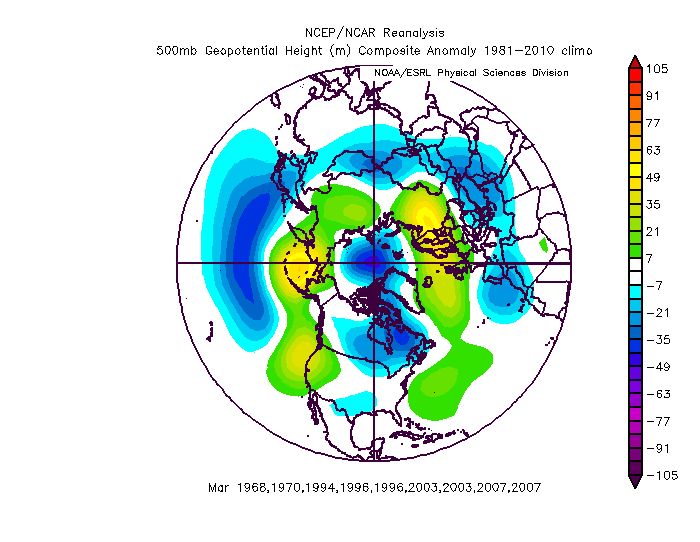
March temperatures:

Total seasonal snowfall (including what’s already fallen, where applicable):

Potential Drivers This Winter:
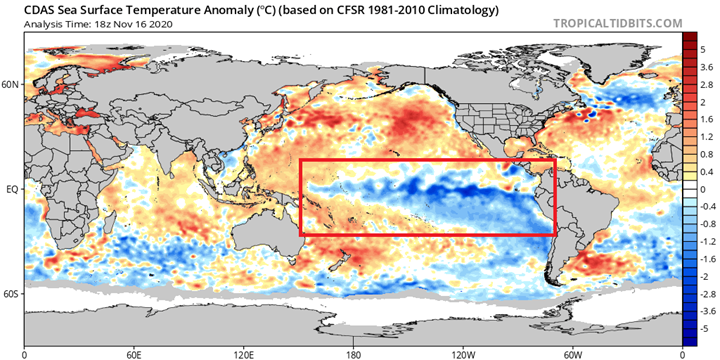
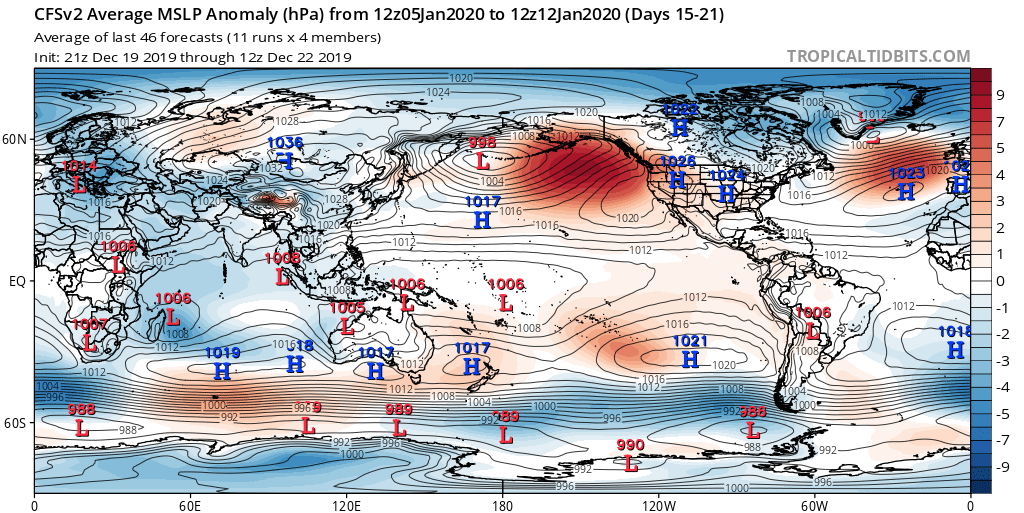
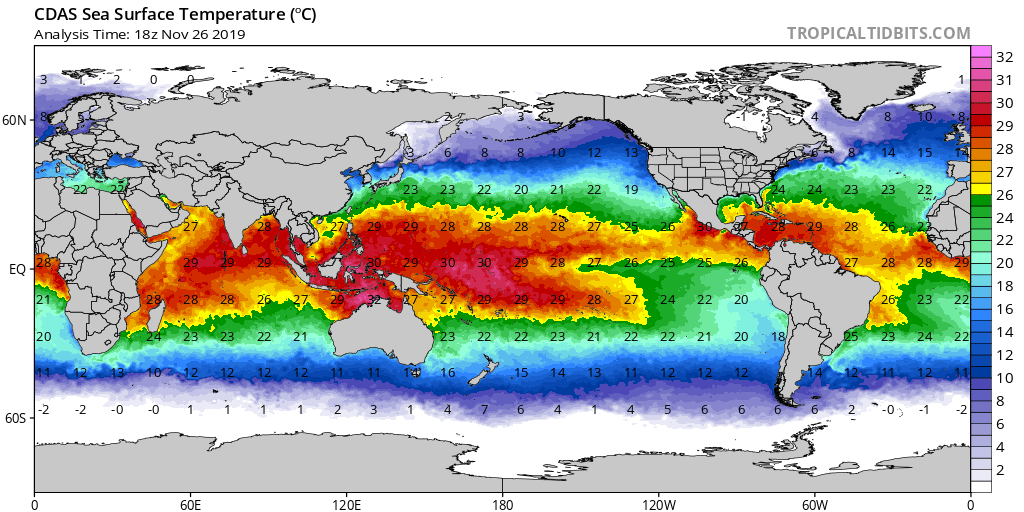
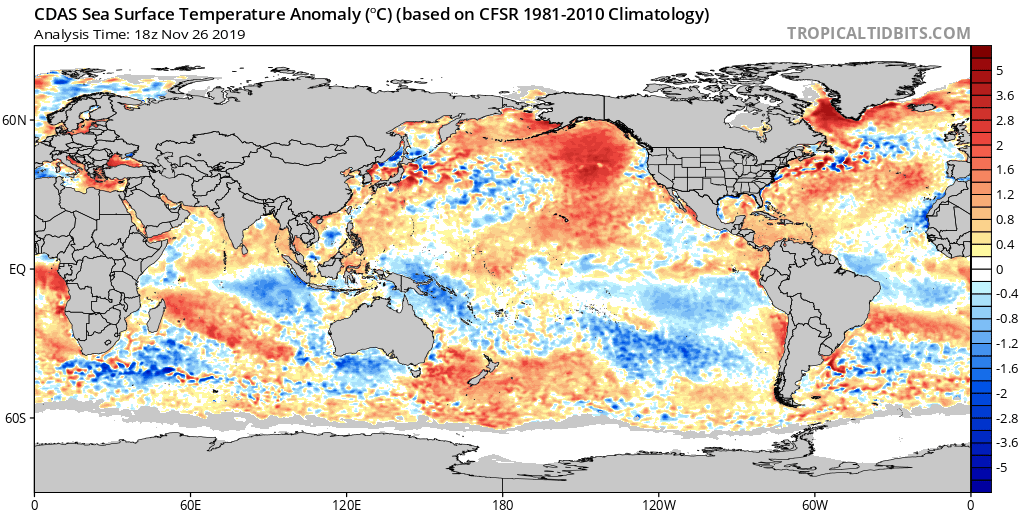
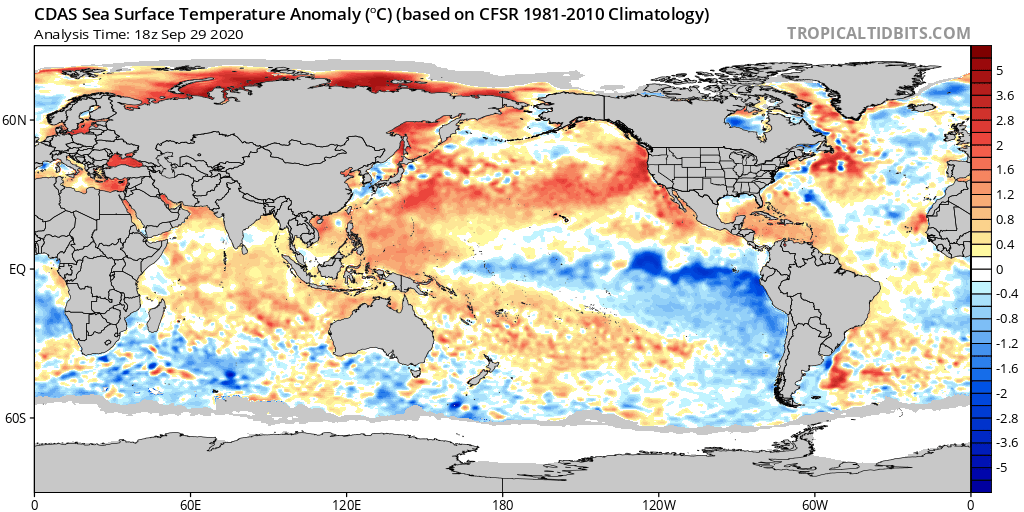
Plot from: tropicaltidbits.com
We’ll start with the moderately strong La Nina event across the Pacific. This developed over the summer and has strengthened through the fall, and the atmosphere has clearly responded. The La Nina is currently moderately strong and will likely be at moderate to borderline strong strength for the winter.
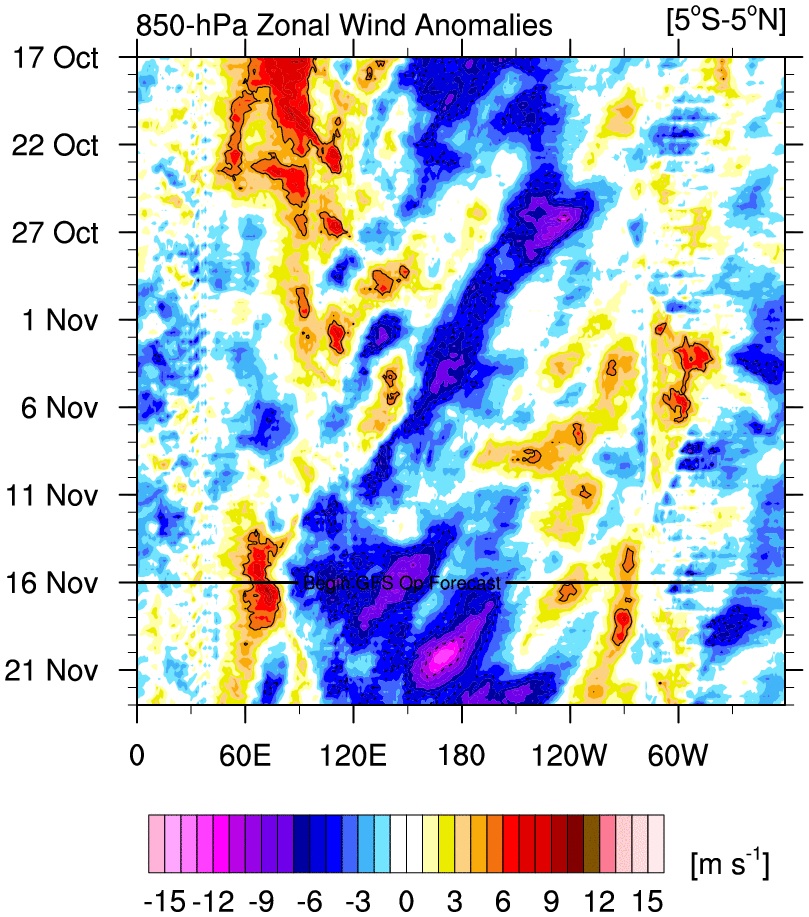
Plot from: http://mikeventrice.weebly.com/
A recent weakening of the trade winds has allowed for both the surface and sub-surface to warm slightly, however, most guidance suggests another period of strong trade winds developing the rest of this month and into early December, which likely will result in further cooling.

Plot from: https://www.cpc.ncep.noaa.gov/
Despite a little bit of recent warming, it is still quite cold below the surface across much of the Pacific, particularly east of the Dateline. Another period of enhanced trades would result in upwelling and notable surface cooling into December. Various models depict more strengthening into early-winter and suggest that a strong La Nina tri-monthly peak may still be in play, though the modest warming this month will probably make that difficult to pull off. Most guidance shows the La Nina peaking in intensity in December and then beginning to weaken:
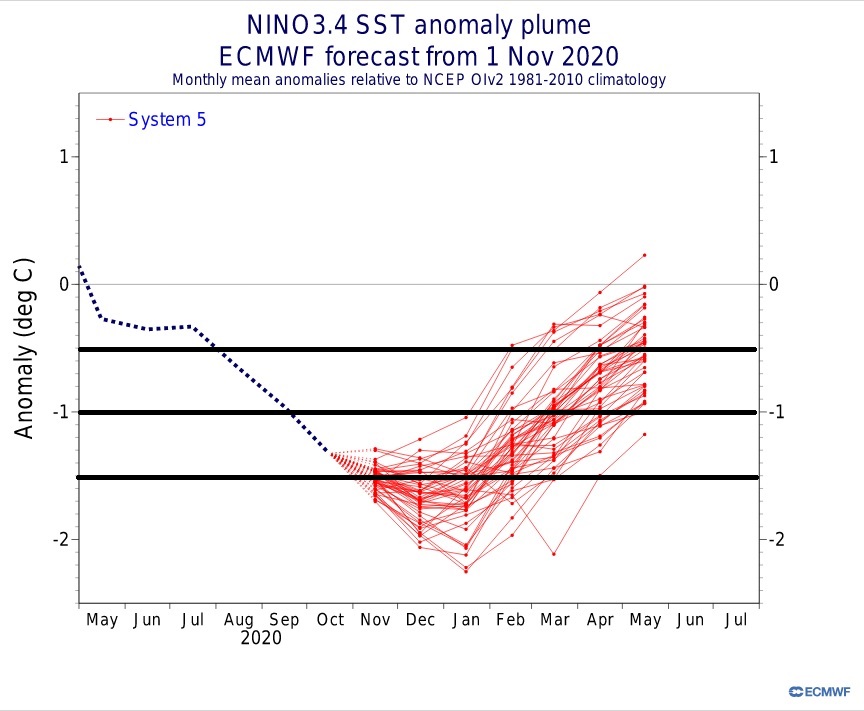
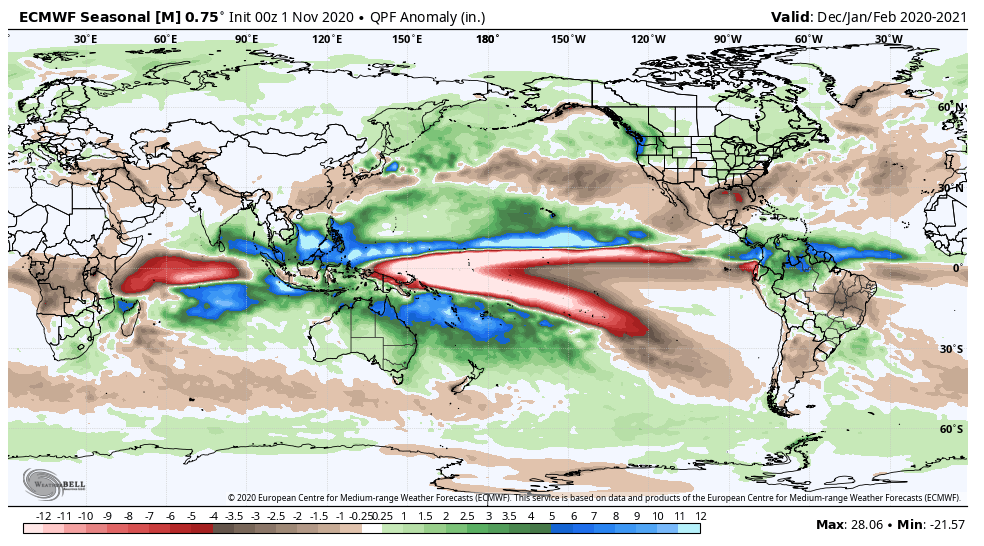
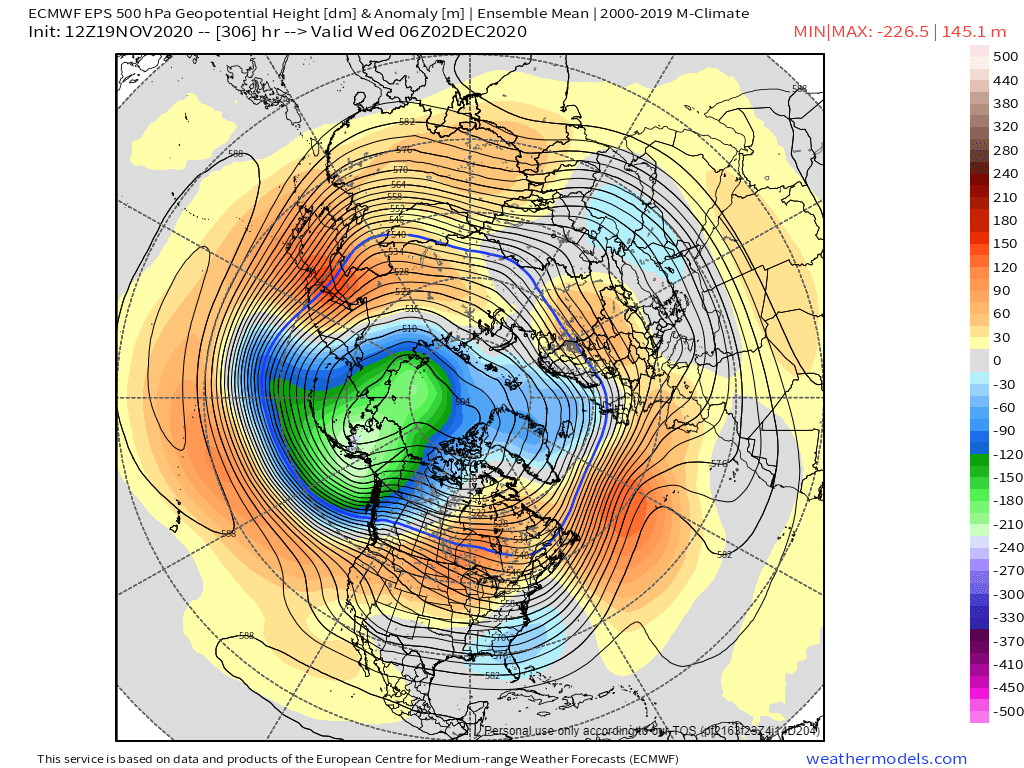
Plot from: https://www.ecmwf.int/en/forecasts

Plot from: https://iri.columbia.edu/our-expertise/climate/forecasts/enso/current/
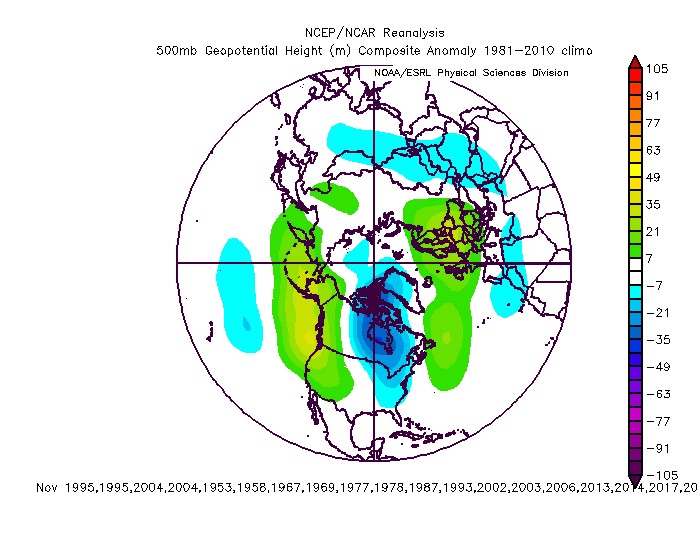
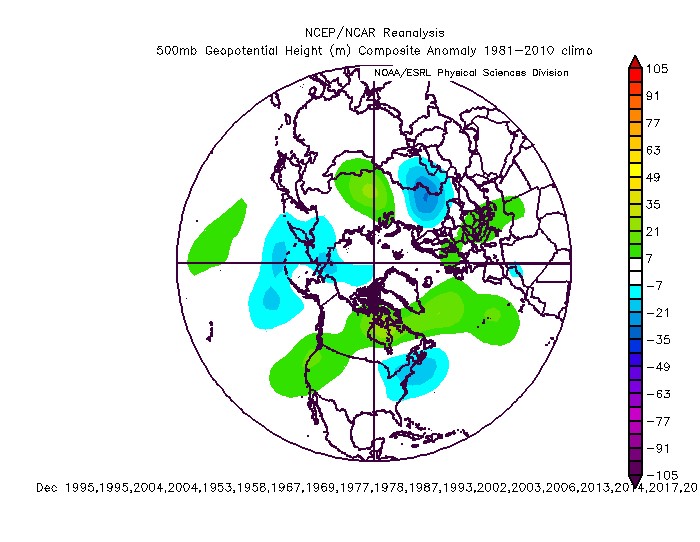
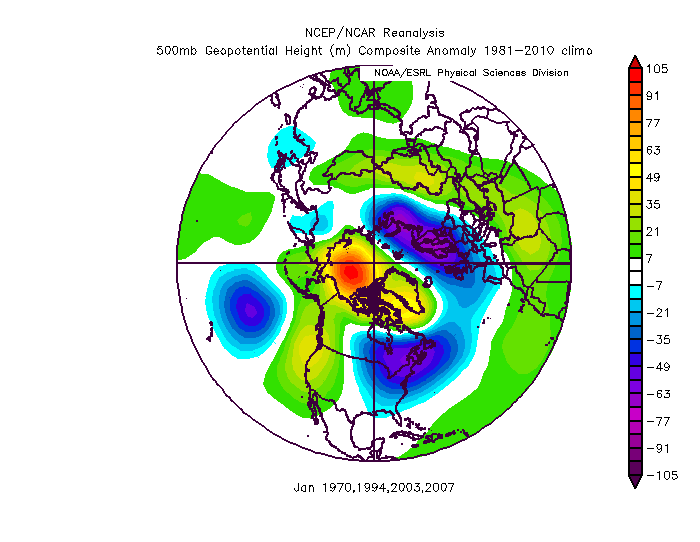
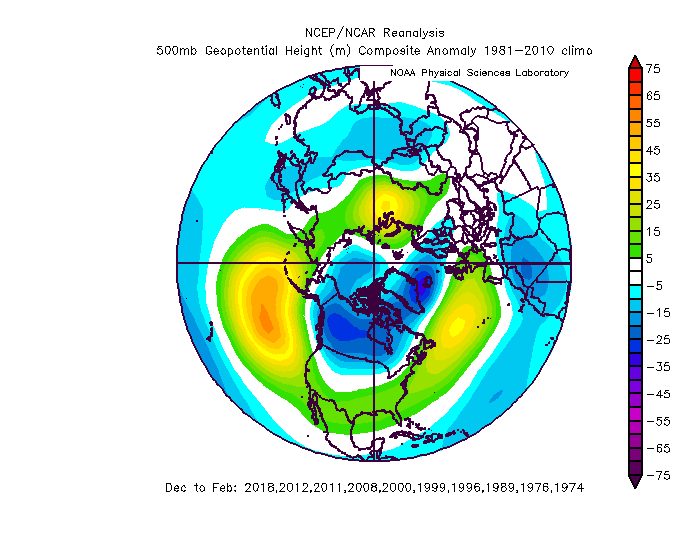
So, let’s start with the La Nina…here’s what the last 10 have gotten us when averaged together:


Gee thanks for nothing La Nina. Except for 10-11 and 17-18. Those are kind of OK. The last 10 Ninas, on average, fit the stereotype of starting colder than they end for the eastern U.S.:


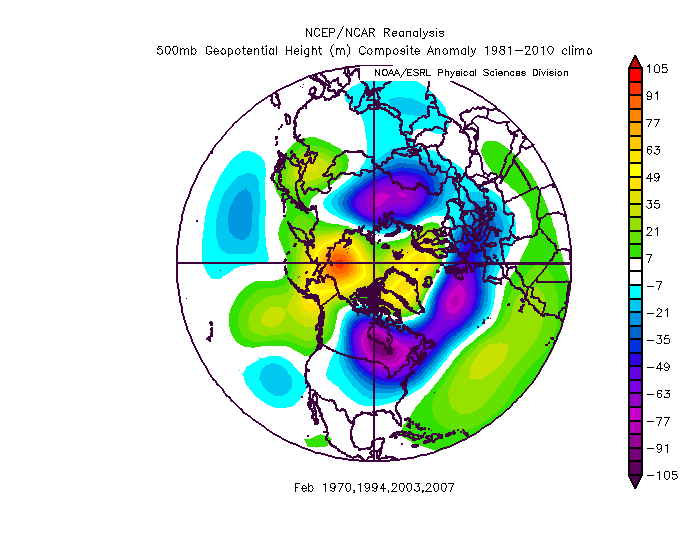
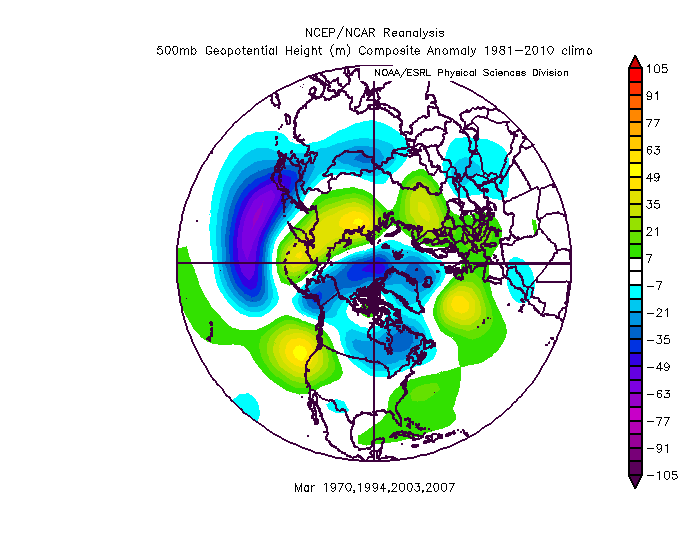
The last 10 moderate-strong La Ninas only are similar for the winter as a whole, though are a little uglier in the NAO and EPO domains:
There were a couple of fairly good winters in there, and even some of the duds had brief but intense cold shots…though on the whole they’re not great.
In general, La Nina winters feature a stronger stratospheric polar vortex and limited high-latitude blocking, with the signal stronger in moderate to strong events with a +AO, NAO, and EPO on the above composite. There are a few exceptions, even with moderate to strong events, but with all else being equal they are not more supportive of high-latitude blocking than a neutral or warm ENSO.
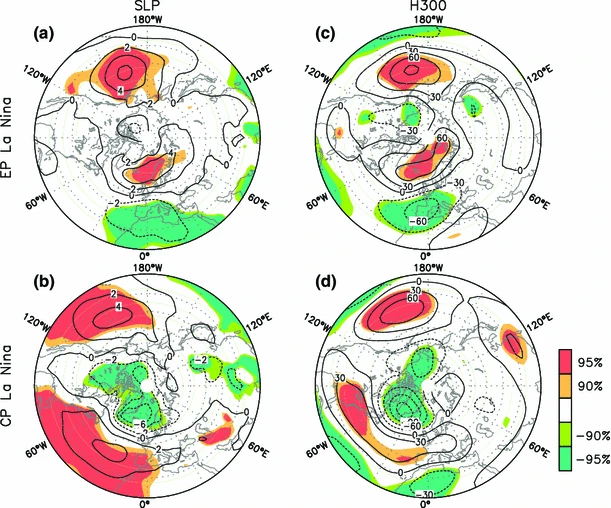
With that said, where the coolest water with the La Nina is associated can make a significant difference. This paper examines different response to East Pacific La Nina events and Central Pacific events:
https://link.springer.com/article/10.1007/s00382-014-2155-z
The tl;dr here is that “East Pacific” La Nina events tend to have a slightly more poleward north Pacific ridge, and more notably, a modest -NAO…as compared to “Central Pacific” events that have a flatter north Pacific ridge, and a +NAO.
The question is, is this event central, eastern, or more basin-wide?
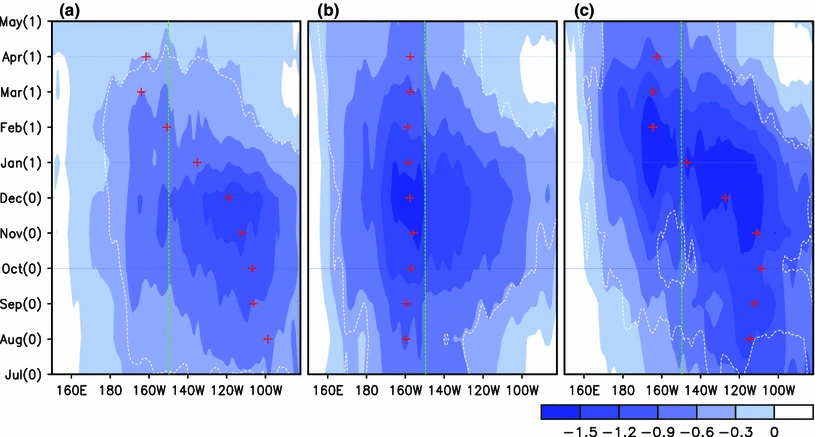
From the same paper, above is the typical SST departures with time in East Pacific, Central Pacific, and hybrid La Nina events. The key difference between eastern and central events is that in eastern events, the cooling originates near South America and propagates west, while in central events the cooling is centered near 150W. Central events also tend to be stronger, though there are exceptions both ways.

Here is this year’s evolution. It’s clearly NOT central Pacific based…and the drift west in SST anomalies is typical of east based events. You can argue that for a time in late-summer, it appeared more centrally based, though it’s been hybrid or east-based this fall. Per the referenced paper, La Ninas don’t switch from EP to CP based (or vice versa) from fall to winter, so I don’t think this event is “becoming central Pacific based”…though you can argue there are some hybrid characteristics, which per the paper can lead to some tendencies of both with regards to the pattern response. This does suggest, at first blush, that we don’t have the “worse” flavor of La Nina and may maintain some hope for the event weakening during the second half of winter.
The mechanism for East Based La Ninas producing a more -NAO is not really explored in the paper. A couple of thoughts are that the low-frequency response is slightly closer to “neutral” conditions in the EP events, as the cooling isn’t as far west. Other research (that I’ll reference later) suggests that La Ninas in general don’t have as robust of a blocking response to the MJO as El Nino / neutral ENSOs do. Another thought is that the MJO may be more active into the western Pacific during EP events than during CP events. The paper did present rainfall rate anomalies in CP and EP events:

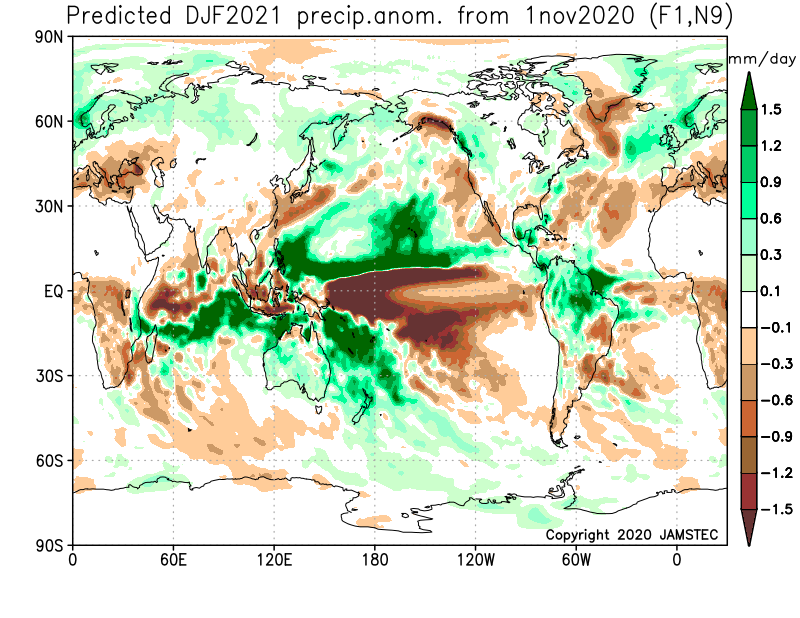
The CP events (B) have a stronger negative precipitation anomaly that is centered farther west, focused at or just west of the Dateline. The EP events have a weaker anomaly centered slightly farther east, closer to neutral years, perhaps muting the effect La Nina has on dampening the MJO into the western Pacific somewhat and allowing for more blocking to result. In a somewhat concerning trend, most of the seasonal models, that overwhelmingly have a +NAO for December-February and in some cases have a flatter north Pacific ridge, all have precip anomalies for the winter that look more like a CP event:
The JMA:
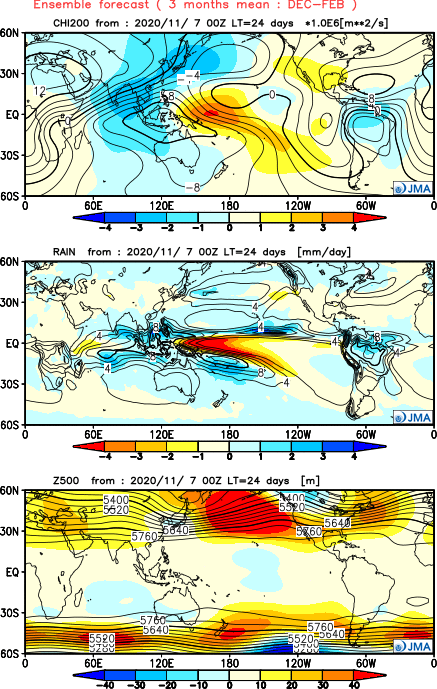
Euro:
Jamstec:
And the CFS:
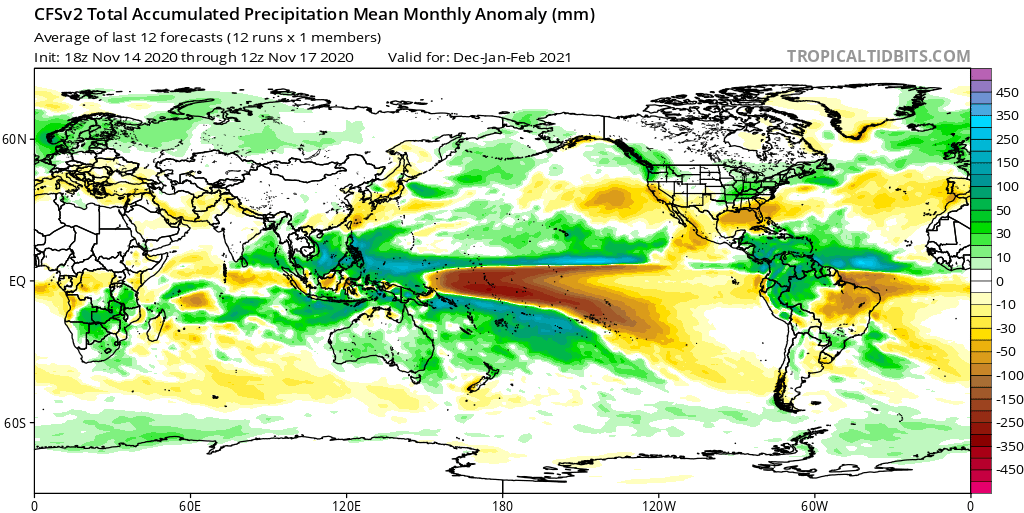
This has been consistent on the majority of seasonal model runs for the last few months. This could be a red flag that despite the SST profile clearly not behaving like a CP event, we may still have a heightened risk for a +NAO (and EPO) for December-February as a whole, due in large part to the response to this La Nina. Or, it could mean the seasonal models are a little too +NAO and warm…hmm.
Other SST Areas of Interest:

1 is La Nina
2 is the Indian Ocean. Last year saw a strong positive Indian Ocean Dipole event, with cool waters near Australia and warm waters closer to Africa. This contributed to convection/forcing frequently sitting over the western Indian Ocean during the fall of 2019 and into the first half of winter, with a dearth of forcing over the Pacific, especially in the critical period when the polar vortex began wrapping up in December and early January. This fall, the IOD is neutral to perhaps slightly negative. This argues for the low frequency forcing centering farther east than last winter, but in tandem with the much stronger La Nina doesn’t necessarily promise that the MJO frequently gets far into the Pacific.
3 is the Western Pacific warm pool…as has often been the case in recent years, it’s quite warm and expansive. This, along with the neutral to weakly negative IOD, does argue for convection getting into the western Pacific and perhaps helping to amp the north Pacific ridge due to enhancing Rossby Wave Trains across the Pacific. As referenced above, if the convection doesn’t wander close to the Dateline, this still may not dump the cold air in where the East Coast wants it on a consistent basis.
4 is the North Pacific…it’s quite warm across the board, but this is a negative Pacific Decadal Oscillation. The warm waters near Japan and cooler waters near the southern Alaskan and western Canadian coast are characteristic of a -PDO, and the short-medium range pattern argues for these anomalies worsening. A –PDO tends to be associated with a weakened Aleutian low and a more negative PNA, which causes troughing to be biased towards the Pacific Northwest.
A note that the off-equator SSTs are quite warm over the central and eastern Pacific (a positive Pacific Meridional Mode, or PMM). This is one of the stronger +PMM events observed during autumn during a La Nina. This may add a bit of kick to the sub-tropical jet over the next couple months.
5 is the northern Atlantic. The SST pattern here has been used, especially more so in the past, to predict the winter NAO. The configuration this spring – now has been slightly more conducive to a -NAO than recent years, with cold waters south of Greenland/Iceland and somewhat “warmer” waters closer to Greenland and Iceland. While not as unfavorable to a -NAO as most recent years, it still is displaced north of where it is prior to -NAO winters, and doesn’t really move the needle in the face of other factors if they support a +NAO winter.
The Quasi-Biennial Oscillation:

Plot from: https://acd-ext.gsfc.nasa.gov/Data_services/met/qbo/qbo.html
The QBO is a typically nice downwelling of westerlies and easterlies in the stratosphere. This is shown on the image above. However, the QBO basically “skipped” the easterly (negative) phase in 2016. After one and a half normal oscillations from 2017-2019, we had an extremely anemic easterly QBO late 2019-early 2020, and will be in a westerly (positive) QBO for the winter.
An easterly QBO tends to favor a weaker stratospheric polar vortex, which can lead to more high latitude blocking in the troposphere, while a westerly QBO tends to favor the opposite. Yes, there are easterly/negative QBO years with limited high-latitude blocking, and westerly QBO years with blocking…and yes, sudden stratospheric warming events (SSWs) can still occur in a +QBO and lead to a weaker polar vortex and increased blocking potential. In fact, per this graphic posted by Dr. Amy Butler on Twitter (@DrAHButler), half of westerly QBO La Nina winters featured a sudden stratospheric warming event (filled circles had a SSW):
This may be a significant wild card this winter, as otherwise, the combination of a La Nina and positive QBO (along with our current, absolutely putrid pattern) favor a strong stratospheric polar vortex, which is less favorable for tropospheric high-latitude blocking. This was a major culprit in the extremely mild winter of 2019-20. I will circle back more to this topic when tying all the drivers into our current / short-term pattern later.
Aside from the typical PV and blocking implications discussed each year, a phenomenon (that I frankly did not notice on my own when I started dabbling in seasonal forecasts) that has gotten increased attention in recent years is the QBO’s apparent influence on the north Pacific ridge in La Nina winters. In general, +QBO winters have a more poleward ridge, while -QBO winters have a flatter ridge (interestingly, EP La Ninas have a more poleward ridge, while CP La Ninas have a flatter ridge).
Here is a look at La Nina winters since 1980, that per a combination of the CPC’s 50mb monthly QBO data the QBO diagram above had a +QBO at or below 50mb through the winter. The most debatable inclusions are 17-18 and 11-12, but both had a positive anomaly at 50mb through at least December per the CPC data and held onto it just below that level through at least February.

Here are the -QBO La Ninas:

And the difference:

The +QBO La Ninas DO have a more positive AO and NAO than the -QBO La Ninas, but the differences in the north Pacific are beneficial for the Northeast U.S. Keep in mind, La Nina strength, location, and other factors are ignored for this exercise and many of these anomalies may not be statistically significant given the somewhat small sample size, but it’s food for thought, at the very least, and has worked more times than not in La Ninas over the last 15 years.
Solar Cycle:
We are coming off of another deep minimum in the 11-year sunspot cycle. Many papers (here’s one I quickly pulled up, though there are more https://agupubs.onlinelibrary.wiley.com/doi/full/10.1029/2005JD006283 ) have found a relationship between the solar cycle and the stratospheric polar vortex strength and tropospheric high-latitude blocking in winter. In general, solar minimums correlate with a weaker SPV and increased blocking, while maximums correlate with the opposite. I’m not going to spend a ton of time on this as I think other factors are already in control, but it was a factor weighed in the analogs.
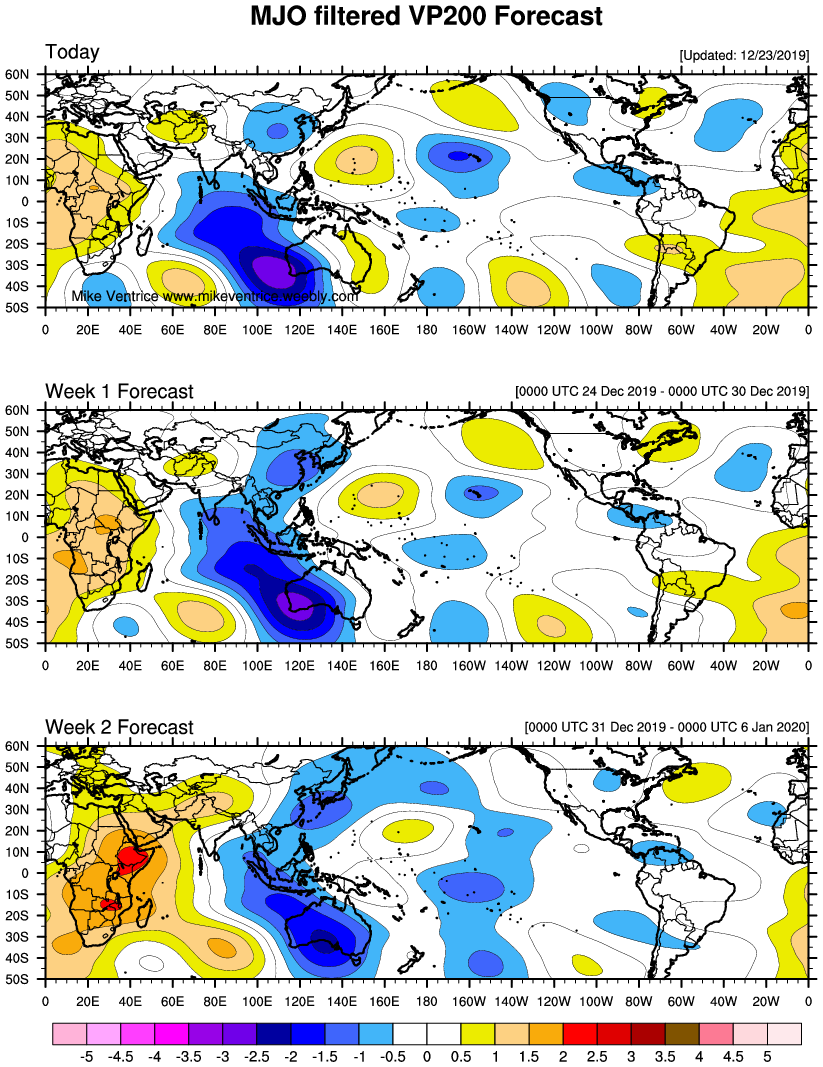
Low Frequency Forcing:
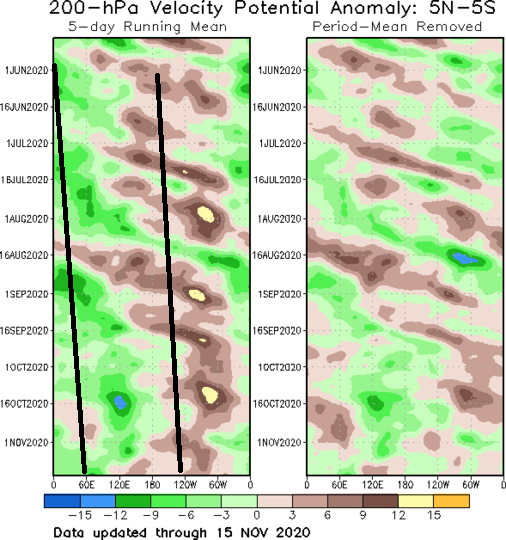
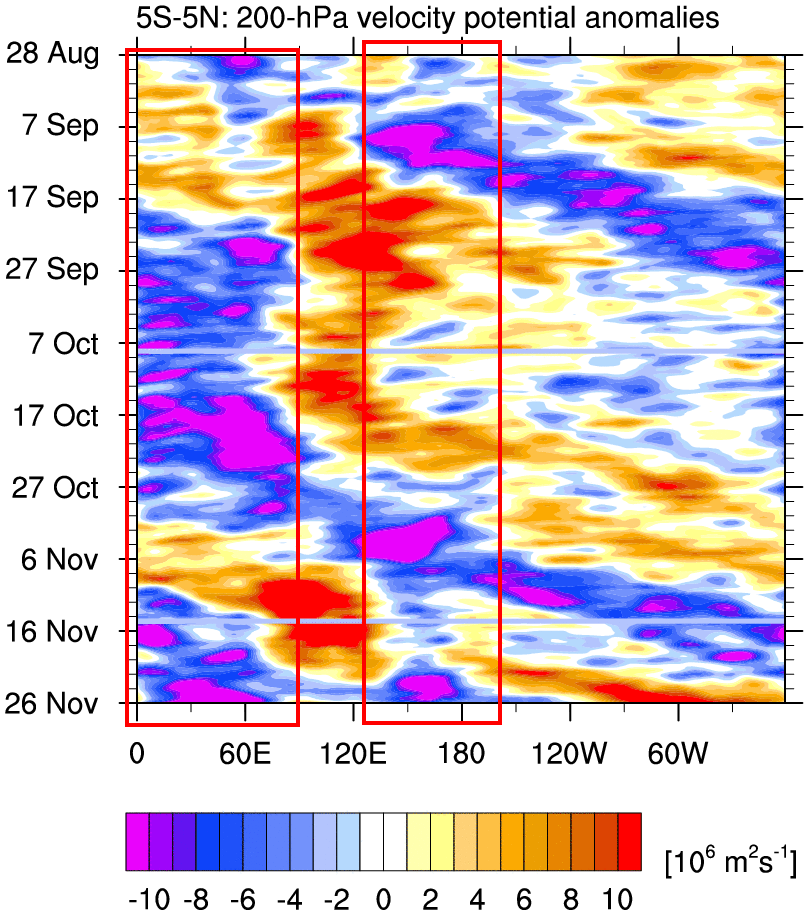
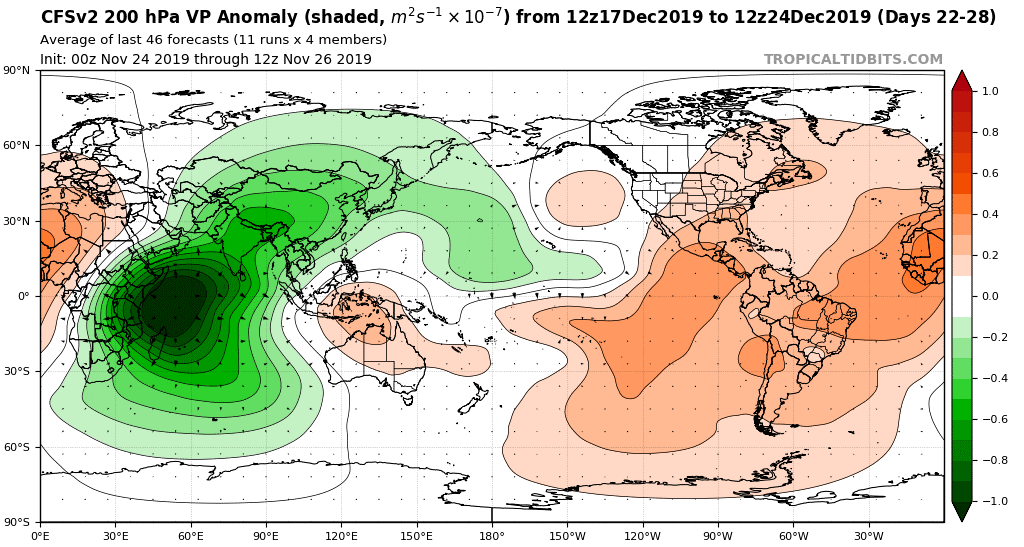
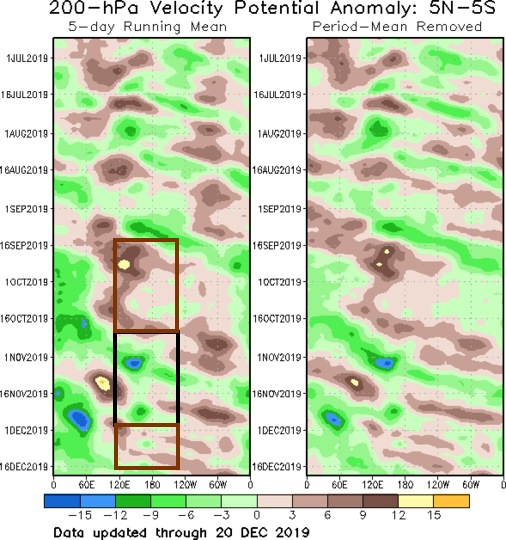
We’ve clearly had a La Nina response to the low frequency forcing this summer and fall, with rising motion over the Indian Ocean and sinking motion over the Pacific. It can be argued the forcing drifted east some over the course of the summer and fall. Another way to visualize this is on a map showing velocity potential from September – November 15:
This shows a similar idea, though do note that the low-frequency forcing is strongest near Indonesia (near 120E). This signal was focused closer to 40E (much farther west) in fall of 2019.
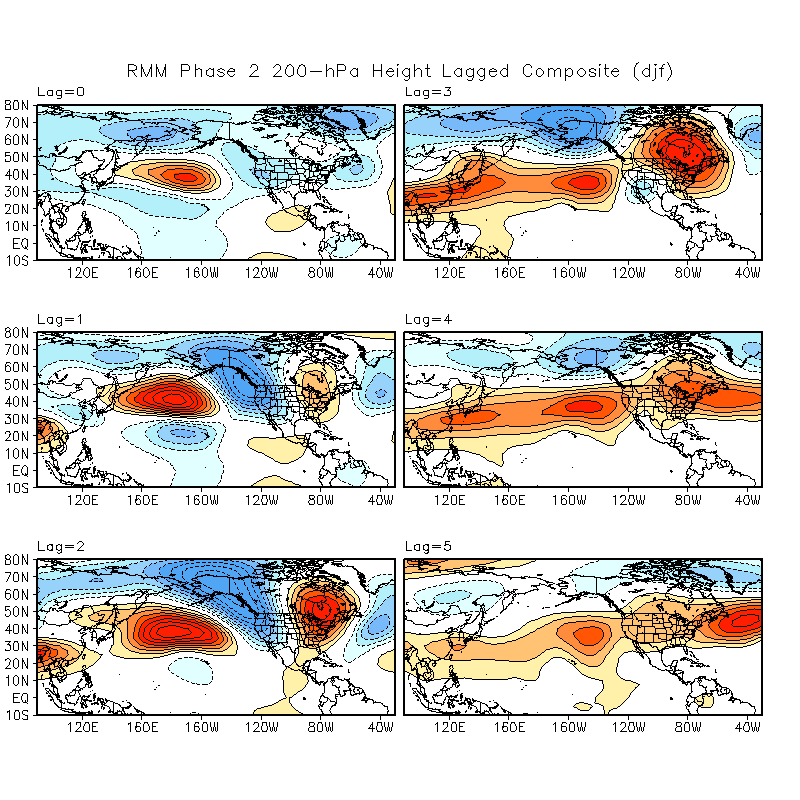
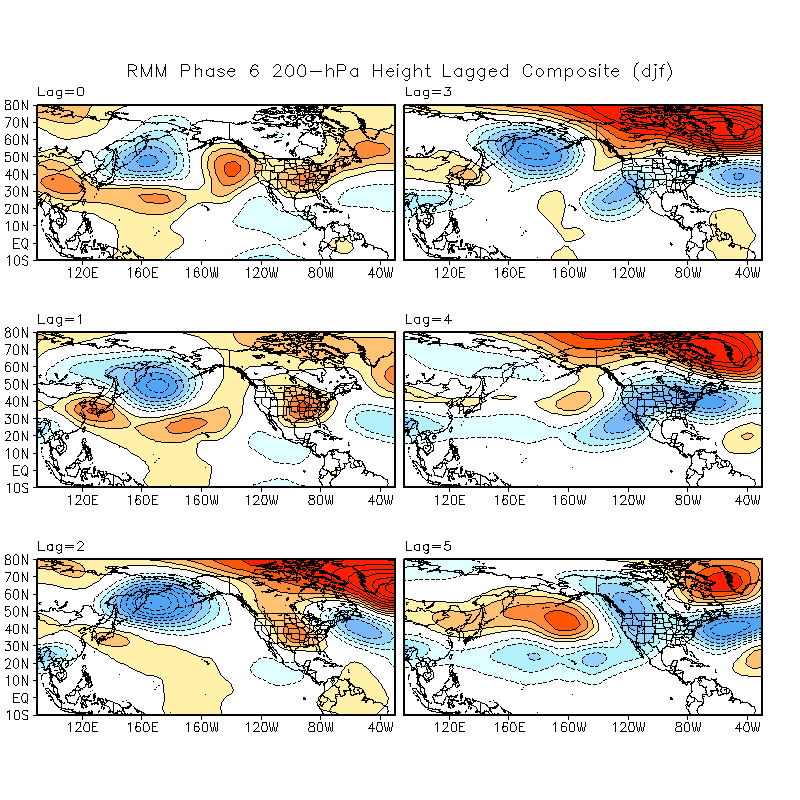
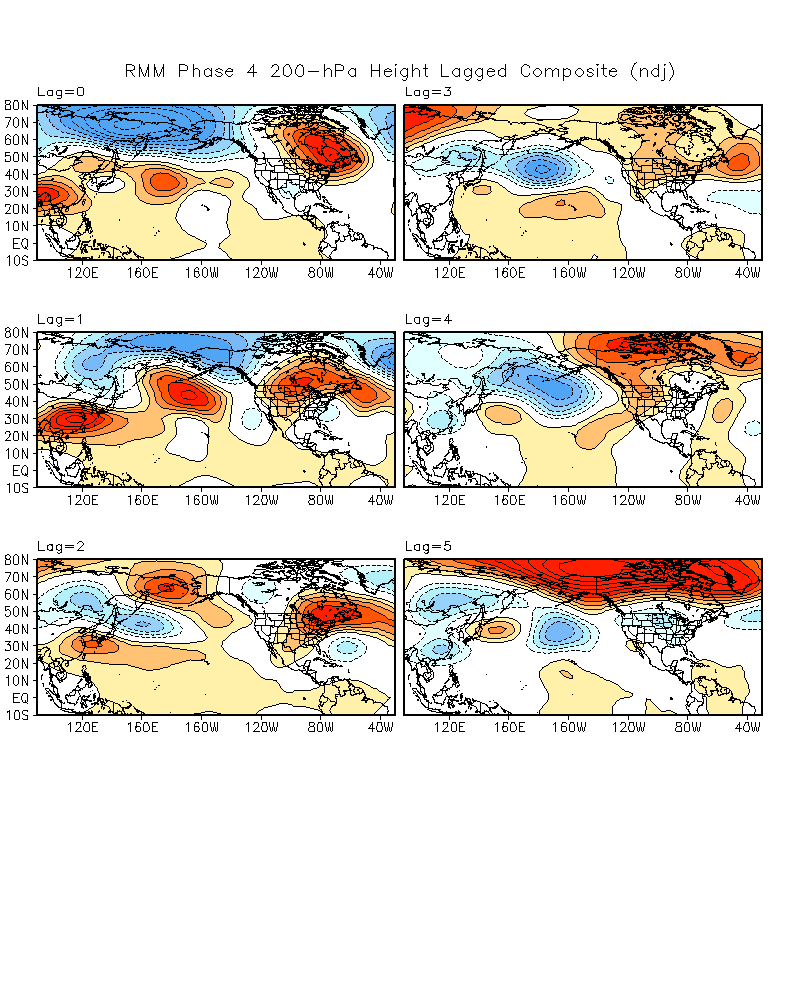
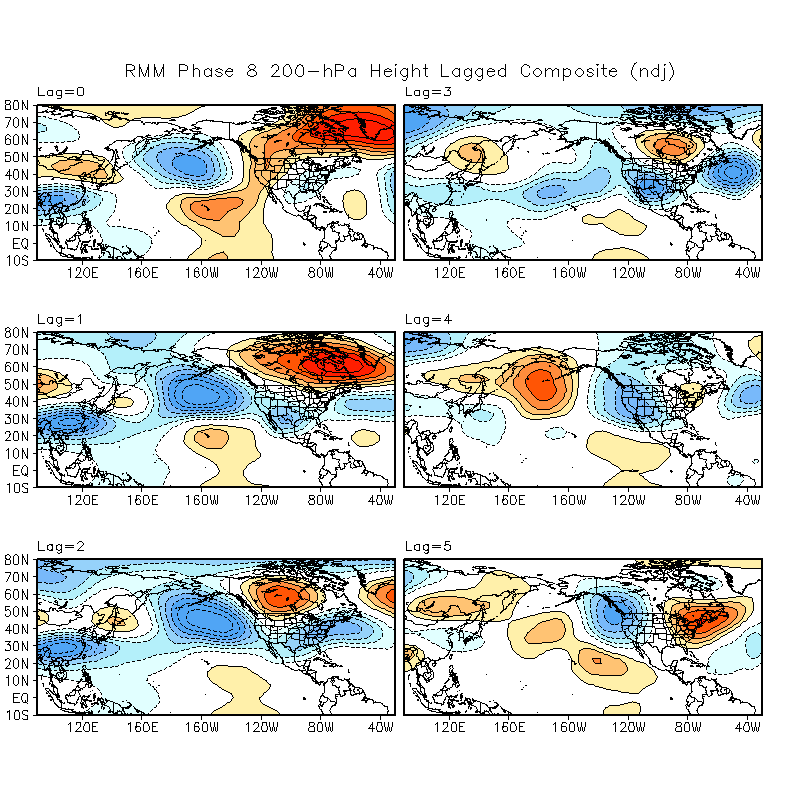
This does suggest that convection may be most amplified this winter in MJO phases (3-6) that are not cold over the eastern U.S. (phases 5-6 are OK in early-mid December, which I will get to later). However, keep in mind that the MJO getting into the western Pacific can set off a wave train that eventually leads to blocking, especially if it continues propagating. Here are lagged composites for phase 5 of the MJO in DJF, which are quite warm with a strong SE ridge when the phase 5 occurs and in the short-mid range, but turn much blockier a few weeks later:

This low frequency forcing IS a warm signal/risk for the bulk of winter, but likely isn’t as bad as last winter’s in terms of potentially encouraging MJO propagations that can lead to temporary breaks in the milder weather down the line.
The location of this forcing was a factor weighed when determining analogs.
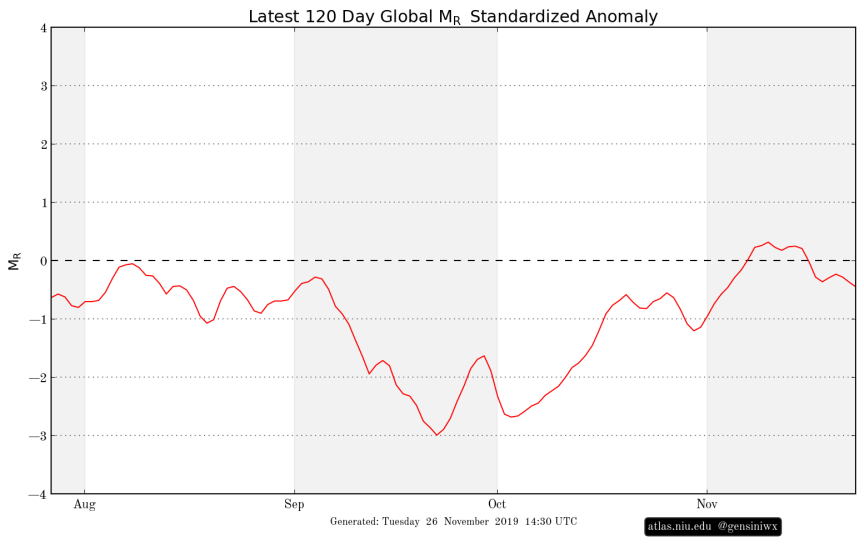
Atmospheric Angular Momentum:
Atmospheric angular momentum is, extremely basically, how much westerly flow there is across the globe. Typically, El Ninos feature a stronger / extended Pacific jet due to increased forcing over the Pacific, and higher AAM. La Ninas typically feature the opposite.

Above is the seasonal correlation to AAM in DJF. The correlation is weak in much of the U.S., but in general higher AAM features a +PNA pattern with higher heights over Canada and lower heights over the southern U.S…basically a typical El Nino pattern. If you inverse the colors (use imagination) and emulate the correlation for a -AAM, it looks much more like a La Nina with higher heights off the West Coast and across the southern U.S. and lower heights over much of Canada.
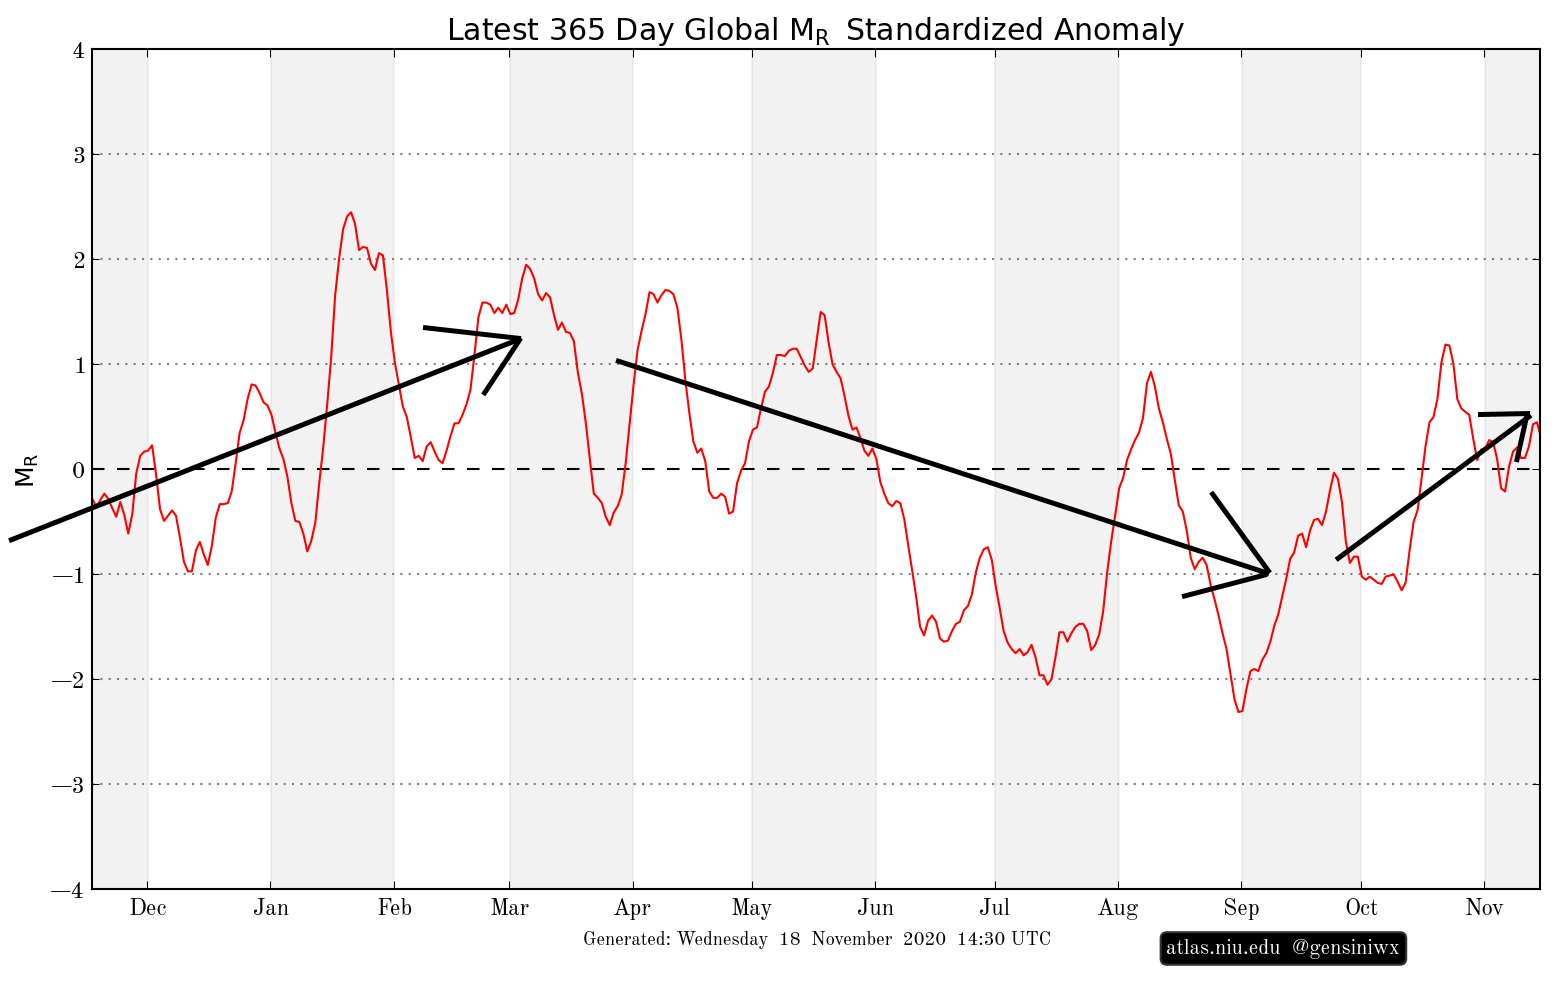
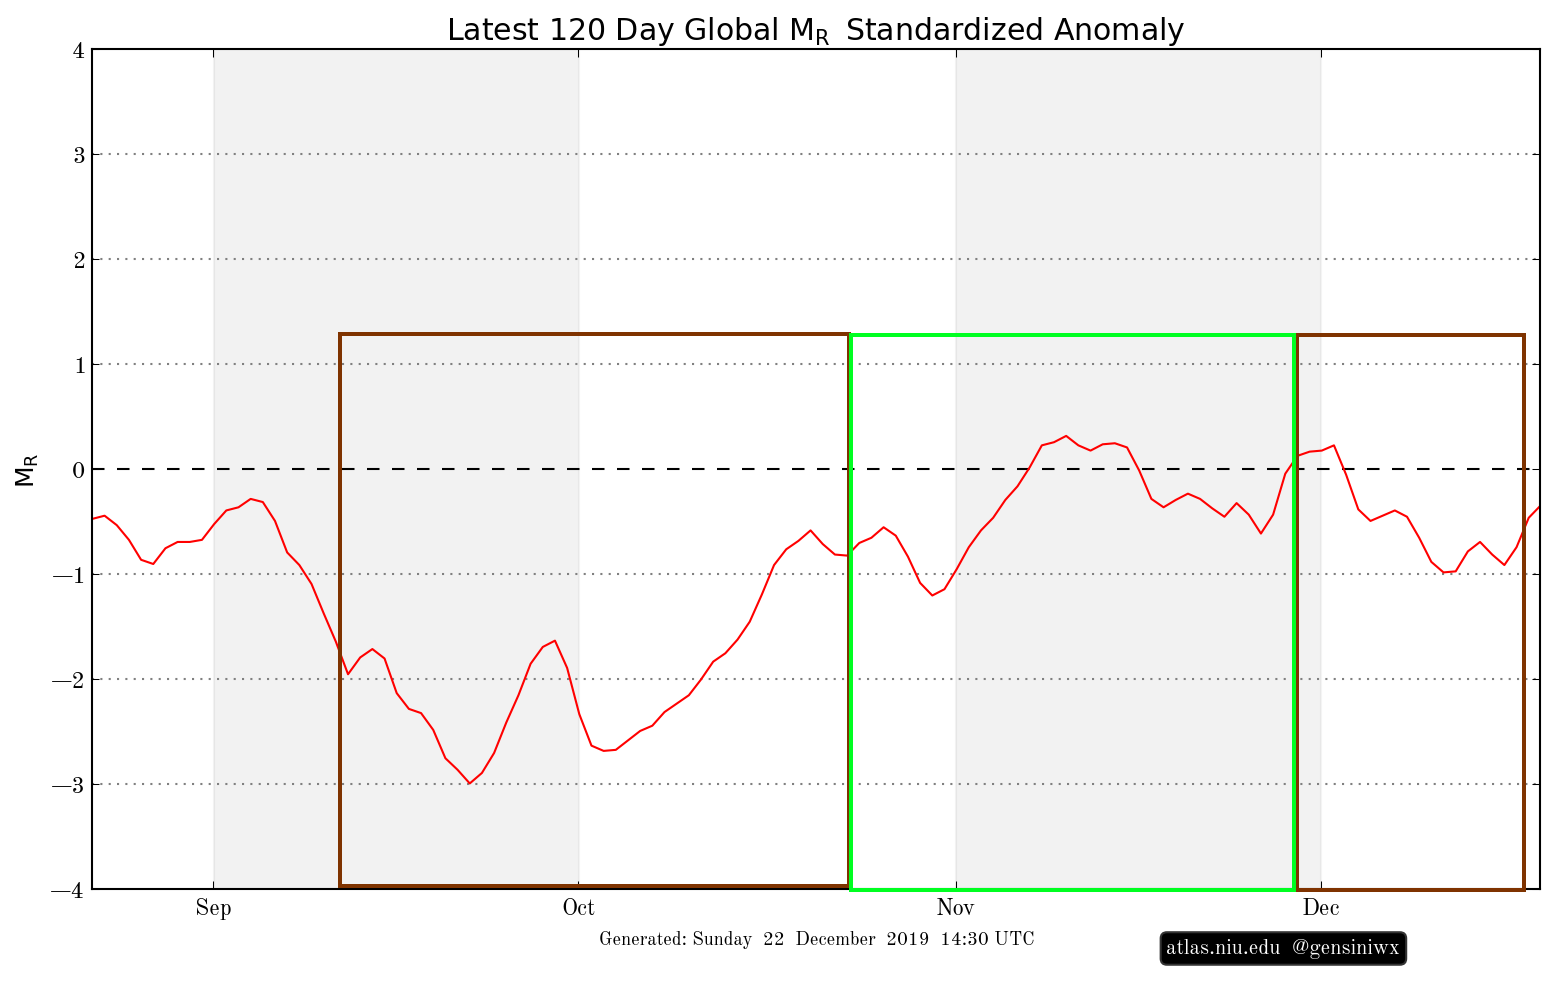
The AAM over the last year or so has been interesting. It was quite low in the fall of 2019, likely due to increased Indian Ocean forcing and limited Pacific forcing, which contributed to a very ridgey pattern in the mid-latitudes (in particular, across the Pacific) and limited disruption to the stratospheric polar vortex, allowing it to get quite strong by early 2020. It rose later in winter, though was distributed poorly and didn’t shake-up the +AO pattern. The AAM fell again over the summer as La Nina developed and strengthened. It has risen this fall and isn’t dropping back off yet. This atypical AAM for a La Ninia may explain why we’ve had cold weather over western North America and warmth nearly everywhere else in November (and quite possibly December, more later), which is not how La Ninas typically play out (usually, La Ninas start colder than they finish in the eastern US).
The fact that the AAM is kind of high for a La Nina isn’t necessary bad, but how it’s currently distributed is poor for winter weather fans in the eastern U.S. and Europe to say the least:

Plot from: https://atlas.niu.edu/gwo/
Momentum in the tropics and especially sub-tropics is quite weak. The mid-latitudes are rather unremarkable, but momentum (westerly flow) is high north of 60N, indicative of a +AO and lack of blocking. This distribution was seen at times in January-March of 2020 when all attempts to develop blocking failed.
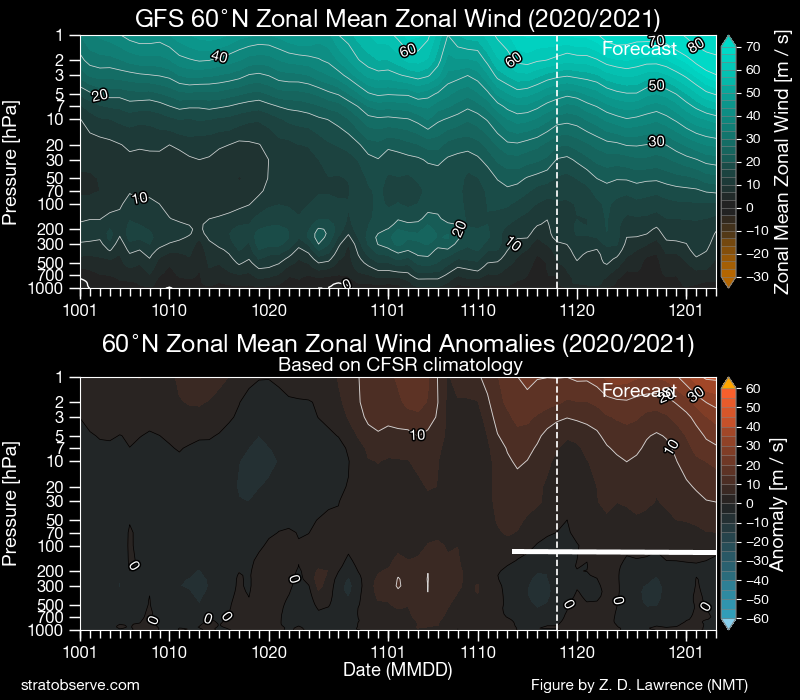
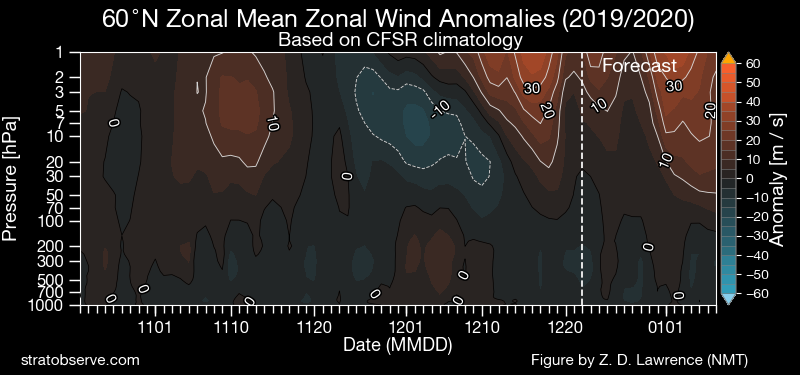
Plot from: stratobserve.com
Part of the reason we couldn’t shake the anomalous westerly momentum in the high latitudes in early 2020 was because the stratospheric polar vortex was very strong and coupled to the troposphere. Nothing was moving that, apparently…despite the increase in AAM and more active MJO during the second half of last winter, and despite a lot of model hints that we would eventually move that. Fortunately, the stratospheric polar vortex, while becoming strong again, is not yet coupled to the troposphere (note how zonal wind anomalies below the white line are still comparatively weaker than higher up). If this doesn’t change in the short-medium range, it may provide for some hope for an eventually blockier pattern if other factors can align.
Analogs:
Now that we’ve more than thoroughly discussed some of the potential drivers that are evident this summer-fall, let’s start diving into the analogs. Factors I weighed while searching for possible analogs included:
- La Nina, with preference for first year events and moderate to strong hybrid or east-based events
- The Indian Ocean, with preference given to years with a neutral or weakly negative IOD in the fall
- The fall PMM, with preference given to years with a higher PMM in the fall
- The PDO, with preference given to years with a somewhat negative PDO
- The QBO, with preference given to years with a westerly QBO, and some tolerance for years with descending easterlies, but westerlies below 50mb through the winter
- The October teleconnections (AO, NOA, PNA, and EPO)
- The September-October low frequency forcing
- The general hemispheric pattern and AAM in September and October
- The speculative November pattern
- The speculative November MJO when that data is available
- Years with a large / strong West Pac warm pool
- The solar cycle (minimum or coming off a min)
There weren’t many analogs that check all of those boxes to an acceptable degree, but if I had to give a few tiers:
Top tier: 1988-89
“Good” tier: 64-65, 99-00, 08-09, 10-11, 17-18
Potentially useful tier: 73-74, 75-76, 95-96, 96-97, 07-08, 11-12, 16-17
Other years evaluated: 54-55, 55-56, 67-68, 70-71, 71-72, 74-75, 83-84, 84-85, 85-86, 98-99, 00-01, 05-06
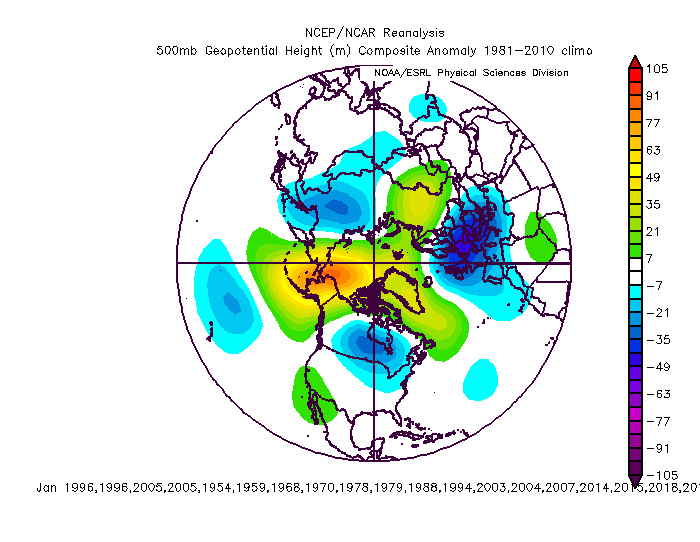
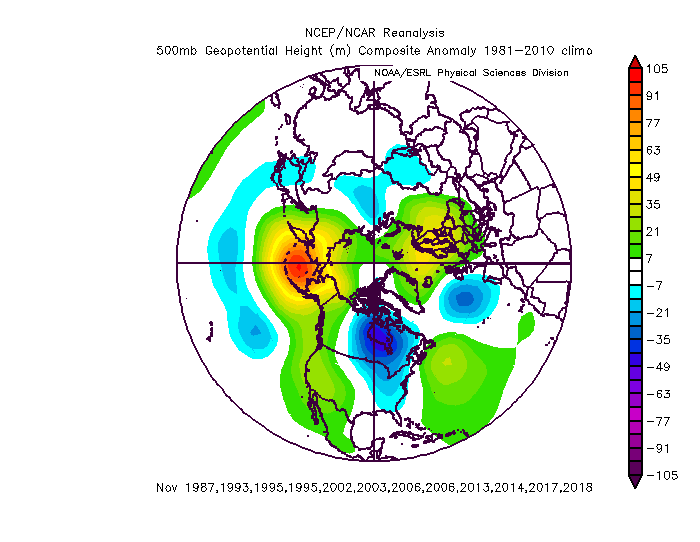
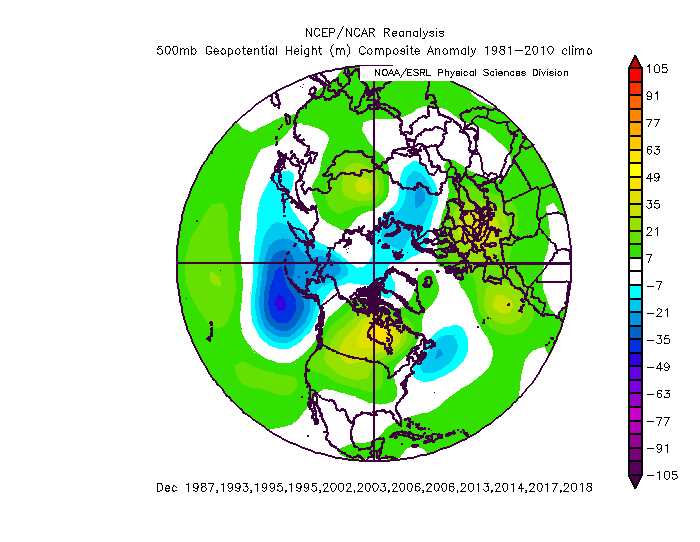
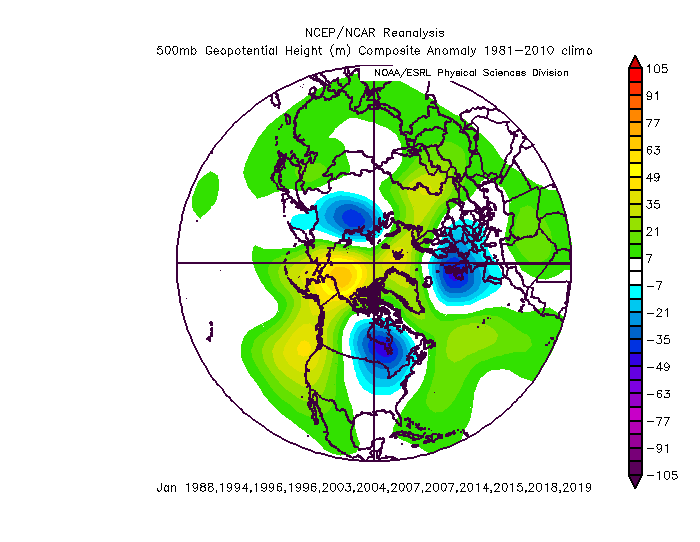
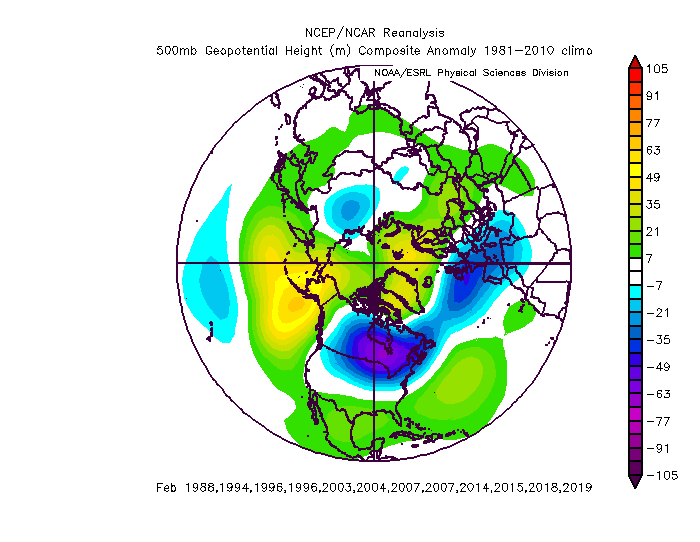
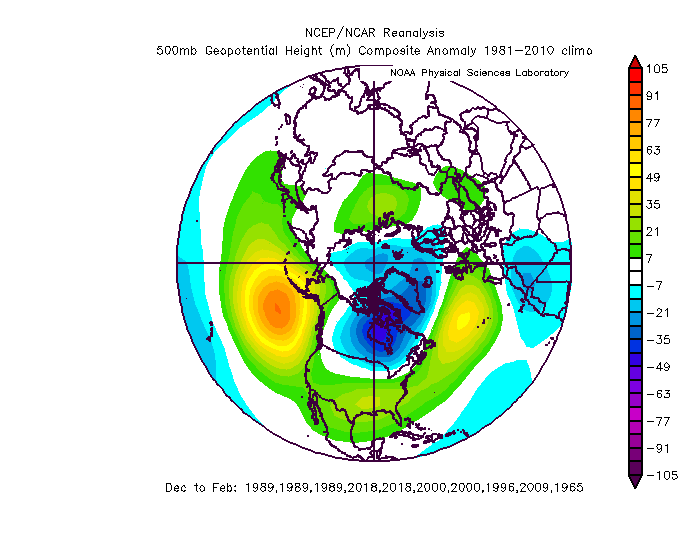
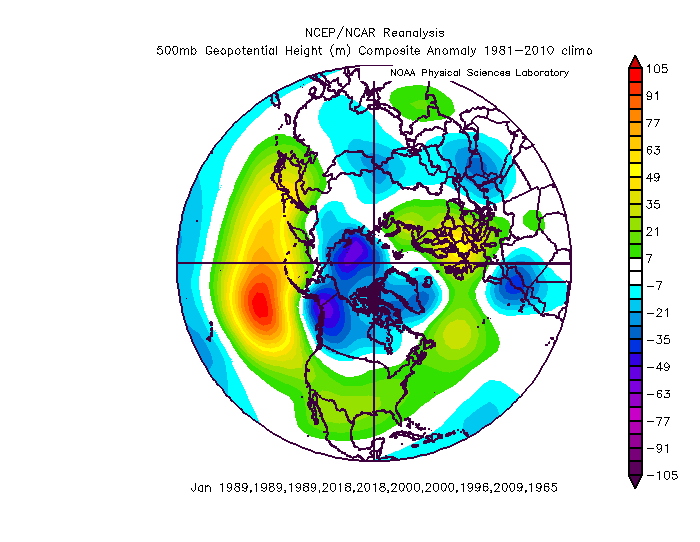
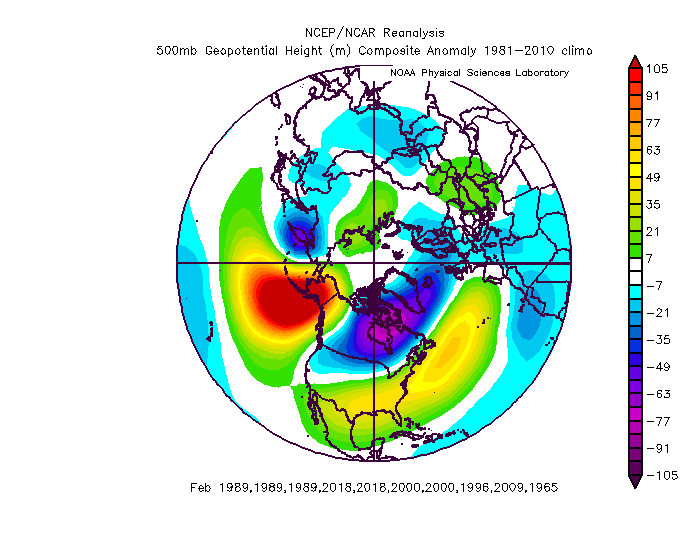
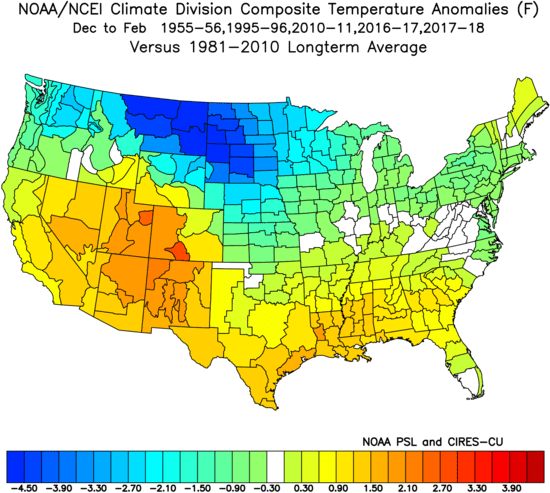
Here are some composites when using the top 3 tiers with weights:


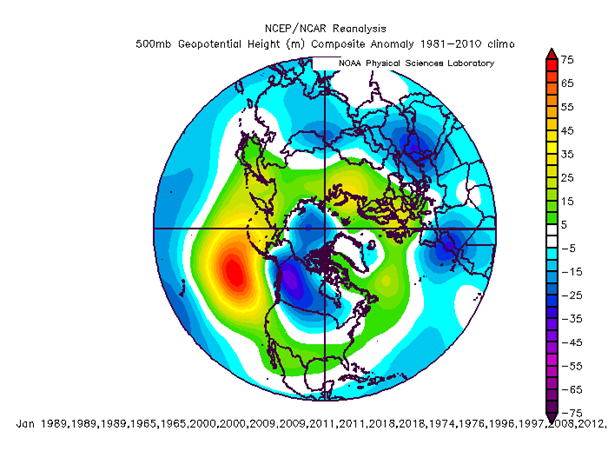


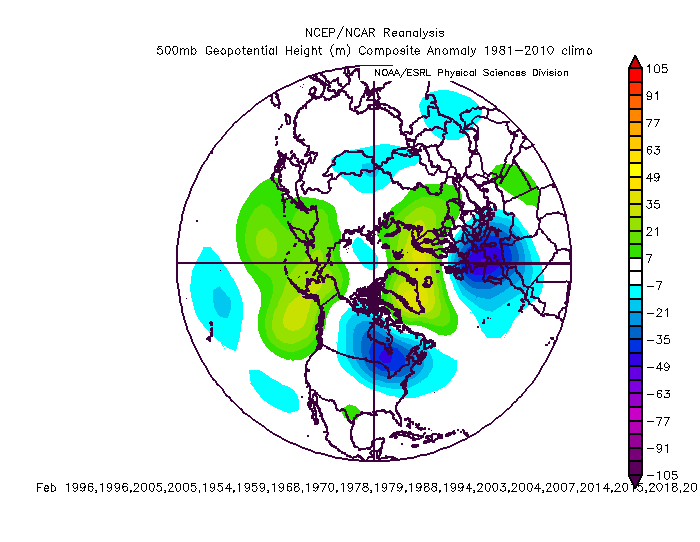
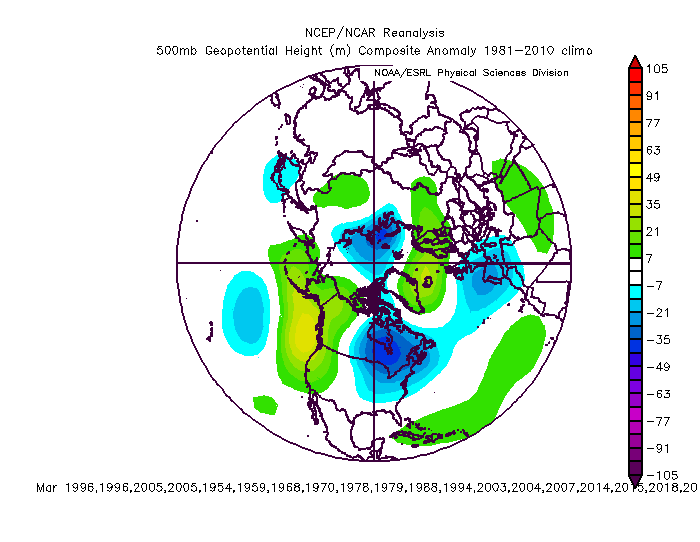
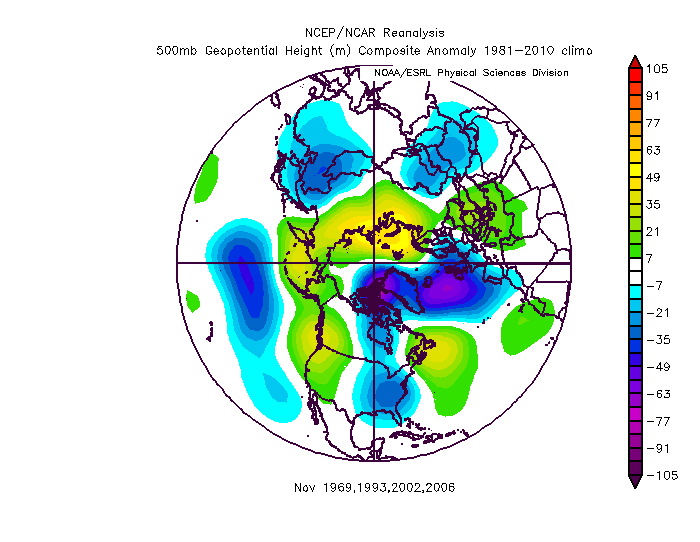
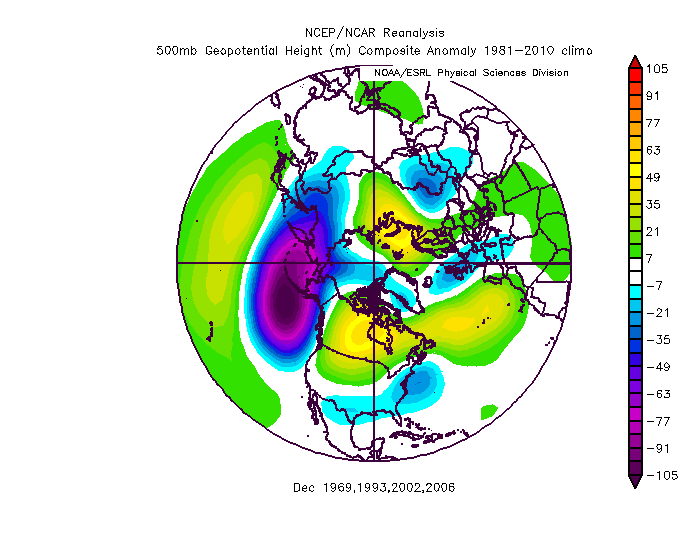
It fits the general La Nina theme, and looks more like the +QBO La Ninas with more poleward ridging in the north-central Pacific, but also a more +AO overall. December is generally the coldest month, with -EPO and some -NAO potential, with January likely quite up and down but with the AO, EPO, and NAO all trending more positive and the cold backing west. The February look has a robust SE ridge, though the deep vortex near Hudson Bay would probably be deceptively chilly / snowy from the Great Lakes into New England.
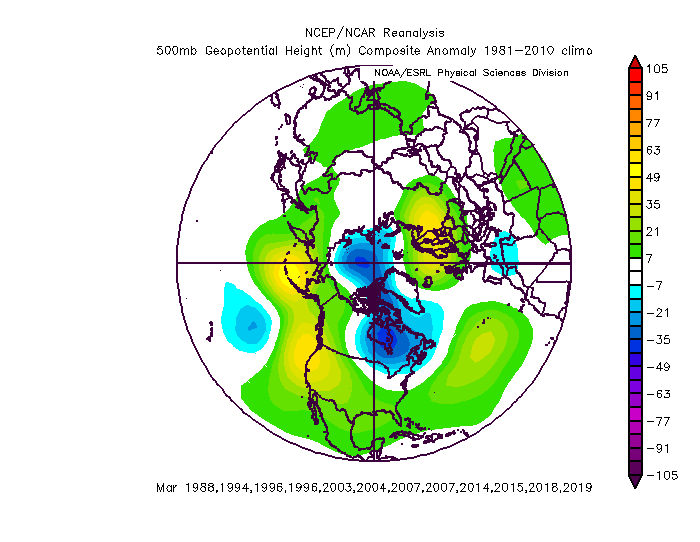
Unfortunately, most of these years were horrible matches to the pattern we’re seeing this November. The few years that made an analog tier higher than “also ran” that had a November pattern that was even somewhat palatable compared to this November were: 64-65, 73-74, 88-89, 99-00, and 11-12. Here was their composite November pattern:
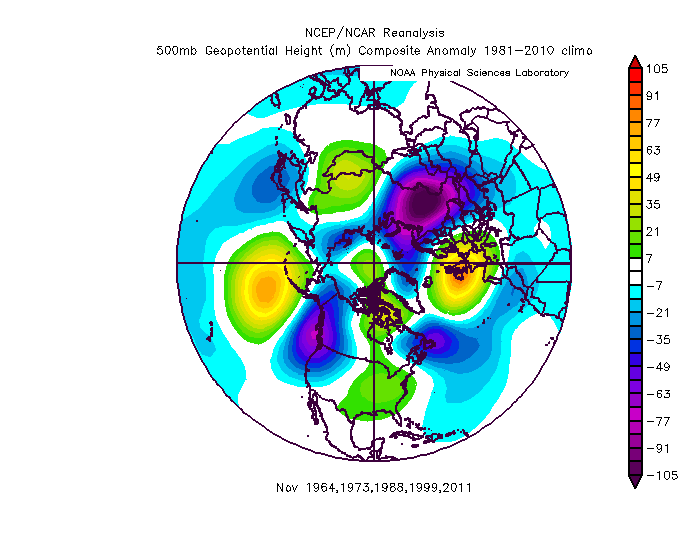
This is not by any stretch perfectly like what this November will look like after the second half of the month, but is somewhat tolerable overall, especially compared to the whole analog package’s November pattern (not shown). Arguably, 1988 and 2011 are the best matches to this year. For reference, here is what this November has done through mid-month:
For some idea of how the second half of the month may change this, the next 10 days on the most recent EPS run as of this writing on Wednesday:

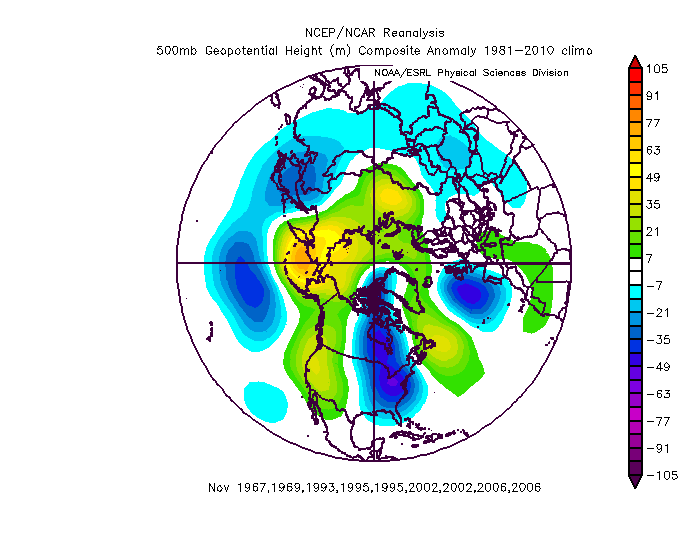
Not perfect by any stretch, but still somewhat OK overall. Here is what those years did in December, and then the rest of the winter:


Overall, this is the shittier end of the larger analog pool. However, without giving the rest away yet (dramatic effect!), I do not think this December’s pattern will end up like the composite pattern in the above Decembers.
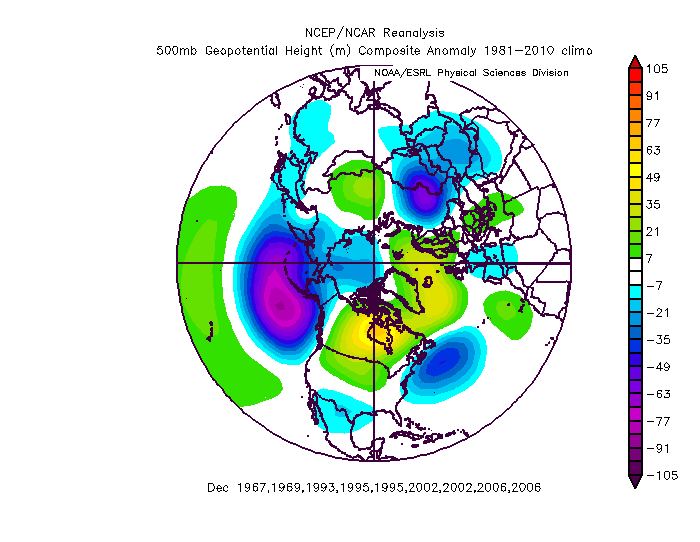
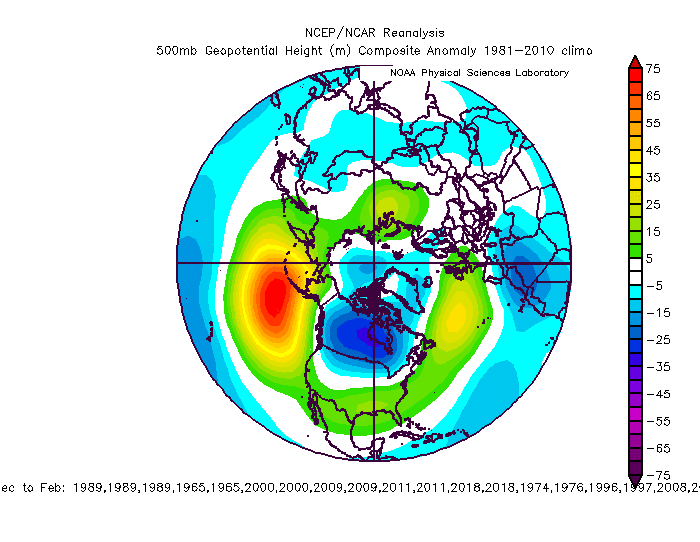
With that said, a select couple of those years did end up turning much colder in December and / or January:


64-65 is actually one of the higher scoring analogs…the only thing that really held it back from being a tier higher is a lack of MJO data, distance back in time, and a marginal November pattern match.
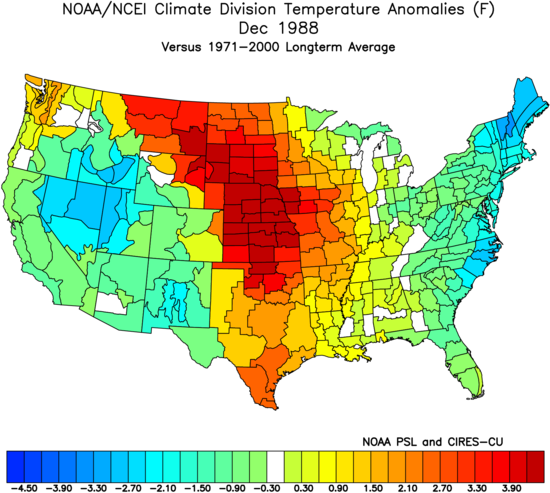

88-89 was one of my highest scoring analogs.


Not the greatest analog, but was similar in enough areas to be rated somewhat high.
Most of the winters with similar November patterns to this year were not good winters overall, though more than half featured a legitimately cold period at some point in December or January, and January of 2000 did pull off a pretty good East Coast snowstorm. It is worth noting that 64-65, 88-89, and 99-00 all had at least some similarities to this year WRT the September-October hemispheric pattern/AAM, low frequency forcing, QBO, and in 88-89 and 99-00, some similarities to the November MJO (MJO data not available back to 1964). Worth noting that these analogs have several similarities to this year, are a decent match to this November’s pattern, and have notable cold and/or snow over the eastern U.S. in either December or January. It is possible…
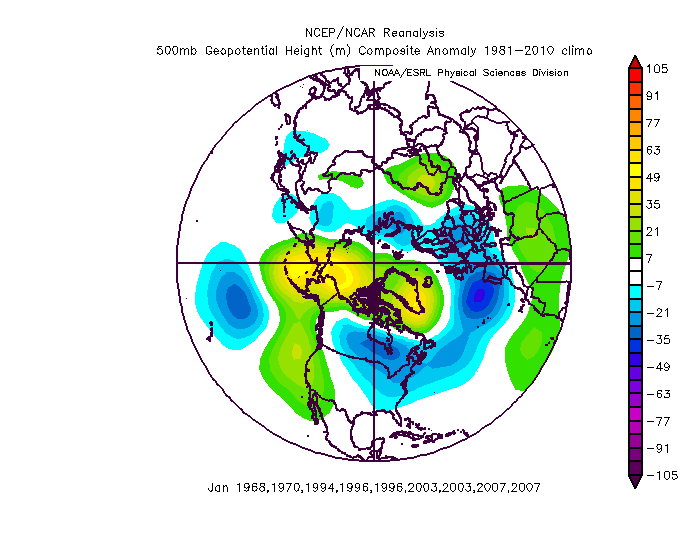
Out of all of the analogs, the only ones that had some similarity to this month’s MJO, the QBO, the low frequency forcing in fall, and the hemispheric pattern / AAM in September-October are 88-89, 95-96, 99-00, 08-09, and 17-18. I will throw 64-65 in there, as despite a lack of MJO data it is a good match in the other areas. However, the November pattern in 1995, 2008, and 2017 was not like this year. WRT the 95 and 08 MJO, they’re not perfect matches, but may have a similar move towards phases 4-6 as some models have over the next two weeks, but a couple of weeks earlier in those years. Given everything, a final blend of analogs includes those 6 years with weighting…an interesting note that 4/6 of these winters featured a SSW.


My final maps don’t look exactly like these composites, mainly because we’re far enough into this fall to speculate about the December pattern and its possible ramifications without analogs, but some takeaways are that December into January may offer the best shot at blocking and colder weather into the eastern U.S. February is the greatest risk to see a strong SE ridge. While March is mild on the mean, it’s somewhat muted compared to February, and the pattern February into March would keep Canada cold, so if the SE ridge isn’t dominant it could allow for an opportunity to turn chilly and try snowing in March in the Midwest and Northeast.
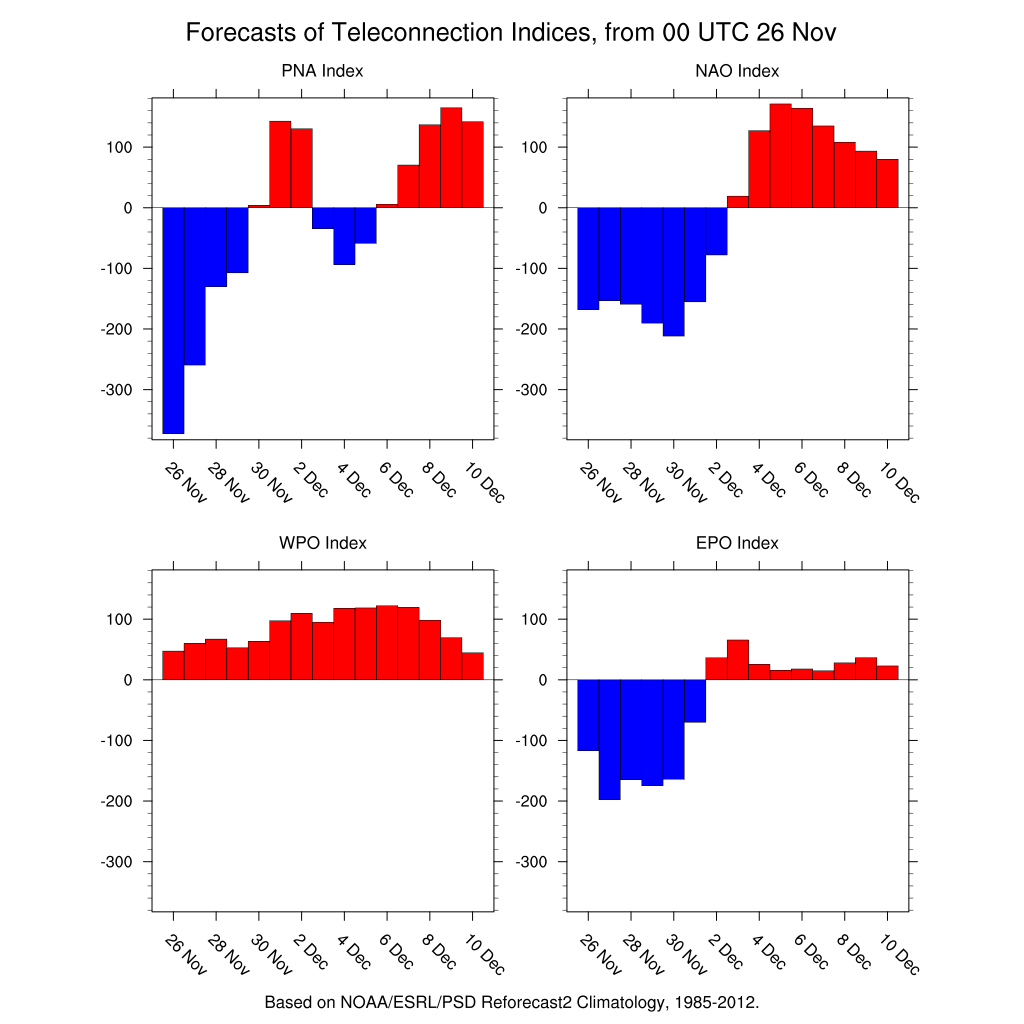
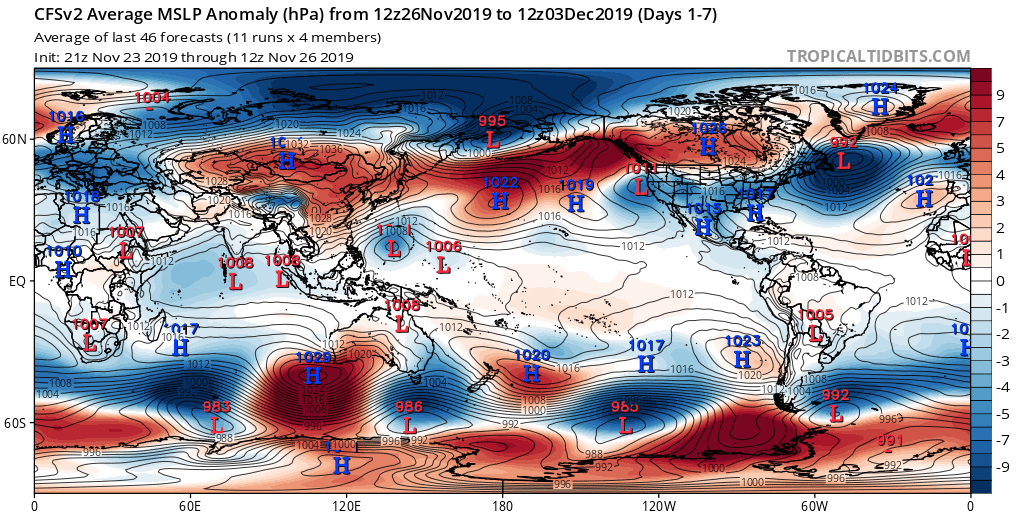
Ongoing – Medium Range Pattern:

As has been the case much of November, the pattern is not conducive for cold / snow in much of the central and eastern U.S. The poor distribution of AAM is evident, with ridging in the mid-latitudes pushing anomalous westerly flow to 50-60N, resulting in a +AO. There is a small block near Alaska, that will dump enough cold into Canada that a couple of systems may produce some thread-the-needle snow from the Midwest/Great Lakes into parts of the Northeast through the weekend after Thanksgiving, though otherwise for now a southeast ridge will keep mild air dominant over the rest of the central and eastern U.S.
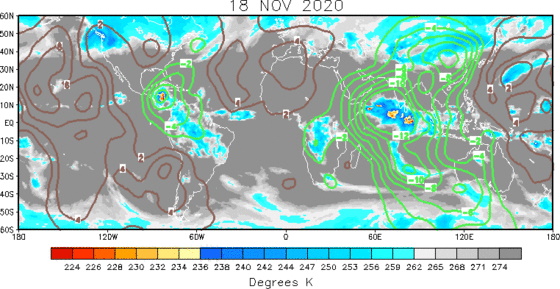

Convection is very active across the Indian Ocean right now; a combination of the low-frequency base state, a Kelvin Wave, and the MJO appear to be causing this. The MJO is progressing through phase 2 at a somewhat respectable amplitude, contrary to some prior model predictions. This Twitter thread by @griteater features a nice loop showing the increase in convection and upper-level divergence as the MJO arrived in the Indian Ocean (definitely a good Twitter follow for those interested in mid-long range forecasting, he also posts on some of the common forums such as AmericanWx and 33andrain).
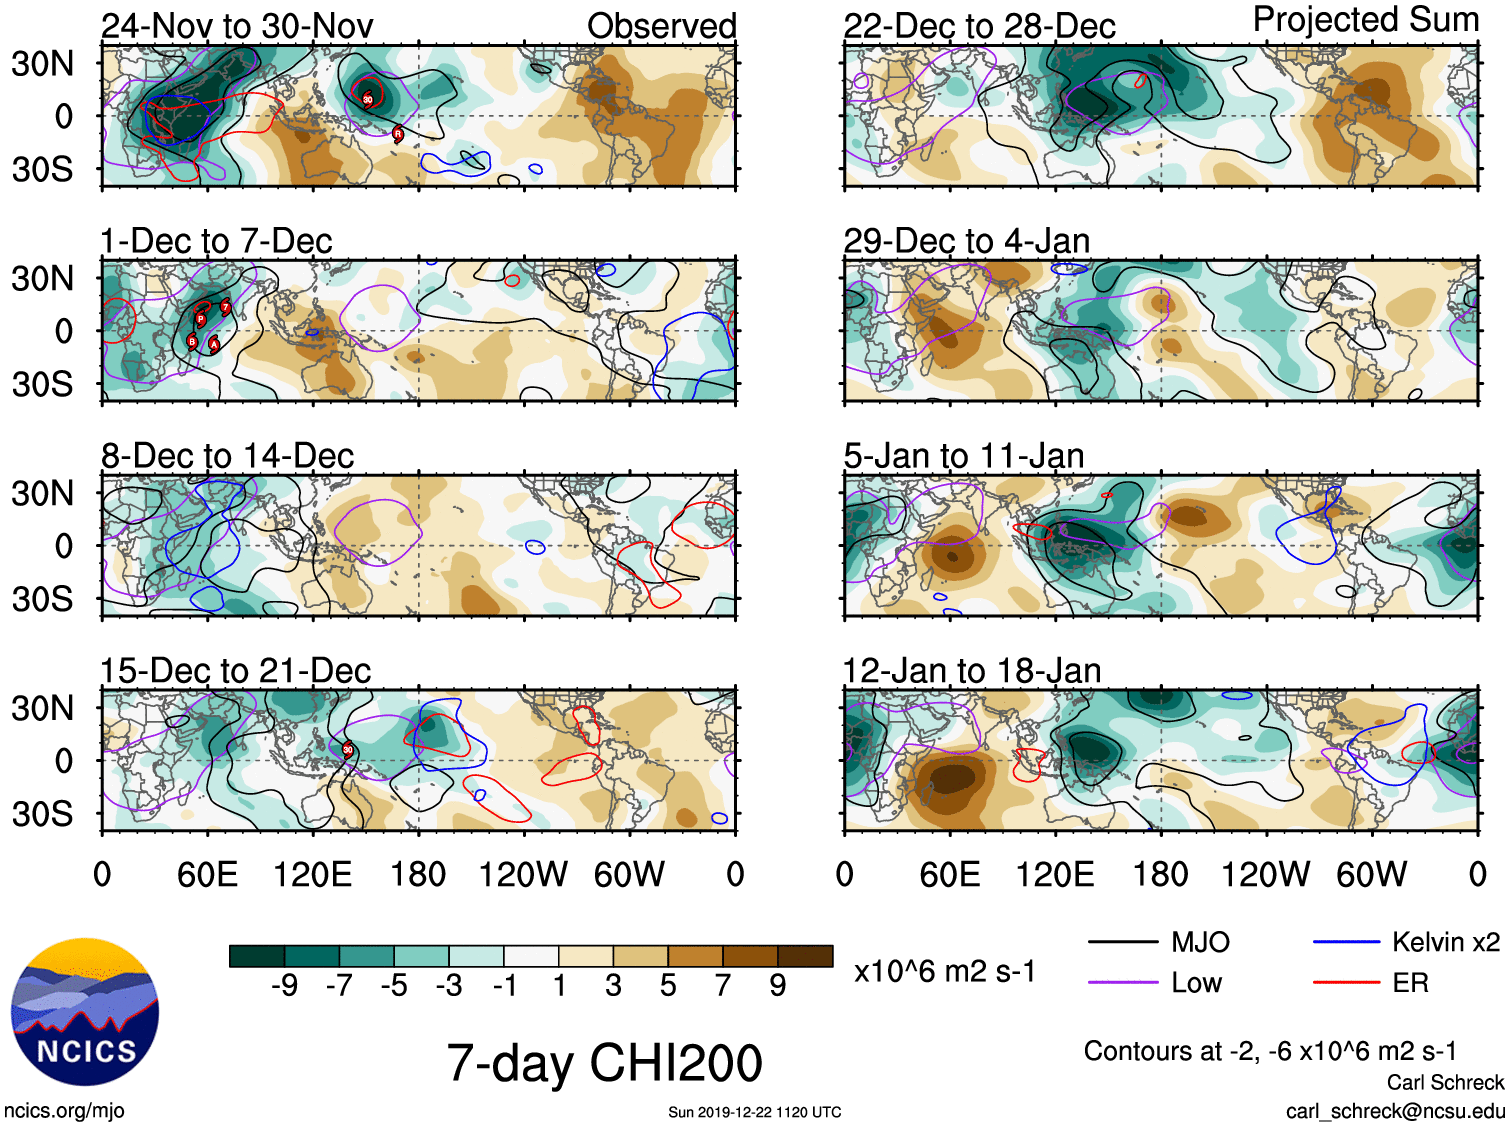
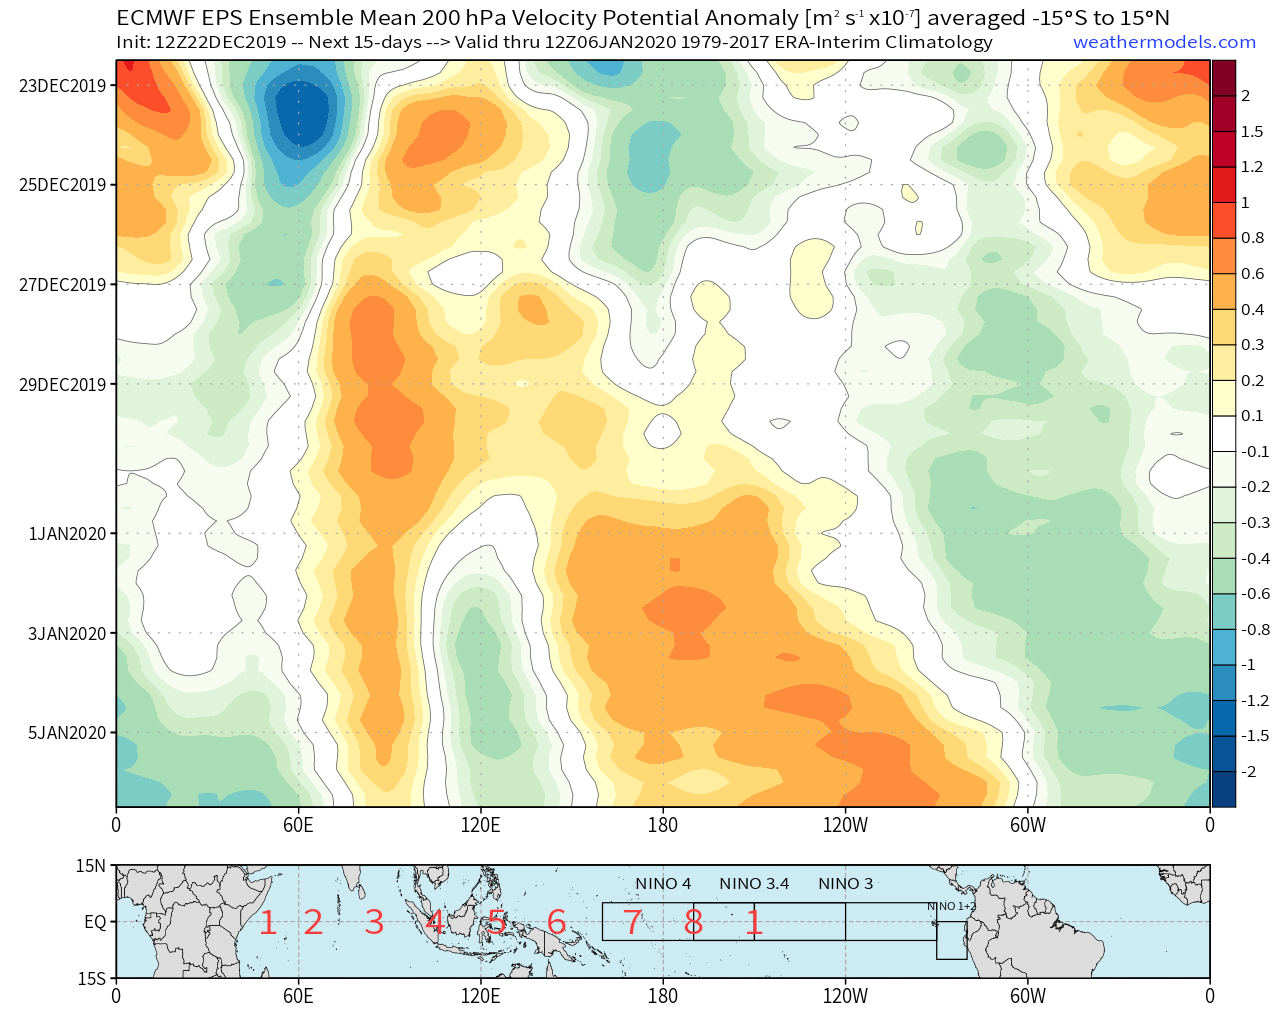
This analysis on Dr. Mike Ventrice’s website shows similar, with the MJO and Kelvin wave constructively interfering right now. There may be brief subsidence behind the Kelvin wave, though I think the robust nature of the MJO and low-frequency forcing will offset that and allow the convection to continue propagating east. Yet another plot, this from Carl Schreck, shows the current constructive interference, and the potential for the low-frequency forcing centered near 120E (as discussed earlier) and warm SSTs to keep convection going to at least 120-150E into early-mid December:
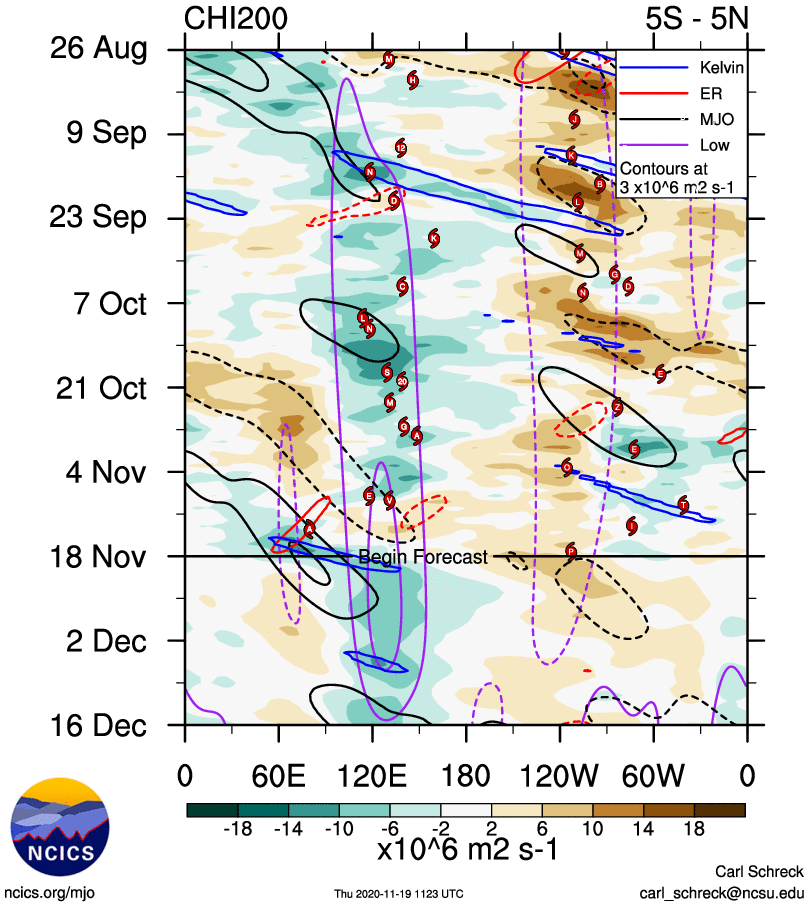
Plot from: https://ncics.org/portfolio/monitor/mjo/
In general, the GEFS has consistently been more bullish on getting the MJO into phases 6-7 than the Euro and CFS. Again, given the low-frequency forcing centered near where the MJO enhances convection in phases 5-6 and the warm waters in those areas, I do think convection becomes active between 120-150E (and perhaps a bit farther east) later November and into early December. It is possible that the MJO itself doesn’t make it out into the Pacific, as the low frequency forcing will dampen the MJO’s signal in the short term, and that same LF forcing suggests suppressed convection once farther east into the Pacific. However, convection between 120-150E is not bad through early December, given wavelengths still shorter than mid-winter, and a compelling argument can be made that the MJO is a significant driver at the moment. A few various tools illustrate this I think:

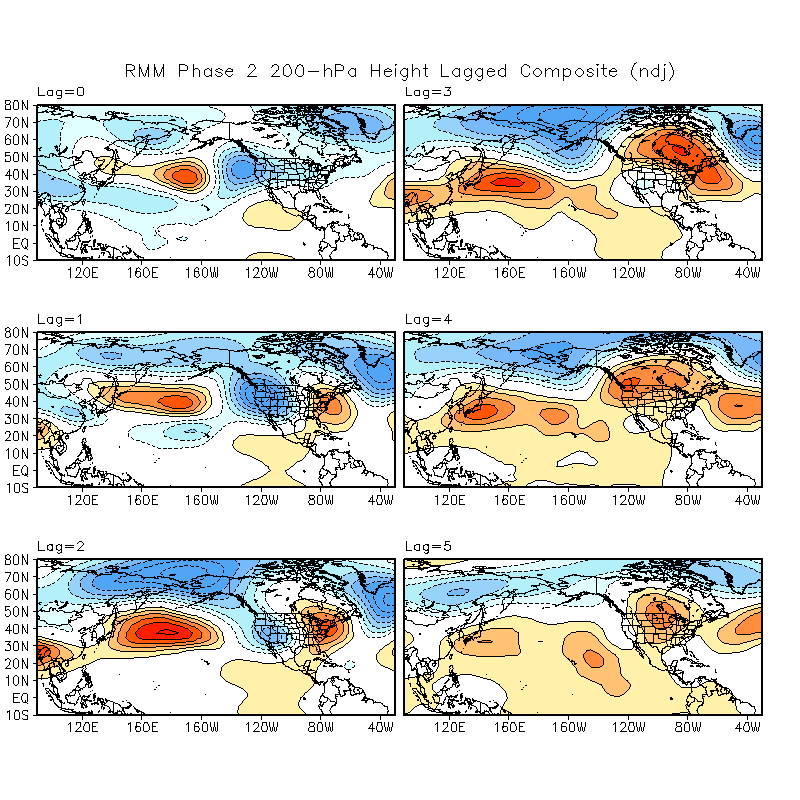
The lagged October-December phase 2 composites on the CPC’s website (each lag is 5 days) shows a similar pattern in the first few pentads to what most ensembles suggest occurring over the next 1-2 weeks, with troughing over the northern Pacific, Alaska and near the West Coast, along with ridging over the central and eastern CONUS. That then gives way to a more +PNA pattern. The anomalies in the later pentads are generally not statistically significantly, so although that’s still not a great pattern it’s not particularly concerning if other factors suggest differently. An interesting note is that the strong low across the northern Pacific that floods much of North America with warmth in the shorter term does not necessarily persist in these composites.
Another tool, from Paul Roundy (http://www.atmos.albany.edu/facstaff/roundy/waves/), shows the typical MJO response at much finer scales than three-month periods. In transition seasons, when the wavelengths typically change quicker than a 3-month mean will capture, these regressions add quite a bit of additional value.
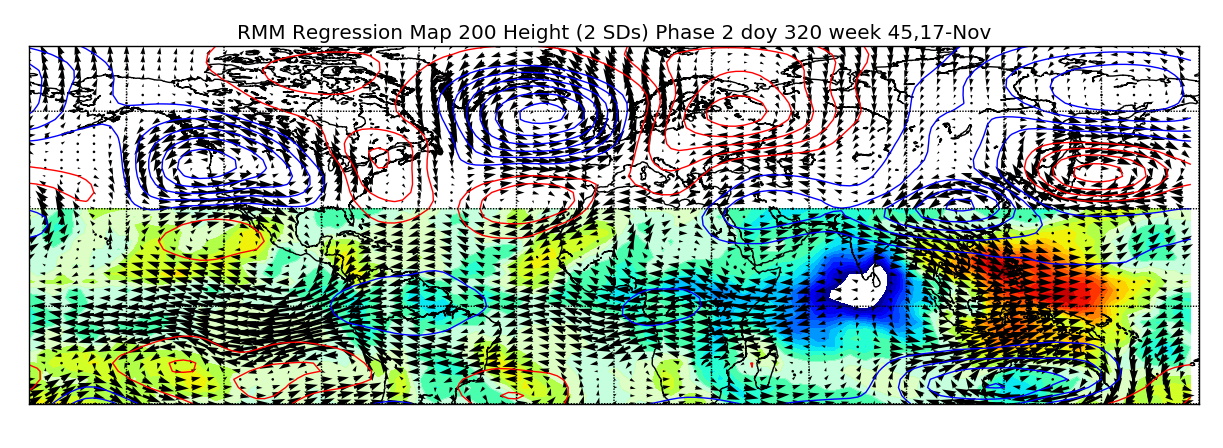
The phase 2 regression for the week of November 17th shows a number of similarities to the pattern we’re actually seeing…and, moving the regressions forward through phases 3-6 with time shows a fair amount of similarity to the pattern showing up on many of the medium range ensembles in late November, followed by an increase in blocking near the West Coast and in the NAO domain, should we get increased convection to near 120-150E by early December.

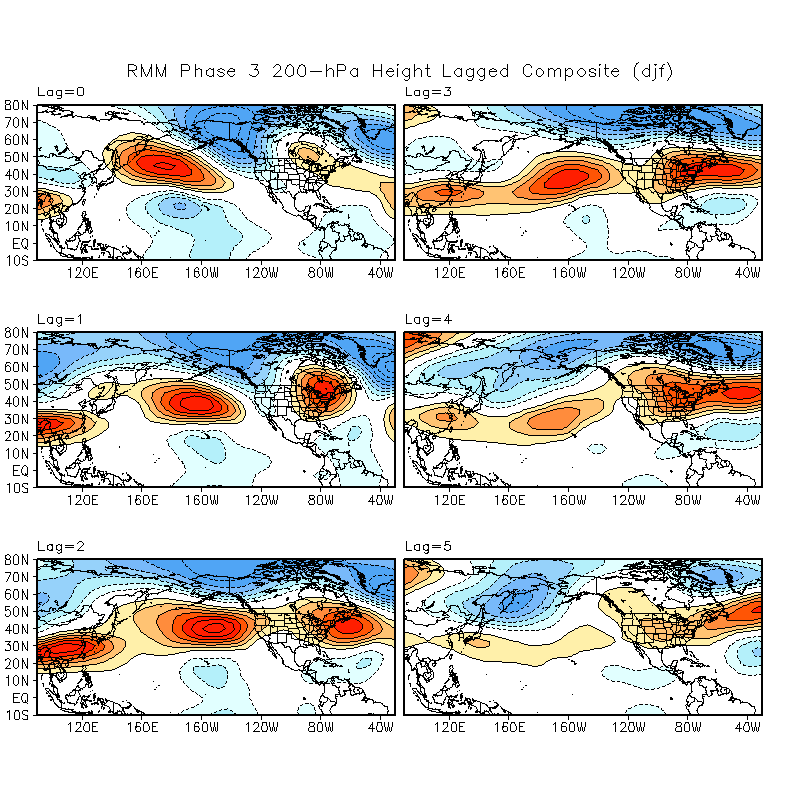
The CPC October-December Phase 5 lagged composites show similar as well:

Both Paul Roundy’s tool, and the CPC composites, show a much warmer response to Phase 5-6 with a Southeast ridge during winter, so as the wavelengths get longer, this teleconnects to what people traditionally think it does in winter…warmth for the eastern U.S. But since wavelengths are still shorter, that’s not yet the case, and it can actually be helpful for winter weather fans in the central and eastern U.S.
There should be an increase in AAM in the tropics and sub-tropics in late-November as the MJO propagates east towards the far western Pacific, and as a strong East Asian Mountain Torque event occurs…

There has been a fairly persistent signal among the GEFS and EPS for a block/ridge near and east of the Ural Mountains to dump cold air and high pressure into eastern Europe for a prolonged period of time in late-November into the beginning of December, leading to a prolonged, significant +EAMT event:

This will lead to an acceleration of the east Asian-Pacific jet (the tropical forcing moving east towards 120-150E will also contribute to that). There’s also some minor signal on the EPS for an increase in West Pac tropical cyclone activity around the beginning of December (the GFS and GEM have had a number of false alarms while the EPS has remained much more bearish thus far).
This will add momentum in the sub-tropics, which may eventually improve the distribution of momentum across the mid-high latitudes and lead to a regime more favorable for high-latitude blocking, and also will encourage a change in the Pacific pattern in late-November and early December. With convection most active well west of the Dateline, this strong jet will want to break somewhere over the central or eastern Pacific (the +PMM and active STJ may initially cause this to occur farther east than it otherwise would in a La Nina). This will cause a significant attempt at raising heights over the western U.S. and into Alaska, which may increase the PNA and drop the EPO.
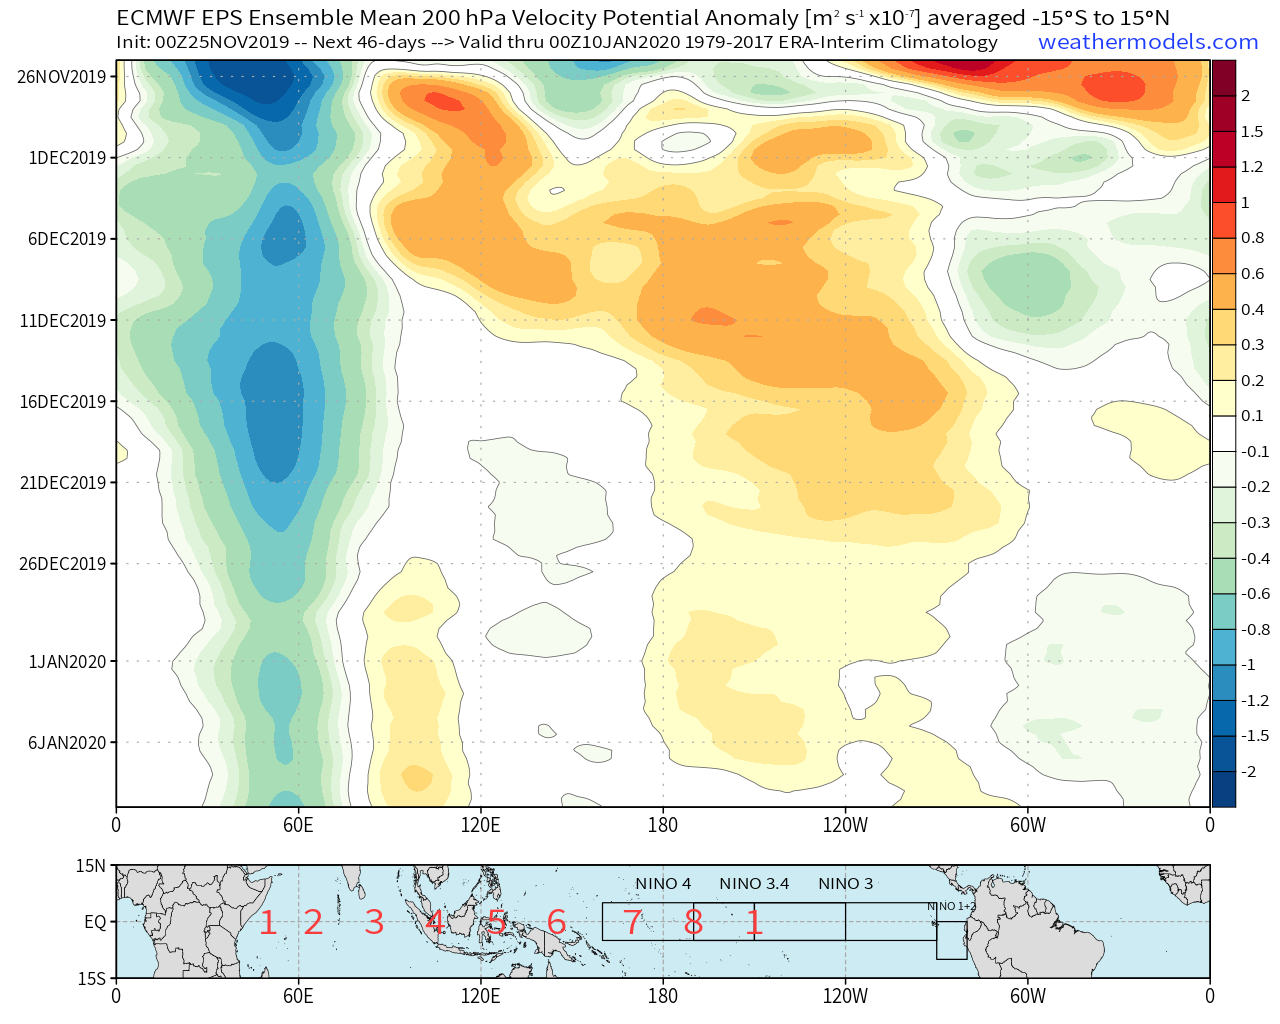
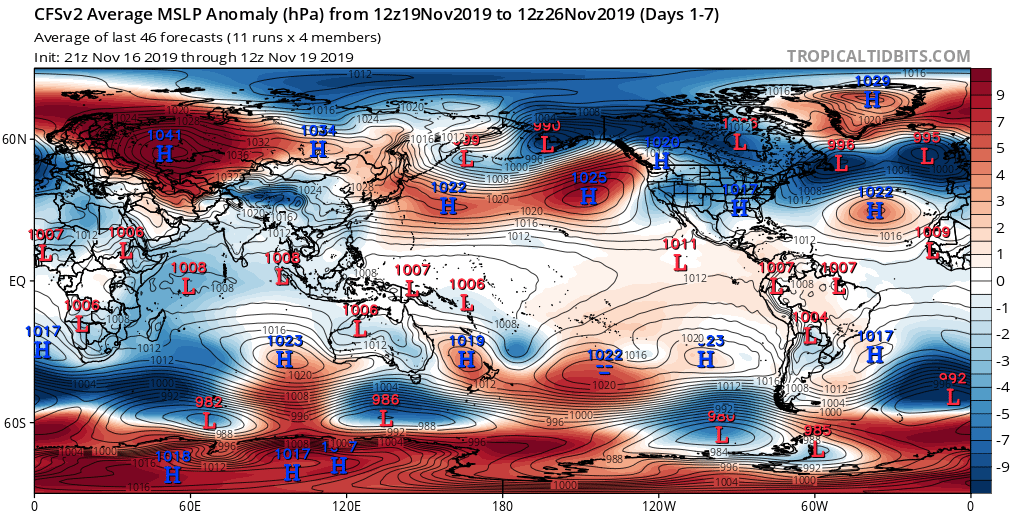
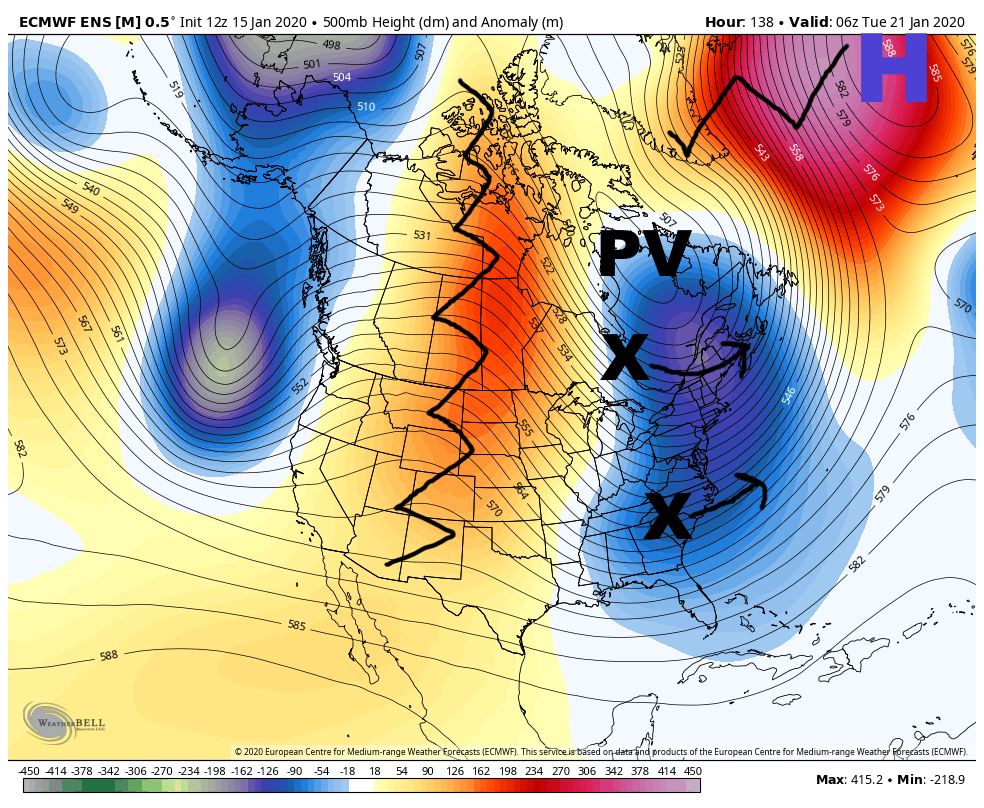
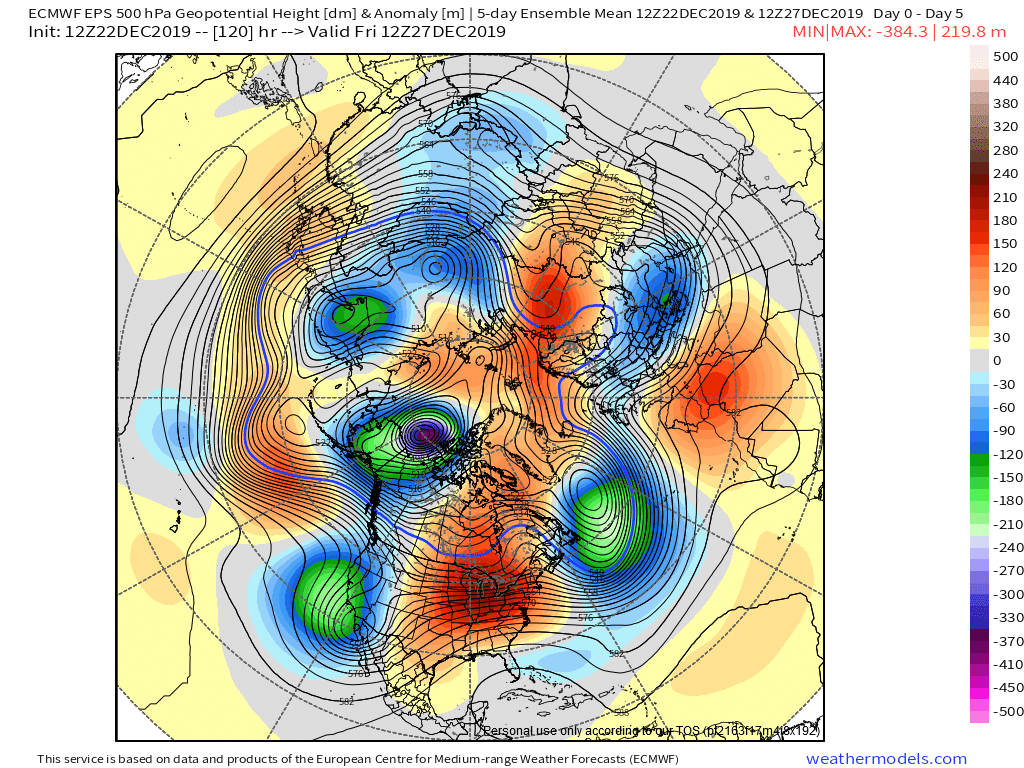
You can see this on Thursday’s 12z EPS, which is more bearish than the GEFS in getting convection into the western Pacific (also note the sub-tropical jet enhancement from the positive PMM east of Hawaii):

The wave breaks want to happen somewhere over the central or eastern Pacific, though initially the TPV over Alaska may be stubborn. The stratospheric PV will also briefly swing towards Alaska around Thanksgiving, which doesn’t help this cause:
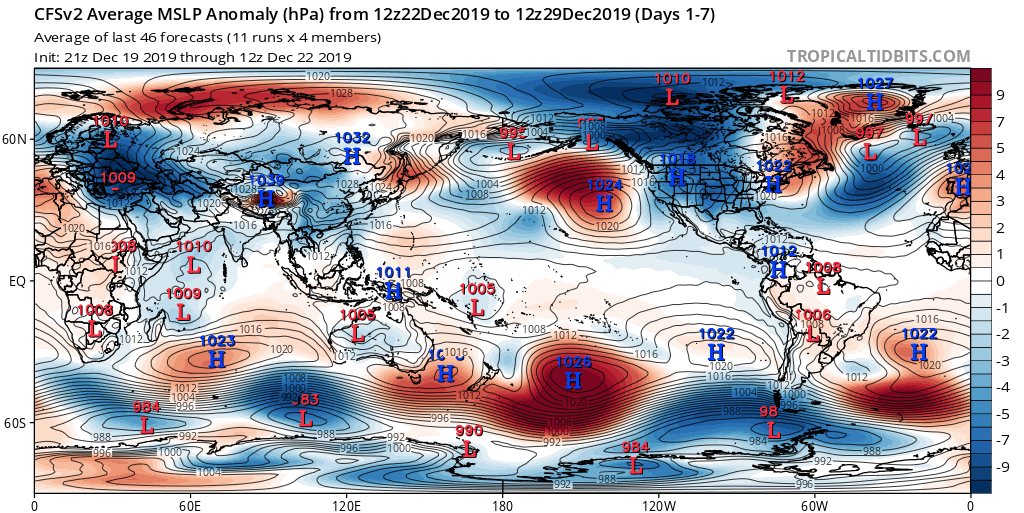
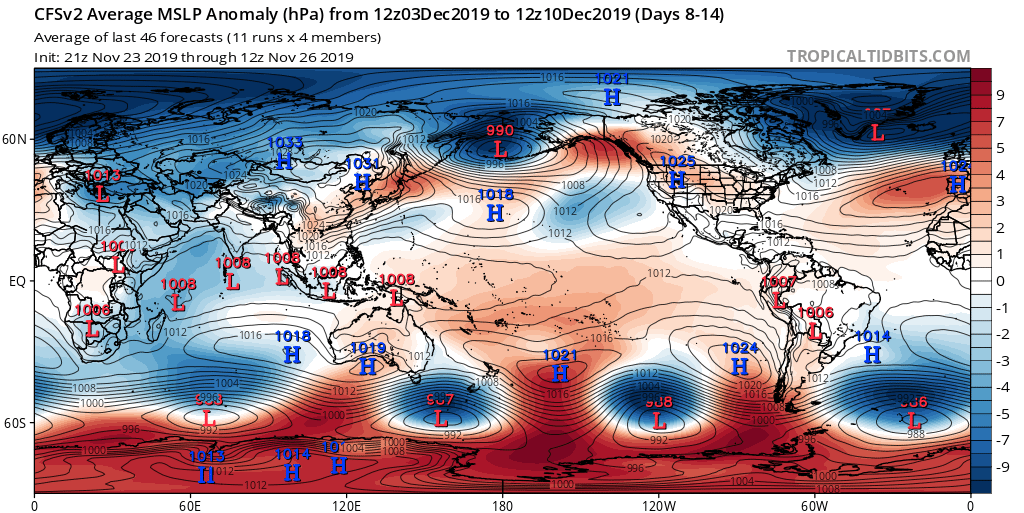
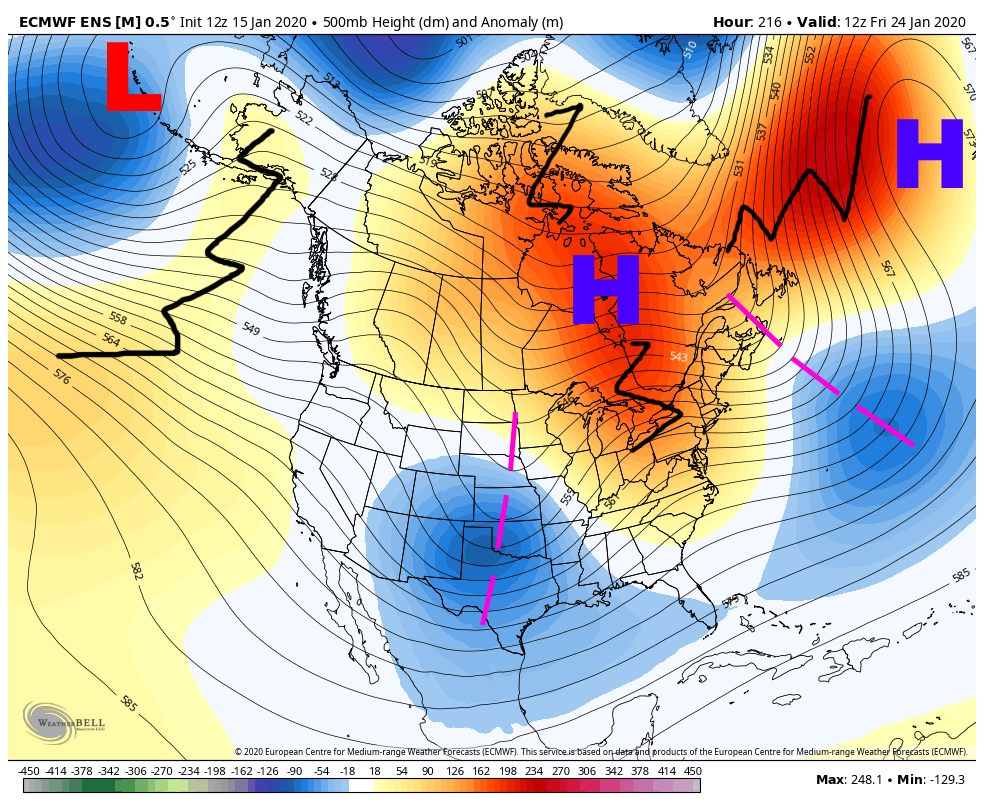
So, we likely won’t see an immediate rise rise in heights over Alaska, but if the SPV moves away from Alaska and the TPV backs west…which the EPS and GEFS consistently show both at the moment…the wave breaks would eventually have a much easier time trying to raise heights on the West Coast and into Alaska. Initially in late November and early December, the lack of height rises over Alaska will result in the PNA rising, but the EPO won’t drop immediately. The op models consistently have a very progressive, wavy pattern with sub-tropical support to end November and start December with a +PNA look. The ensembles don’t look very stormy yet in this regard, but their mean pattern by the end of November / early December is too smooth:
(A note that this is a couple runs old now as of this posting, and it has trended a bit sharper with its ridge and trough axis)
The wavelengths in early December aren’t long enough to support a trough from 160E to 100W, and a ridge from the West Coast of the U.S. to eastern Canada. While it’s likely it’s generally troughy and generally ridgey in those areas, the pattern will probably be quite a bit wavier than an extended ensemble mean implies, which will allow for a bit more cold air to be available than modeled, and along with the active sub-tropical jet may bring snow potential when / if there’s enough polar jet influence. Given the STJ involvement, if marginally cold air can get displaced well into the CONUS any snow threats, in a more Nino-like fashion, may not favor the northern tier.
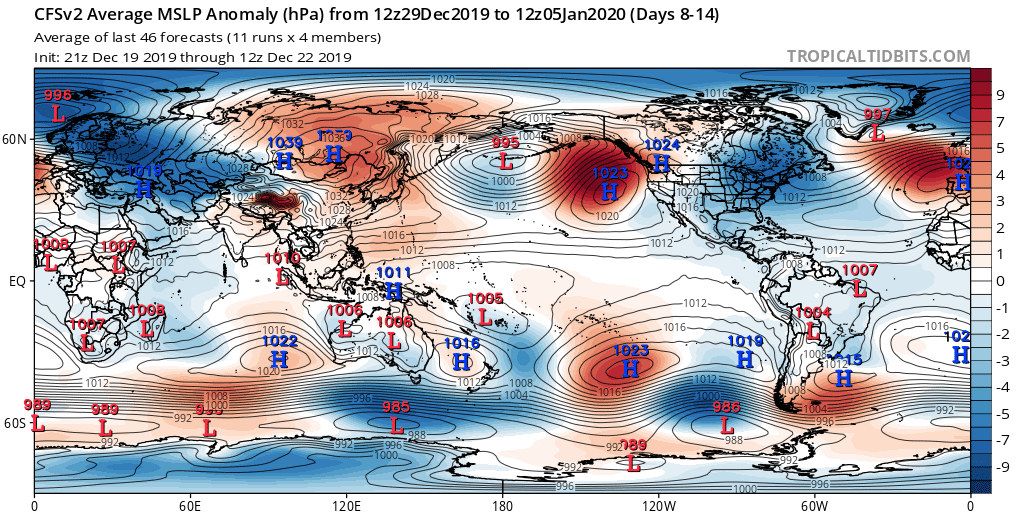
December will start quite mild across most of the CONUS with a progressive, but active pattern with a somewhat enhanced sub-tropical jet. That’s pretty baked in based on with the very +EPO to end November. But it very well may be stormier than the smoothed ensemble mean implies, with at least some transient cooler shots too. And, once the TPV starts sliding west of Alaska, it’s quite possible heights rise along the West Coast and towards Alaska quicker than the smoothed means suggests too. A day 12-13 51-member ensemble mean will not resolve something like a wave break at all.
While I think there’s legitimate potential for at least a temporary -EPO developing in early-mid December, I’m not as confident in Atlantic side blocking following suite. It is possible, as both the Roundy and CPC plots show a -NAO response to phase 5-6 forcing in the late-fall, and there have been hints of it on longer range guidance (the ECM monthlies have consistently had a weak -NAO for December. Let’s point out what, other than the Euro monthly, may point to a negative NAO:
An MJO propagation into the western Pacific (in particular, phases 5-7) in late November or early December, as mentioned, can favor the NAO dropping into early-mid December. In addition, Rocky Mountain Torque will remain weak if not somewhat negative into the mid-range (it shouldn’t increase until we start seeing EPO-induced cold shots, early December at the earliest). This favors a weaker jet from eastern North America into the western Atlantic.
With an active STJ late November / early December and a +PNA, the potential is there for strong cyclogenesis in the central or eastern CONUS, which may help raise heights / perhaps cause a wave break over the northwestern Atlantic. This, along with some (but not consistent) hints on guidance of a dropping NAO into early December, and the tropical forcing, does give multiple ways to get the NAO to drop. A couple of sources for pause:

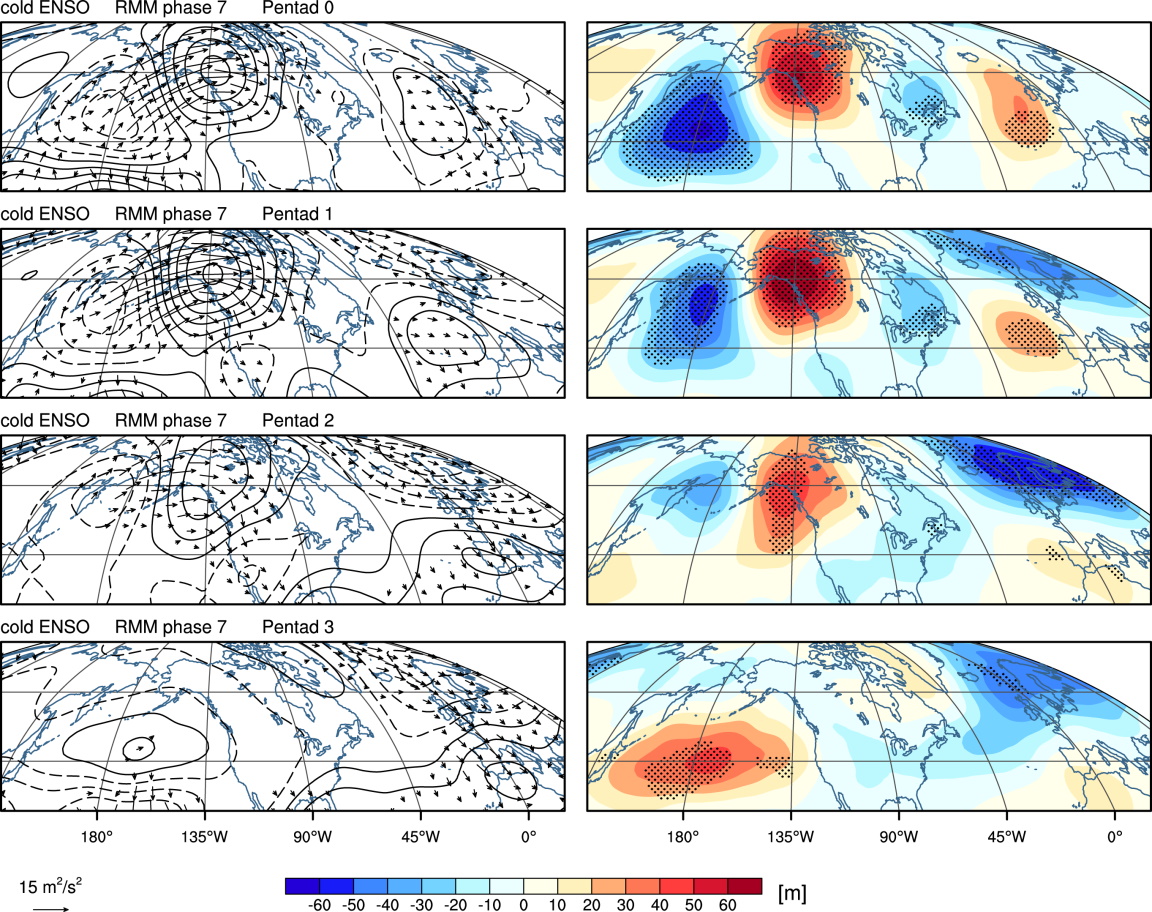
From this paper: https://journals.ametsoc.org/jcli/article/31/13/5293/92625/The-Impact-of-the-Madden-Julian-Oscillation-on
In general, the MJO does not produce as robust of an increase in blocking during a cold ENSO as it does during a warm ENSO in the winter. Note how phase 7 with a warm ENSO has a strong, statistically significant correlation to a -NAO. There are hints of a lowering in the NAO following a phase 7 with a cold ENSO, but it’s weaker and for the most part not statistically significant. Note than there is a temporary increase in blocking along the West Coast and into Alaska shortly following a phase 7 during a cold ENSO.
This suggests that while a -NAO isn’t impossible if we get the MJO to propagate into the western Pacific over the coming couple of weeks, the cold ENSO may otherwise lower the chances of it delivering the goods compared to otherwise. This does, however, further point to height rises along the West Coast being a possibility.
My other concern:

After the PV gets shunted away from AK and allows for a better opportunity for the wave breaks to raise heights there, it moves towards the eastern North America – northeastern Europe sector. While it’s not strongly coupled to the troposphere right now, this may discourage prolonged blocking in the North Atlantic, or at least make it so everything needs to go just right for it to occur.
My overall thought on the NAO over the next few weeks is that while I think we will see attempts for it to go negative…and at times, the op models will do it in a big way…I’m not confident we pull it off. A legitimate -NAO ups the ante along the East Coast in December, though one may not be needed for something if the Pacific side improves as I think it may. Basically, I lean narrowly towards a +NAO for December, with perhaps a couple of short dips, with a lower potential for a wave break in just the right spot to pull it off. Not impossible, but not really predictable at this stage…perhaps I’m just bitter from watching most -NAO attempts fail the last 7 or 8 winters, with the notable exception of March of 2018.
Thoughts on tropical forcing deeper into December:
There is a divergence among guidance, with the GFS in particular keeping forcing active between 120-150E for much of December, while the EPS and CFS, along with the JMA, generally appear to focus it farther west in the Indian Ocean by mid-December, causing the attempt to raise heights on the West Coast into Alaska to be brief and be quickly replaced by a pattern similar to what we have now with the TPV frequently settling near AK. Even if convection does remain active near Indonesia and spark a change to a pattern we’d more typically expect in a La Nina December, as the wavelengths look more like winter later in the month that does teleconnect to a Southeast Ridge. Although I wish other guidance showed it, the low frequency forcing has frequently flared up around 120E this fall, which may point to the GFS solution having some validity. This would somewhat prolong cold risks, probably focused around the second week of the month, before trending milder late in the month.
The CFS weeklies have consistently appeared to develop a robust, eastward propagating MJO for mid-late December that may get into the western Pacific in early January. While the EPS mean VP anomalies focus mostly over the Indian Ocean on the most recent weeklies, a majority of members have a coherent MJO signal at some point beginning mid-late December. The low frequency forcing amplifies this signal over the Indian Ocean and there’s quite a bit of disagreement on timing at this point, so the ensemble mean looks like a standing wave over the Indian Ocean with no MJO activity, but that likely isn’t realistic. An amplified MJO moving across the Indian Ocean would bring a warmer signal to the eastern U.S. as it occurred, but could lead to a cool-down at some point (likely towards mid January) for the eastern U.S. as it attempts to emerge over the Pacific. This would have ramifications on the January forecast.
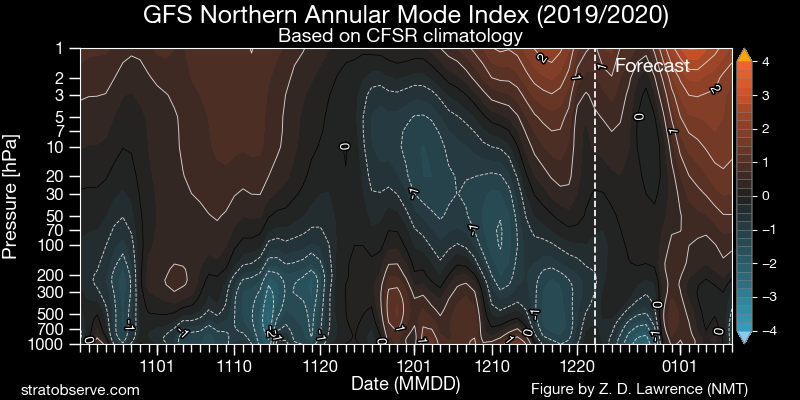
Thoughts on the polar vortex into December / beyond:
As referenced above, the polar vortex is quite strong, but not well-coupled with the troposphere yet, and is occasionally getting knocked around and stretched a bit. So, while it is currently a signal for mild weather, it’s not an entirely hopeless proposition for it to weaken at some point as it was last January – March. The pattern showing up somewhat consistently on guidance the rest of November into early December is likely a more favorable pattern for disrupting the polar vortex than what we saw early this month.

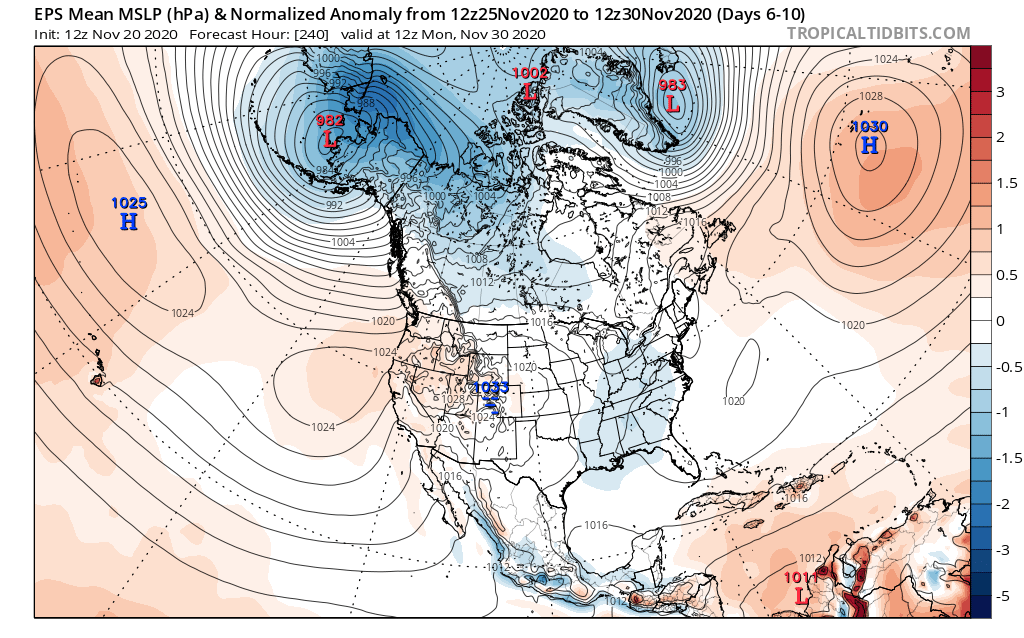
The CFS is shown, though the EPS and GEFS have occasionally had the look of an Aleutian low and Scandinavian-Ural high as well. These are both features that stand out on composites of the precursor tropospheric pattern to SSW events:
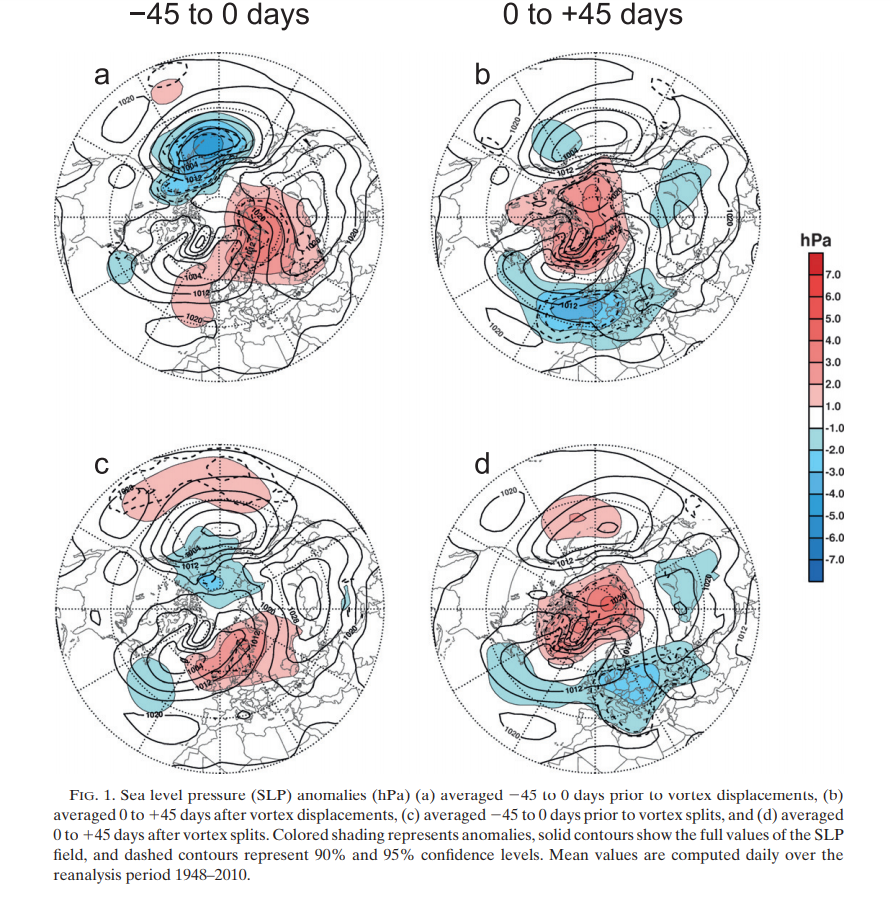
A is the proceeding pattern in the 45 days prior to a vortex split, C is the pattern in the 45 days prior to a displacement. Both similar, though the Aleutian low and Scandinavian ridge are more amplified proceeding the splits. Another set of maps from the same paper shows similar

Here is a link to the paper: http://web.mit.edu/jlcohen/www/papers/CohenandJones_JC12.pdf
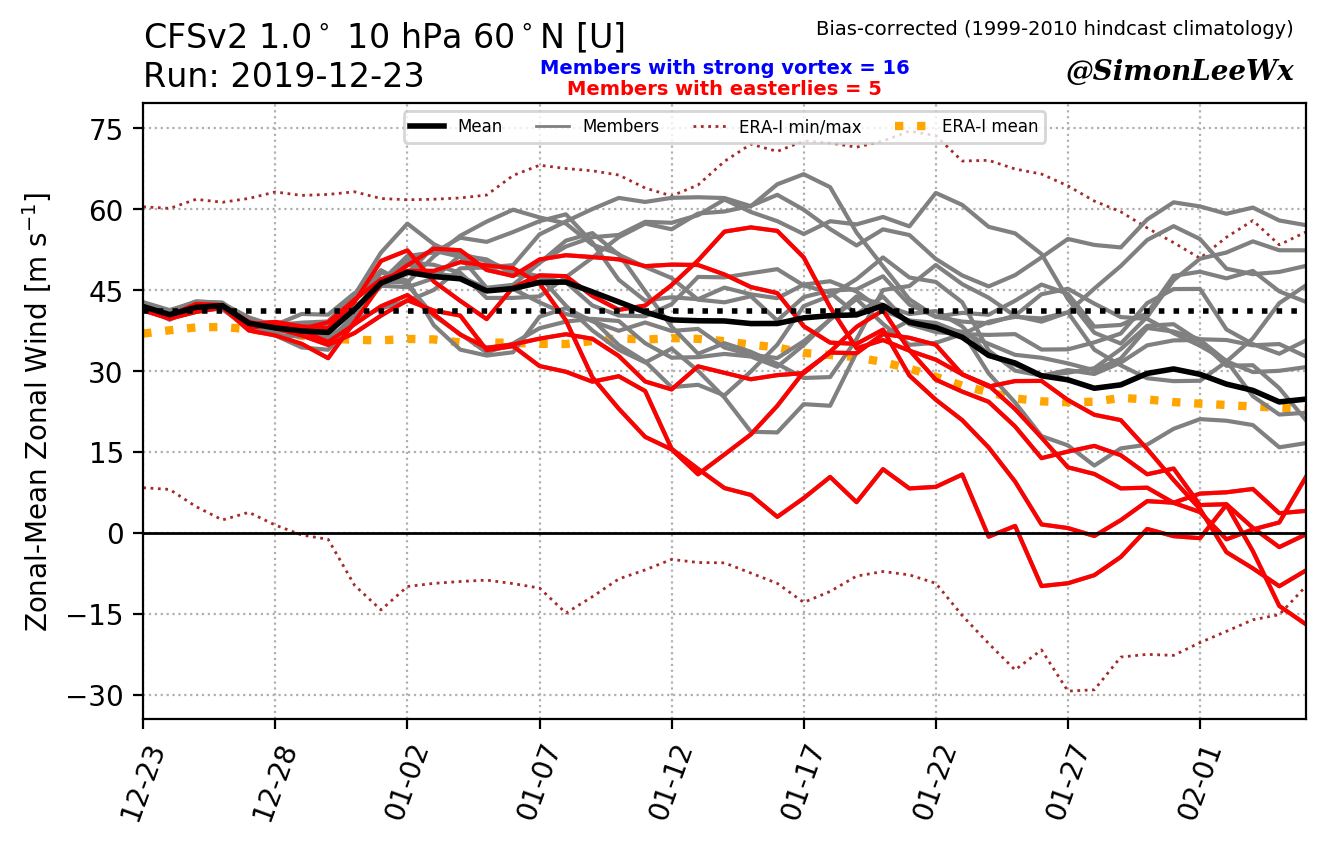
The polar vortex will again be quite strong in the short-medium term, but runs of some longer range guidance over the last week or so has slowly opened the door to some weakening mid-late December…shown are the CFS, GEFS and EPS:


CFS and GEFS PV plots from https://simonleewx.com/

My thought is the PV will weaken at least some in mid-late December, though I don’t think a SSW is likely before the New Year unless we set off more tropospheric blocking in the shorter term. I do think that the ridge across the Urals supporting continued opportunities for +EAMT in December, and the possibility of another more robust MJO between mid-December and mid-January, may give a window for a SSW to occur in January. I think after that, typical Nina forcing would favor the PV strengthening into February if it isn’t significantly weakened by mid-late January. A 2018 outcome where the La Nina weakens late in the winter and the MJO becomes active would then be the only hope for a PV disruption later in the season.
So, I see two clear opportunities to weaken the PV in December into the first half of January. If this successfully occurs, an MJO propagation into the Pacific in January could provide for a temporary colder and blocky pattern to start 2021, with the +PMM leading to some continued STJ activity. After that, the PV may very well get strong and coincide with a return to Indian Ocean forcing to provide for significantly milder weather heading into February. This is followed by an outside shot at a prayer to end the season if we can get one more coherent MJO as the La Nina begins to fade.
Putting it all together…the forecast:
December:
A +PNA to end November and start December leads to a very mild / warm start to the month across the CONUS (slightly cooler over the Southeast / East Coast)…however, an active STJ and a wavier pattern than the ensemble means will show at this distance may allow for enough polar influence for an opportunity or two at a winter storm across the central or eastern U.S. Given the +PNA and active STJ, this may occur in areas such as the Ohio / Tennessee Valley, Appalachians, Southeast or Mid-Atlantic, farther south than what you may expect in a La Nina and more typical of an El Nino. A +PNA, split flow, and active STJ are features that are frequently seen in an El Nino!
This window is brief, the first week or so of the month and with a questionable amount of polar air to work with, so it may not work, but there should be a bit to track on the models as this comes into range. Thereafter, the SPV moving away from Alaska, persistent +EAMT, and convection getting into the 120-150E area (and likely persisting a bit more as the GEFS has due to the lower frequency forcing in that region this fall) likely allows for a window of -EPO, and a pattern more typical of a December La Nina. I think there’s still enough momentum in the Pacific jet that this dumps into the Midwest and Northeast as opposed to the Rockies and Plains as typically occurs with EPO shots.
This trends towards cold edging towards the Northwest / northern Rockies into late December, with a Southeast Ridge cropping back up due to forcing becoming more focused on the Indian Ocean, and due to Indonesian convection beginning to teleconnect to a Southeast Ridge in later December.
With the start of end of December quite possibly warm for a large portion of the country, the month as a whole will be mild across the CONUS.
While I think the NAO likely ends up positive for the month, if we take advantage of the potential to develop a -NAO in early or mid-December, it would up the ante for snow in the Northeast and Mid Atlantic in that window, and may slow the warm-up later in the month. Even without a -NAO, I think there are opportunities for some snow in December in the central and eastern U.S. (even the southwest may have a window with the STJ, the NW and Rockies will be active and trend colder later in the month as well).
January:
January may start cold in the Northwest U.S. and warm across the southern and eastern U.S. However, I think the MJO has another opportunity to propagate east during the first half of the month. I believe the PV will be weaker and more receptive to the MJO producing a blocking response than it is in early December. This may cause another period of -EPO, -NAO, and a somewhat active sub-tropical jet for a couple of weeks starting the first or second week of January. This will bring another window of winter farther southeast towards the Ohio Valley, Mid-Atlantic, and perhaps even the Southeast.
I think we start trending towards a Southeast ridge later in January as the MJO fades and Indian Ocean forcing crops back up. How much blocking develops in the first half of January will of course influence how quickly this warm-up occurs.
February:
This is generally the warmest month in the analogs, with an amped central Pacific ridge dumping cold into Alaska, western Canada, and the northwest / north-central CONUS. If we have persistent Indian Ocean forcing and a strengthening PV to open the month, that will probably be the case again this year. If there’s cold available in Canada, the +NAO may lead to confluence east of New England that leads to high pressure over eastern Canada that can cause cold air to seep down into New England and perhaps the Great Lakes in February, causing some wintry threats in these areas…however, the pattern I envision for February is not snow-friendly in the Ohio Valley, and especially the Southeast and Mid-Atlantic.
March:
Cold air likely remains available in Canada, so if the MJO becomes active again in late-February or March it may shake-up the pattern enough to bring it south and bring one last shot of winter in March. If this does not occur early enough, the Southeast Ridge dominates much of March and keeps the cold over the Northwest, Plains, and Midwest / northern Great Lakes / northern New England.
Teleconnection Guesses:
AO: Generally positive, but may go neutral or negative briefly in early-mid December, and perhaps a bit more legitimately in January
NAO: Generally positive, may briefly go negative in early-mid December, with greater potential for a couple-few weeks of a variable / negative at times NAO in January
PNA: Negative
EPO: Generally somewhat positive, but will dip at times. Mid December and perhaps mid-late January may offer windows.


 ‘
‘