11/12/14: First Lake Effect in NE Ohio Thursday-Friday, Locally Heavy

November 13-14, 2014 Lake Effect Event

snow 11-13 no cities

The first of hopefully many this winter…and hopefully not my first ill-fated forecast.

Brief summary:

Tough forecast due to questions about snow band organization/location and due to marginal temps in lower elevations, especially closer to Lake Erie. However, good moisture and instability, combined with a disturbance moving by Thursday into Thursday night, suggest heavy snow showers at times where they occur. In general, I expect a band of snow to develop in the northern primary snowbelt Thursday morning and afternoon, mainly along and north of route 6 in extreme northeastern Cuyahoga, northern Geauga, Lake, and Ashtabula Counties. Snow rates in excess of 1” per hour may occur at times, and the snow will likely be wet, with graupel possibly mixed in at times. The question will be if this band can sustain and where exactly it’s located. I expect this band to possibly become disorganized by mid-afternoon as the winds begin shifting as a trough begins to move by. At this point, the band may swing farther south and eventually weaken. However, as it “swings” late Thursday afternoon and evening, it may produce a period of heavy snow and some quick accumulations along the way. For the rest of Thursday night I expect more disorganized snow showers to persist generally from Cuyahoga County eastward, with light additional accumulations. This general snow shower pattern likely continues into Friday. It is possible that another band develops Friday afternoon/evening as the winds begin to shift to a more westerly direction, and this band may produce moderate to heavy snow for a time Friday afternoon or evening from Cuyahoga County east. Again though, questions remain about where exactly this band forms and how organized it is. By Saturday morning, the lake effect should be shifting out over the lake. Hardest hit areas may see up to 8”, especially if one or both of these possible bands work out, with lesser elsewhere. In general, outside of where any bands occur, the snow showers may be briefly heavy but won’t be sustained, which should keep accumulations to a few inches or less outside of where these two possible bands occur.

Technical discussion:

This is a tough forecast for a few reasons…I believe there are a couple of time periods where decent bands may be possible, but how sustained these bands are and where exactly they occur will determine who sees the most accumulations, and how heavy they are.

Overall, lake effect parameters become decent by Thursday morning. Lake induced instability will become moderate around 7AM and become extreme at times for Thursday through a good portion of Friday, with inversions rising to 10-11k feet by Thursday afternoon and remaining high through Friday. In addition, some synoptic moisture/lift will overspread the area Thursday morning, with moisture levels remaining mediocre to good through Friday evening. Here’s the NAM RH for CLE:

NAM RH

The big question is wind direction and possible band formation. I’ll throw up the NAM low level winds and go from there:

NAM wind

The winds begin to back a little bit during the morning on Thursday as a surface trough approaches from the northwest, and this coincides with when instability begins to become decent and when synoptic moisture/lift overspread the area. I believe the backing of the low level winds ahead of the surface trough will increase convergence enough over the central lakeshore and snowbelt to get a band to form around rush hour or just after, and conditions look favorable for it to become intense by late morning. The GFS never really shows a southerly component to the surface winds, but the NAM and most hi-res models do, and the Euro appears to as well for a time late Thursday morning into the afternoon. I’m inclined to believe the hi-res models and Euro here as they may do a better job of capturing the effects of the lake on the low level wind fields. This suggests that any band may line up in extreme northeastern Cuyahoga County, Lake, northern Geauga and Ashtabula Counties, possibly near or north of route 6. If the GFS winds verify, it may occur closer to 322, but I’m skeptical. If this band persists for a few hours, it may produce 2-4” beneath it just inland.

The winds then begin veering a bit towards evening as the surface trough goes by. This would cause any band to swing southwest and possible affect areas as far west as northern Lorain County and as far south as parts of northern Medina/Summit/Portage Counties. As the band swings, it may produce a quick burst of accumulating snows along its way. Lake effect parameters will be very favorable tomorrow evening, so if we do get a band swinging south, a quick 1-2” as it goes wouldn’t shock me. The hi-res models also suggest the strongest Lake Michigan connection during the evening hours, which further improves the chances for very intense snow squalls for a time, but with the band being on the move at this point I’m not sure how organized/long lasting they’ll be.

Uncertainty becomes pretty high Thursday night into Friday morning. Lake effect conditions will be very good and the winds will become very well aligned again, but I think the winds may take on too much of a northerly component to sustain a primary band. Some models show a real diminishing in the snow in this time frame which is possible, but I think that with a possible Lake Michigan connection continuing that at least scattered snow showers/a few squalls can continue overnight Thursday night into Friday morning, even if they aren’t very organized. This would probably produce another couple inches of accumulation inland for anyone affected. The winds will be well aligned so it’s not impossible that any band possibly re-stabilizes farther south across Cuyahoga County east into more of southern Geauga/northern Portage into Trumbull Counties, but I’m not really confident. It seems hard to get a band to re-establish immediately behind a trough when the winds take on a northerly component, especially when the wind shift happens pretty quickly. If the convergence hugs the lakeshore a bit longer then I suppose it’s possible. If this “best case scenario” happens, then a few inches may fall Thursday night into Friday morning across a good portion of Cuyahoga County (especially inland) points east. But, I’m currently leaning against this happening on a significant level, and am just expected light accumulations overnight Thursday night into Friday morning.

By Friday afternoon and evening, surface ridging begins moving in from the southwest and winds slowly back again. This often causes convergence to re-intensify just inland from Lake Erie, and may cause a band to redevelop across northern/eastern Cuyahoga County east into the snowbelt. As can be seen above, moisture doesn’t become too limited until after midnight Friday night, so if this band re-develops another couple or even few inches may occur. Things should begin winding down after midnight Friday night, and by Saturday morning most of the lake effect should shift out over the lake and towards western NY.

So, here’s what I did for accumulations: For the higher terrain in far southern Lake County into far northern Geauga County I figured 2-4” on Thursday under a band. Honestly, this has high bust potential either way, depending on where any band goes. With the snow rates I expect under any band on Thursday if it can develop, 2-4” isn’t unreasonable if any band persists for a few hours. If the band is closer to the lake, then more substantial accums may also occur in a narrow corridor under the band down to the lakeshore. Elsewhere, I figured a quick 1-2” Thursday evening as the surface trough passes and the band swings southwest and eventually weakens. If there is a good burst of snow showers as the trough passes, snow can probably accumulate a bit down to the shoreline. Since I’m betting against the band re-stabilizing overnight Thursday night into Friday, I didn’t add any more accums to southern Cuyahoga County, and figured an additional inch or two in the inland primary snowbelt Thursday night into Friday. This pushes totals to 2-4” for most of the primary snowbelt and 3-6” in the higher terrain in northern Geauga/far southern Lake County. For Friday afternoon and evening, I figured another 1-2” in eastern Cuyahoga County east into the primary snowbelt due to perhaps a last gasp as convergence increases due to high pressure building in from the southwest. This pushes most areas to their final totals on the map. Again though, it’s possible that this band over-performs and produces up to a few inches, or just doesn’t happen, which would cause the low end totals on the map to be more common than the high end total. I think these totals would be low if a more sustained band develops out of either “band potential”, so we’ll see. Banding prospects look very iffy IMO overnight Thursday night into Friday morning, but if a band occurs, then the southwestern portions would see higher accums as well.

Model breakdown:

12km NAM: Shows good banding both timeframes, widespread 0.5”+ QPF from eastern Cuyahoga east into the snowbelt. Also shows better QPF in southern/western Cuyahoga as it does hang on to more of a band Thursday night into Friday morning.

4km NAM: Similar to 12km NAM, slightly higher QPF in eastern Cuyahoga/western Geauga.

NMM: Shows good band in my highest accums area tomorrow, and a widespread 0.5-1” of QPF from eastern Cuyahoga County east.

ARW: Shows good band tomorrow, but slightly closer to lakeshore. 1-2” QPF in parts of Lake/Ashtabula Counties, generally 0.5”-1” QPF in the rest of the primary snowbelt. Shows a band hugging the western lakeshore Thursday evening, dropping around 0.5” QPF there.

BUF WRF’s: Slightly different ideas, but most of them like the band tomorrow morning in southern Lake/northern Geauga/possibly NE Cuyahoga east into Ashtabula, and some try to show intense snow showers (nothing too organized though) developing behind the trough passage by Thursday evening.

Posted in Uncategorized | Leave a comment

11/11/14: Heavy Lake Effect Looking Increasingly Possible Thursday-Friday East of Cleveland

Brief description:

We are still a couple days away from any potential event and some things may change, however this type of scenario has been shown consistently since Friday night in most of our forecast computer models, which gives me decent confidence something like this will play out.

LES 11-13 to 14 prelim

A few lake effect rain/snow showers may occur on Wednesday east of Cleveland with no accumulations. A few lake effect snow showers may occur Wednesday night east of Cleveland with accumulations of less than half an inch. The snow showers through Wednesday night will be light due to a dry atmosphere. On Thursday, a disturbance will begin approaching the region, increasing moisture levels and also making the atmosphere more unstable over Lake Erie, resulting in an increase in snow shower intensity. Conditions then look favorable for good lake effect snows through Thursday night and into Friday. It looks increasingly likely that a band of heavier snow will develop on Thursday across northeastern Cuyahoga County east into southern Lake, much of Geauga and a good portion of Ashtabula Counties. This band will likely sag south into more of Cuyahoga County and Trumbull County Thursday night before the lake effect gradually becomes a bit more disorganized by Friday morning due to a shift in the wind direction. Light to moderate lake effect snow may persist on Friday across southern and eastern Cuyahoga County east into Geauga, inland Ashtabula and northern Trumbull Counties. At some point, some lighter snow showers may also affect parts of Lorain, northern Medina, most of Summit, most of Portage and most of Mahoning Counties Thursday night into Friday. If a heavy snow band develops on Thursday, the Thursday PM commute would be rough on the east side. The Friday AM commute may also be affected to an extent.

If a good band of snow sets up like I think is becoming a better bet to happen, accumulations from eastern Cuyahoga County east into the Snowbelt in excess of 6” may be possible, especially north of US 422 and along and east of I-271. Outside of this area, “plowable” amounts of a couple inches or so look possible, with amounts then quickly dropping off to little to none farther south and west.

Technical Discussion:

Although cold air flows in on Wednesday with a westerly flow, limited moisture and low equilibrium levels will prohibit any lake effect of consequence through Wednesday night. It will be cold enough for any snow that does fall to perhaps produce a dusting in the primary Snowbelt Wednesday night with 850mb temps falling to -10C by Thursday morning and overnight lows below freezing for most anyone away from Lake Erie.

It gets more interesting on Thursday as a shortwave begins approaching, which will increase the moisture in the low levels of the atmosphere and also increase convergence across the snowbelt, possibly focusing a good band of snow. With 850mb temps of -10 to -12C on Thursday, and 700mb temps falling to around -20C by Thursday afternoon, lake induced instability will be moderate to extreme (lake temps of around 11C/52F), with BUFKIT spitting out around 700 J/KG of lake induced CAPE Thursday afternoon through early Friday. In addition, speed and directional shear over the lake look very minimal Thursday through the first half of Friday. With equilibrium levels pushing 10k feet for most of this time period and high RH air extending to varying levels, but typically at least 5,000 feet above ground level and at times up to 10,000 feet above ground level, there will be sufficient depth to the moisture and instability for heavy snow, especially if a good convergence/primary band can develop Thursday into Thursday night on the east side of Cleveland into the primary snowbelt.

Equilibrium levels and moisture depth slowly degrade on Friday, but at least light to moderate snow showers could continue for a good chunk of the day mainly in the eastern suburbs into the primary snowbelt.

The models are all in pretty good agreement in showing a shortwave trough passing overhead Thursday evening, with a surface trough also dropping across the lake at some point Thursday night with a wind shift from more westerly on Thursday to more WNW or even NW for a time Friday morning. Winds will be mainly WNW on Friday as ridging begins building in from the southwest. Shortwaves are often good for an increase in lake effect snow intensity due to the fact that they often bring an increase in moisture, cooler mid-level temperatures (more instability over the lake), and often a brief shot of large scale lift. In addition, in my disorganized research and tedious observations over the last several years, I have found that a convergence/primary band is most likely to develop over the central lakeshore east into the primary snowbelt in a W or WNW flow ahead of a surface trough, until the trough begins pushing inland from the lake. This is due to subtle pressure falls ahead of the surface trough resulting in winds backing ahead of it, in addition to the pull of friction over land resulting in slightly more backed surface winds. Over the lake, winds at the top of the boundary layer often have a more northerly component, and these winds mix down to the surface over the lake due to the instability over the lake and lack of friction over the lake. This results in more northerly winds over the lake running into winds that are more backed over land, causing convergence near the lakeshore. This is maximized with a W to WNW flow for the central lakeshore east into the primary snowbelt due to that flow paralleling the western and central lakeshore in northern Ohio.

Regardless, the shortwave approaching is a good sign for an organized band developing on Thursday. With a due west or slightly north of due west wind ahead of the shortwave, any band would likely affect northeastern Cuyahoga County (just east of Cleveland east into the eastern suburbs north of US 422) east into Geauga, southern Lake, Ashtabula and perhaps northern Trumbull Counties. This band may persist for several hours Thursday into Thursday night. As the trough pushes inland at some point Thursday night, the band would sag southwest before gradually weakening. Convergence may increase for a time Friday afternoon across the primary snowbelt as higher pressure builds in from the southwest, however lake effect conditions will be a bit more marginal by this point. With pretty good lake effect parameters, heavy snow would be likely at times in any band. With surface temps near freezing during the day Thursday and below freezing by a little bit at night, and 850mb temps of colder than -10C, accumulating snows would be extremely likely under any banding during the day and at night inland, and possible down to the lake if good snow rates can be sustained there. Given the potential duration of the band (12 hours from Thursday morning through Thursday evening as it looks now, before sagging south/weakening later Thursday night), and possibly heavy rates beneath it, a corridor of 6”+ of snow is a possibility from eastern Cuyahoga County east into the primary snowbelt. Lesser amounts will occur farther south and west as the band sags south and weakens later Thursday night. Light to moderate, but likely more disorganized snow showers continuing on Friday may add light amounts in the primary snowbelt.

Preliminary look at parameters, via the NAM in BUFKIT (the GFS isn’t much different):

18z Thursday/1PM EDT:

BUFKIT 1

Moderate lake induced instability, with EL’s surpassing 10k feet. Moisture is still a bit limited, but probably wouldn’t be prohibitive if a good band develops. Note the well aligned west to slightly north of due west flow below about 7.5k feet. Winds speeds also aren’t too strong, which is good.

0z Friday/7PM Thursday EDT:

BUFKIT 2

Extreme lake induced instability, with EL’s still hanging just above 10k feet. Good moisture as well to about 9k feet, with winds still well aligned and not prohibitively strong. This would support moderate to heavy snow in any band.

6z Friday/1AM EDT:

BUFKIT 3

Moderate lake induced instability, with good moisture to about 7k feet still. The winds are still very well aligned and not very strong, but have gained a bit of a northerly component, suggesting any band shifting a bit farther southwest at this point.

12z Friday/7AM EDT:

BUFKIT 4

Extreme lake induced instability, with good moisture still to 7-8k feet. Winds not quite as well aligned and have gained a slightly stronger northerly component, which may cause any band to possibly weaken by Friday morning. In general though, this is still a decent lake effect snow sounding for the eastern suburbs and primary Snowbelt.

We’ll see how this plays out over the next couple of days and if there are any changes.

Jim

Posted in Uncategorized | Leave a comment

11/8/14: Winter Storm Coming for Upper Midwest, Upper Great Lakes

EDD

A large corridor of winter storm watches and warnings and winter weather advisories has been issued from Montana and the higher elevations of Wyoming east across parts of South Dakota, North Dakota, central and southern Minnesota into northern Wisconsin and much of the Upper Peninsula of Michigan for a swath of moderate to heavy snow that is expected to fall starting on Sunday in Montana and Monday night in areas as far east as Michigan, and last through Tuesday in the Upper Peninsula of Michigan.

This swath of snow will be caused by an area of low pressure tracking from the central Plains northeast into central Michigan along an arctic frontal boundary pushing south into the central US. The Euro shows this low gaining steam in the Plains on Monday morning:

Euro 1

Note the extremely strong temperature gradient from one side of the low to another, which will contribute to favorable mid-level “frontogenesis” along the low track, which is a source of lift that may cause a fairly prolonged period of moderate to heavy snow in some areas.

By the time we hit Tuesday morning, the low pressure has weakened some, however it still has a pretty strong temperature gradient along the front to work with, and is still expected to be producing a good amount of snow on the north side of the low track:

Euro 2

In addition to lift along the front as warm, moist air from the south gets lifted over the cold air in the low levels of the atmosphere to the north of the low pressure track, there will also be good lift from a “jet streak” within the jet stream. This image from this evening’s NAM run shows wind racing away from parts of Wisconsin and Michigan, which forces air to rise from below to replace the air rushing away, which is another source of lift for possible heavy snow:

NAM 250

In addition, on the below image, also from this evening’s NAM run, you can see strong lift in the mid-levels of the atmosphere on Monday morning in the left image and Tuesday morning in the right image. You can cross reference this to the Euro model images above, and see that the area of lift in the mid-levels matches the temperature gradient pretty well (it occurs a bit farther north on this model because it is slightly farther north with the low track, and also because this is a higher level ~10,000 feet vs ~5,000 feet in the atmosphere than shown in the Euro temperature maps above):

NAM 700

This all adds up to a period of moderate to heavy snow over a pretty decent swath of real-estate across the north-central US Sunday night through Tuesday as this low pressure goes by. A swath of 6-12” snow amounts look likely in the hardest hit areas, and locally higher amounts in excess of 15” aren’t impossible, especially if the storm is slightly stronger like the NAM shows, so this will be a pretty significant first major snowstorm of the season for these areas.

Here are NOAA’s Weather Prediction Center snowfall probabilities from Sunday evening through Monday evening:

HPC day 2

Here are the snowfall probabilities for Monday evening through Tuesday evening:

HPC day 3

Get ready in these areas for the first major snowstorm of the season! Stay tuned over the next couple of days for more looks at a possible eastern US snow threat late this week into the weekend.

-Jim

Posted in Uncategorized | Leave a comment

11/8/14 AM Update: Weather Pattern Supports Possible Snow in East Late Week or Weekend, Questions if Pattern Will Deliver

ECM ENS 1

WOW. The first image, showing this Friday afternoon’s European ensemble upper level weather pattern (500mb level) for next Friday is a classic cold pattern with extreme “blocking” in the high latitudes. A low south of the Aleutian Islands is pumping up a ridge of high pressure on the West Coast, called a “+PNA,” and that high pressure extends extremely far north, and consequently causes the “EPO” to become negative. In addition, some ridging is also developing over Greenland, which is beginning to turn the “NAO” negative by the end of the week. All of this “blocking” of the jet stream in the high latitudes causes the jet stream to plunge south well into the central and eastern US, causing unseasonably cold air to flood the eastern 2/3rds of the country for the second half of this upcoming week and into next weekend.

This pattern is also one that may produce snow over the eastern US late this week into next weekend, IF certain pieces fall into line. On the first image, there are two ripples in the jet stream that I keyed in on. The first one is located over the eastern Great Lakes Friday morning, and the second one is over the southwestern US. On the second image, valid Sunday morning, you can see that strong high latitude blocking is persisting, and the second ripple in the jet stream is rounding the base of the trough in the central US, and getting ready to move northeast.

ECM ENS 2

Our “deterministic” models, the GFS, Canadian, and Euro, have shown some snow potential with both of these ripples off and on, but in general have been all over the place. Considering this is all over a week out, that’s not a huge shock. However, the signal on the ensembles (shown in these images) and the overall pattern is interesting. The question with wave one, in my opinion, is will it be robust enough to develop a strong storm over the Eastern US on its own? Even though there is a lot of high latitude blocking to force the cold into the central and eastern US, the trough looks pretty “broad,” and there is no “50/50 low” over the Nova Scotia/Newfoundland at this point, which results in the flow over the eastern US and northwest Atlantic being very fast on Friday. This argues against a strong storm developing from “threat 1.” However, we will have to monitor the potential for some snow across the northern Mid Atlantic or New England from “threat 1” for Thursday or Friday if the ripple in the jet stream is more robust, and is able to develop a strong storm without being forced to slow down due to the lack of a 50/50 low.

The second threat may have a bit more room to work with. If “threat 1” is able to intensify either over the Northeast or after it moves off the East Coast, it may act as our 50/50 low for the latter portions of next weekend, which is a more favorable look for snow over the eastern US. In addition, note how the trough with all of the cold over the central US is much “sharper” looking in the second image, which is a more favorable look for a bigger storm developing. Where exactly the second storm tracks if it develops is uncertain, because there will be a bit of a “Southeast Ridge” in place, however the pattern appears to be generally favorable for any possible storm that develops with “threat 2” around Sunday November 16th to produce snow somewhere over the Eastern US (whether that occurs closer to the coast or a bit farther west is unknown).

The models agree on lots of cold this week, but then become very messy when trying to pick out a possible storm and threat for snow later in the week and into next weekend. The evolution of the pattern looks interesting however, especially for threat 2 around November 16. Threat 1 seems a little less likely to occur, but I still wouldn’t completely write it off over the far northern Mid Atlantic and parts of New England quite yet.

Posted in Uncategorized | Leave a comment

11/6/14: Big Cold Next Week, Possible Storm Monday/Tuesday in Midwest/Great Lakes

The much anticipated blast of cold air is starting to arrive today across parts of the Plains, Midwest and Great Lakes, and will spill east into the Northeast to start the weekend. A bigger blast will arrive next week, and the potential appears to be growing for a swath of light to moderate snow accumulations across the Midwest and Great Lakes with a low pressure system that develops along the cold front associated with this blast of chilly air Monday into Tuesday:

Euro 1

In this post I’m going to look at what this afternoon’s European model and its ensembles say about the pattern and possible storm. The first image shows the European model valid Monday morning, and is looking at the upper level weather pattern across the continent. As advertised, a large low pressure system (remants of a Super Typhoon) over the Bearing Sea is shown to cause a large upper level high pressure system to develop over the West Coast and north into far Northern Canada. This forces very cold air to plunge east into central Canada and eventually the central US next week. There are several features that will influence if and where a possible storm develops on the front edge of this cold air for Monday and Tuesday across the central US into the Great Lakes; the position of two upper lows, one near James Bay in this image and another south of Iceland, and the position of two pieces of energy (labelled 1 and 2) moving across the Rockies and dropping in from Canada on Monday.

Euro 2

The second image shows what the upper level pattern looks like Tuesday morning on the European model. The expansive high pressure over the western parts of the continent is causing the cold air to begin plunging into more of the central US by this point. Piece of energy number 1, which will bring the brunt of the cold, has moved into North Dakota by this point, and piece of energy number 2 is located just southeast of it. Because the European model moves the upper low near James Bay on Monday east far enough and shows “#1” diving into the US as far west as North Dakota, the southwesterly flow ahead of “#1” allows some warmer air to build farther north. This allows “#2”, which may spark our storm system, to track farther north. The resulting surface map for Tuesday morning is shown in the third image. Note how any snow is mainly confined to the upper Midwest and upper Great Lakes.

Euro 3

The European ensembles have a slightly different take on the situation in the fourth image, valid Tuesday morning. They drop #1 farther east, into Minnesota by Tuesday morning, which forces #2 and our possible storm to track farther southeast, which gives snow possibly as far south as Chicago and Detroit. Because #1 drops down farther east, the large upper low moving from James Bay to Nova Scotia between Monday and Tuesday mornings is close enough to #1 to prevent warm air from surging as far north ahead of it, which results in the farther south and colder solution. In general, the GFS agrees with the farther south and colder solution, and is even farther south than the European ensembles. The Canadian model is closer to the European model, and shows a more northern storm track.

ECM ENS 1

ECM ENS 2

So, we have a good range of solutions on the table for early next week’s possible snow in parts of the Midwest and Great Lakes, which is to be expected several days out. Although the European model and its ensembles are trying to develop a bit of a thumb ridge in the northern Atlantic towards Greenland, the NAO isn’t really negative, so a solution in which the storm occurs farther northwest isn’t impossible. At this point, the models are agreeing on a swath of snow somewhere in the Midwest into the Great Lakes Monday night and into Tuesday, and due to the models showing a stronger “#2” over the last day or so, I believe that the idea is gaining traction. However, where it occurs is uncertain. I’m inclined to go with the slightly farther south solution which may mean snow closer to Chicago and Detroit Monday night into Tuesday due to the upper level low near Iceland possibly helping to “block up” the pattern a bit and keep the upper level low over James Bay on Monday from moving east as fast, but with no true –NAO block (high pressure over Greenland), that’s no sure thing yet.

We will have updates on this possible Midwest and Great Lakes snow over the next few days, and will have a look at other impacts from the cold later next week and the pattern farther down the road either later tonight or tomorrow.

Posted in Uncategorized | Leave a comment

11/4/14: Signal for Big Early Season Chill Still Looks Good

On November 2nd, I commented (on Facebook) that there was a strengthening signal for a period of unseasonably cold weather across the Midwest, Great Lakes, Ohio Valley, and Northeastern US starting late this week and persisting for at least two weeks. As we move closer, that cold signal is still present on our models. Before we get into the specifics, let’s look at the large scale pattern expected to play out starting this week:

GEFS telleconnections

The GFS ensemble teleconnection graphs (above) are showing 3 of our major teleconnections all giving a cold signal for the eastern half of the US starting very soon. The NAO (North Atlantic Oscillation) is expected to drop negative this weekend, before slowly rebounding later next week. This corresponds to upper level high pressure over the Northwestern Atlantic. Upper level high pressure here causes the jet stream to “buckle” over the eastern US and drop south, bringing cold south with it. The AO (Arctic Oscillation) is expected to drop strongly negative this week, before slowly rebounding towards mid-month. This corresponds to upper level high pressure over the polar regions, which forces the jet stream south, and brings cold south with it. The PNA (Pacific North America) is expected to go positive tomorrow and remain positive for the next two weeks. This signifies upper level high pressure on the West Coast, causing the jet stream to go over that high pressure, before dropping south into the eastern US. All three of these “teleconnections” point to the jet stream dipping well south over the eastern US and bringing cold with it starting late this week, and peaking next week.

ECM ENS 120

The European ensembles (above) show a very similar pattern, with a +PNA, strong –AO (the position of that high pressure over NW Canada can also qualify as a –EPO too), and –NAO, with a large upper level trough with cold weather over the eastern US this weekend. The extremely strong low pressure over the Bearing Sea is going to be driven by a recurving Typhoon this weekend, and is what will drive the ridging over western North America.

This cold will come in a couple of waves; the first one this weekend, and the second one during the first half of next week.

ECM ENS 72

The first cool down (above) won’t be the most intense, as the strong –AO/-EPO, that will allow truly arctic air into Canada, will still just be getting established. Regardless, much cooler than normal weather will return to parts of the Midwest, Great Lakes, Ohio Valley, and Northeast by Friday. There is still some possibility of a low pressure system developing in time to give parts of northern and eastern New England some accumulating snow as this low passes by Thursday night into Friday, especially in the higher terrain. As can be seen on the left side of the image, the “trough” associated with the cool down is neutrally tilted (north-south orientation)…however, you can see two pieces of energy in this trough nearby, one just north of Lake Ontario, and one over western New England. If these two pieces of energy combine right, or “phase,” then a more significant winter storm would be possible for parts of northern and eastern New England. It may get cold enough for some accumulating lake effect snows in the eastern Great Lakes as well for a time Thursday night through Friday.

A clipper system may reinforce this cold air a bit on Sunday across the region, and perhaps bring some light snows to parts of the Upper Midwest, northern Great Lakes, and New England in the process. The big cold shot however will come during the first half of next week, and likely persist through most of the work-week. This is when the ridging over the western parts of the continent will be most enhanced by the recurving Typhoon over the western Pacific.

ECM 850 6-10

The European ensembles (above) show a large area of MUCH colder than average weather across all of the Upper Plains, Midwest, Great Lakes, Ohio Valley, Northeast and into the Mid Atlantic in the 6-10 day timeframe (next work-week). This type of cold would possibly spark off the first significant lake effect snows of the season off of all of the Great Lakes, however key details such as wind direction, which determines exactly who gets the lake effect snow, are still to be determined. The GFS, Euro and Canadian models are also suggesting that a winter storm may develop over parts of the Midwest/Great Lakes next Monday and Tuesday as this larger surge of cold initially dives into the Plains and Upper Midwest. This isn’t impossible, due to the cold air diving in to the west of the region (a storm often forms south and east of cold air diving into the US), so we will keep tabs on potential snow in those areas early next week too as the cold air dives down.

Lots to talk about, so keep checking back in! –Jim Sullivan

Posted in Uncategorized | Leave a comment

Jim Sullivan’s 2014-2015 Winter Outlook for the US and Southern Canada

For reference, here’s a link to my outlook for 2013-14 (links to past outlooks can be found through there)

https://ohwxramblings.wordpress.com/2013/08/21/winter-2013-2014-an-early-look/

Winter 2014-15 outlook maps:

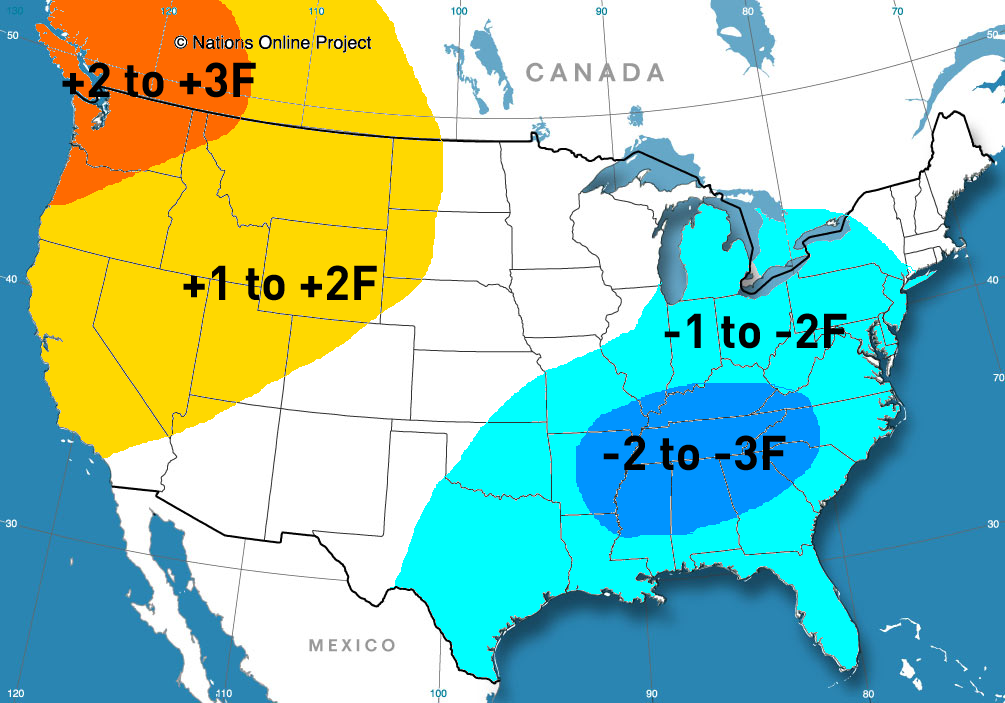
Expected temperature departures from normal for December, January, and February (overall, meaning an average of the whole winter):

winter 13-14 temps

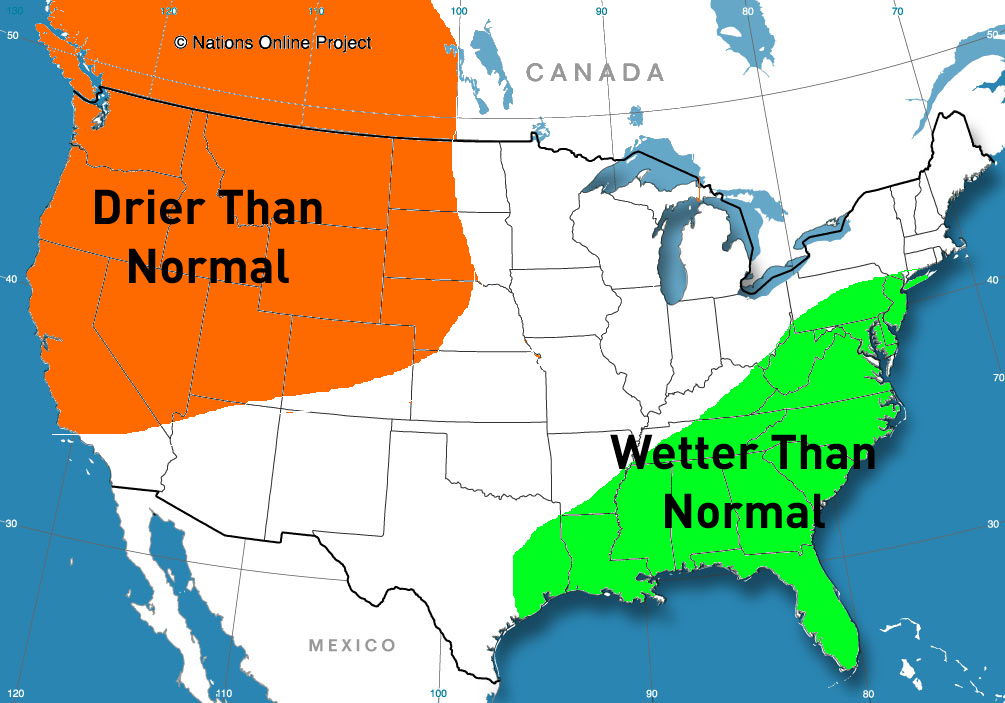
Overall winter precipitation:

winter 13-14 precip

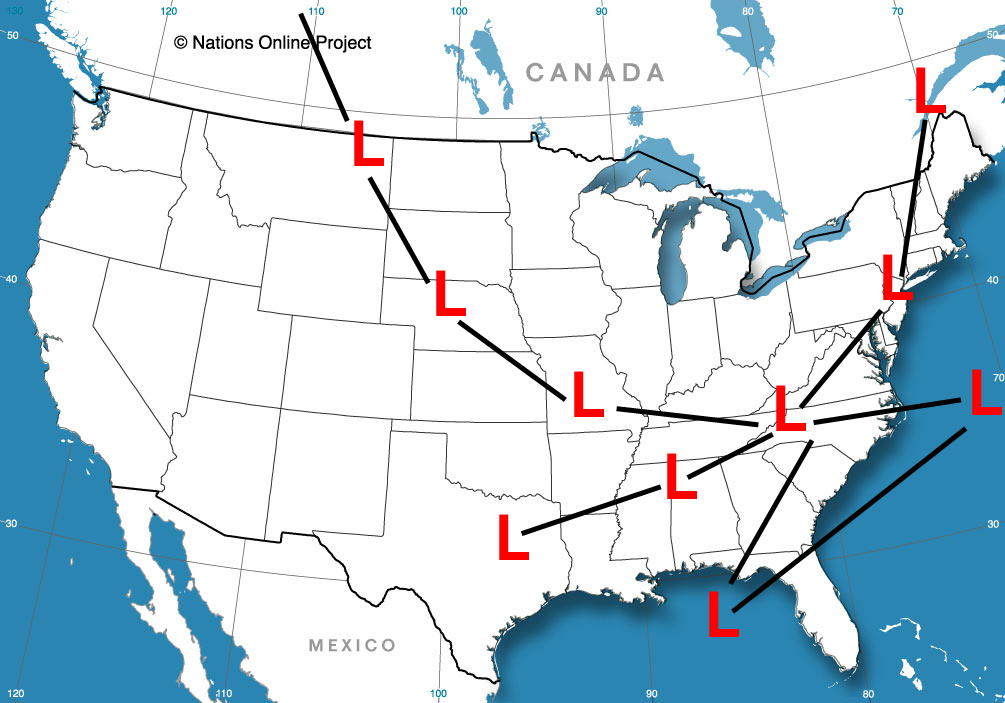
Potentially common storm tracks (note the variability near the East Coast):

winter 13-14 possible storm tracks

Discussion:

Pacific/Indian Ocean Sea Surface Temperatures

winter outlook sst

El Nino?

A big factor heading into every winter is what the state of the El Nino South Oscillation (ENSO) will be. The state of the ENSO (El Nino, La Nina, neutral) is often one of the driving forces behind the location of tropical convection over the Pacific during the winter, which in turn helps modulate the position of troughs/ridges in the jet stream over the Pacific and the downstream weather pattern over North America. After a significant pool of warm sub-surface waters developed during the Spring in the ENSO regions and caused some talk of a potentially strong El Nino for this upcoming winter, we have struggled to see significant warm anomalies surface across the ENSO regions:

ENSO regions

Don’t get me wrong, things have warmed, with every ENSO region seeing above average sea surface temperatures. However, the anomalies in the more important ENSO regions 3, 3.4 and 4 have struggled to consistently stay warmer than +0.5C, which is the threshold for an official El Nino. Below the surface, waters are still generally warm, which probably bodes well for the potential of an official weak El Nino occurring during the winter:

ENSO tdepth

Trade winds over the Pacific have generally had trouble relaxing this summer, potentially due to warm waters west of the Dateline towards Australia and the eastern Indian Ocean keeping pressures somewhat lower in that area. The areas of blue on this time-longitude plot of the 850mb zonal (west to east) winds in the equatorial Pacific represent stronger than normal trade winds. Remember, trade winds typically blow east to west in the equatorial Pacific, and zonal winds are west to east winds, so negative zonal wind anomalies here actually correspond to stronger than normal trades. Stronger than normal trade winds cause cooler waters to upwell from below and cool the surface water temperatures. Note how the strong westerly wind anomalies, which typically cause warmer in the equatorial Pacific when they propagate eastward, have had trouble getting east of the Dateline this summer:

winter outlook 850mb zonal wind

This may explain why the potential El Nino has only slowly intensified this summer and at times barely maintained itself or even cooled. With that said, the Southern Oscillation Index (SOI), which measures the pressure difference between western South America and eastern Australia, and is often an indication of whether or not the trade winds may be stronger or weaker than normal near the equator in the Pacific, has on average been negative for July, August, and September and remains negative as we head into October. This is an indication of possible weaker trade winds. You can always get the latest SOI data here:

http://www.longpaddock.qld.gov.au/seasonalclimateoutlook/southernoscillationindex/

The 850mb zonal wind plot above shows that over the last couple of weeks, the trade winds have been about as strong as normal east of the Dateline, but right now have the largest area of weaker than normal trades west of the Dateline since late July/early August. This may be due to the eastern Nino regions warming and reducing the temperature difference between the eastern Pacific and western Pacific recently, causing trades to weaken. Regardless, if the –SOI continues and these weaker trades can last for more than a week or two, we’d likely see sea surface temperatures in the Nino regions warm even more, and become solidly above the magic +0.5C threshold in the Nino 3.4 region. This would increase the chances of a weak El Nino come winter. Most ENSO models agree with this idea (although, it should be noted that their performance this past Spring was weak, as they tried showing a much stronger El Nino developing):

ENSO models

Given that the water temperatures are already bordering on El Nino type warm anomalies, and given that the recent pattern across the equatorial Pacific appears to favor these warmer waters at least maintaining if not warming a bit more in the coming weeks, I’m inclined to believe an official weak El Nino will occur this winter (5 or more consecutive tri-monthly periods where the average ENSO region 3.4 sea surface temperature anomalies are greater than +0.5C). There’s some chance this doesn’t occur if we get the trade winds to abruptly intensify in October or November, but I believe this is unlikely, and even if it happened the ENSO would still be warm-neutral. Due to the lack of westerly wind bursts making headway east of the Dateline this summer, and the struggle for the ENSO regions to consistently warm, a moderate El Nino is an outside possibility, but in my opinion is not extremely likely. The “El Nino” doesn’t appear to be either east based or west based at this time.

Indian Ocean:

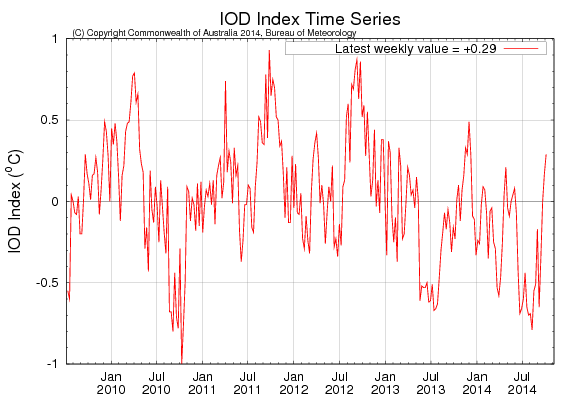
There are a few reasons why the water temperatures in the Indian Ocean can be construed as potentially important when determining what kind of weather pattern we’ll see during the winter, and I’ll briefly look into those below. For starters, the water temperatures in the Indian Ocean will affect air pressure in that area, potentially impacting trade winds farther east over the Pacific Ocean and the ENSO state. In addition, water temperatures in this area may work with the state of the ENSO to help determine where tropical convection is most persistent, helping to modulate the position of the jet stream over the Pacific and North America. Luckily, there is an index that measures where warmer water is located in the Indian Ocean, called the Indian Ocean Dipole (IOD from here on out). Essentially, the IOD is “positive” or “warm” if waters over the western Indian Ocean are warmer than normal and waters farther east, towards Indonesia, are cooler than normal. It is “negative” or “cold” if the opposite is true. This index, after being mainly positive to start the decade, has trended mainly negative for the last 15 months give or take, but has risen to start fall:

winter outlook IOD

This graph, as well as more information about the IOD, can be found here:

http://www.bom.gov.au/climate/IOD/about_IOD.shtml

A crude but functional list of monthly IOD values from 1958 through most of 2010 can be found here. There two locations are the source of the IOD numbers I will be using below:

http://www.jamstec.go.jp/frcgc/research/d1/iod/DATA/dmi_HadISST.txt

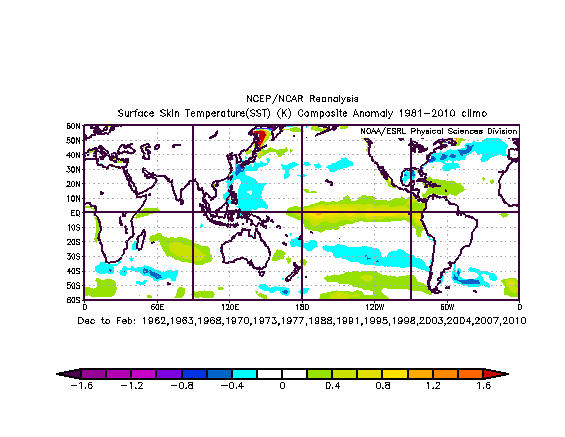
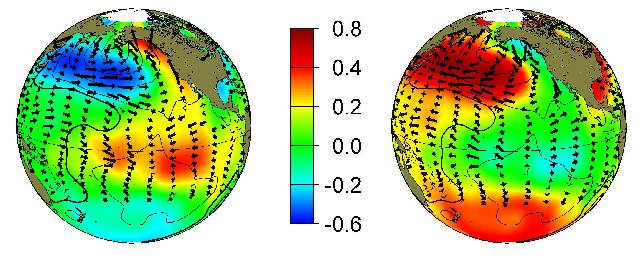
In general, it seems as though +IOD winters tend to occur more frequently during El Ninos. I ran two composite maps based on the IOD data above. The first one is for all winters where there was a +IOD (I went with 0.3+, our most recent weekly value). There is an El Nino in the mean winter SSTs, however it should be noted that some very strong El Nino years are in that set of data:

sst IOD warm all

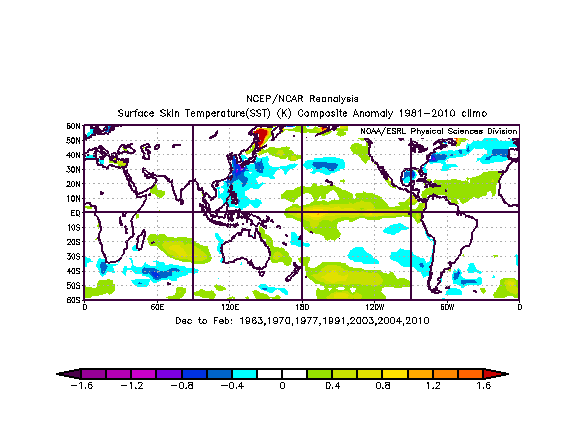
When I remove the strongly +IOD years (generally, leaving winters where the IOD was between +0.3 to +0.8), which leaves a set of IOD data that may be more applicable to this year, the El Nino signal is still present, albeit a little bit weaker:

sst IOD remove strong

This leads me to believe that the recent emergence of a warm/+IOD may bode well to El Nino chances this winter, if it can persist. It should be noted that I understand that in the above plots that the Atlantic and even the N. Pacific sea surface temperature anomalies don’t match this year…that’s ok, I’m using the +IOD data to try to determine the potential state of the ENSO going forward at this point in time. It appears that this correlation is obviously stronger if the +IOD is stronger, so we’ll have to monitor the IOD going forward. With very quiet convection over the western Indian Ocean and more active weather (including some strong tropical cyclones) in the eastern part of the basin, the +IOD may intensify some over the next couple of weeks.

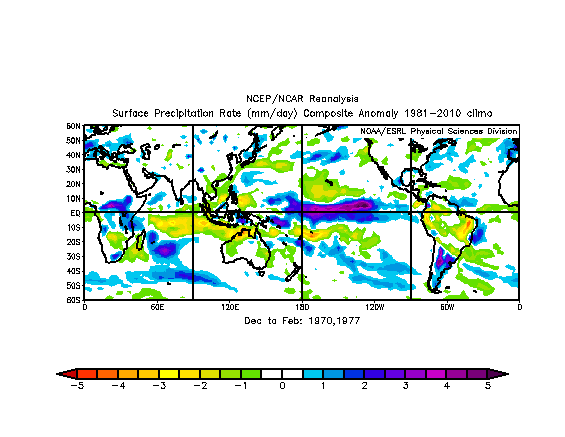
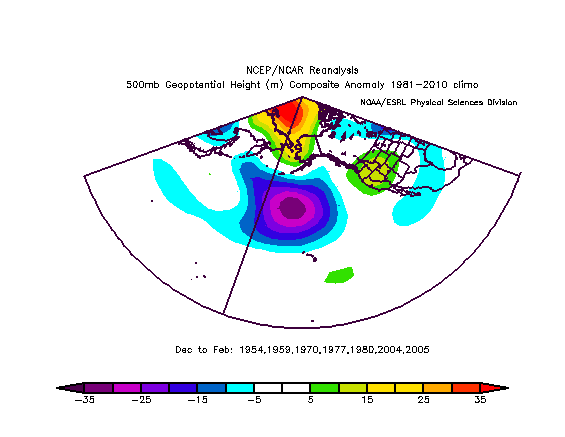
Taking it a step further now, I’m going to run the composite precipitation anomalies for the winters where there was a weak +IOD (the years used in the second IOD related map above) and a weak El Nino, to see where convection tends to persist in the Tropical Pacific in winters with those SST configurations. Unfortunately, there were only two years that matched this set, so it is an extremely small sample size, but here’s what the composite map looks like:

IOD and ENSO precip

Not surprisingly, the most persistent convection during winter during these years was east of the Dateline. This is in contrast to the last few winters, where the convection was west of the Dateline. Given this, we probably won’t see a persistent ridge into Alaska this winter (ridging would be farther east) assuming convection occurs where a warm IOD and weak ENSO suggest it should occur in the tropics.

Thoughts on if the idea of convection occurring farther east this winter are legitimate

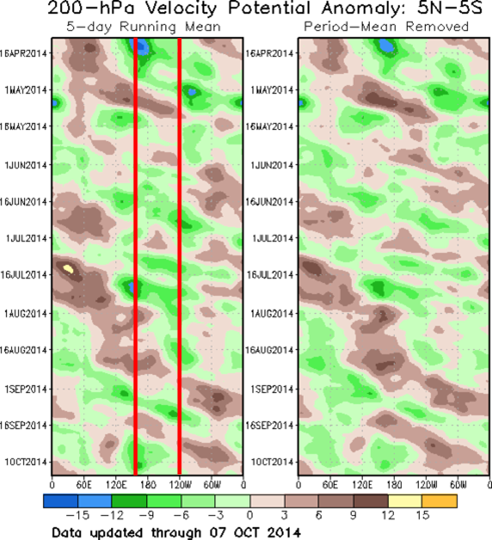
The recent development of the +IOD going positive supports the warm waters in the ENSO regions becoming an official El Nino over the next few months, as +IOD events typically correlate well with El Ninos, likely due to the cooler waters near New Zealand supporting weaker trade winds over the tropical Pacific. Warm sub-surface waters and signs that the trades have relaxed of late, in addition to the +IOD suggesting this trend will likely continue, further help support this notion. In addition, it can be seen on 200mb vertical velocity potential maps this summer that convection has successfully gotten east of the Dateline several times over the last few months:

200mb vvp winter 2

The green indicates upward vertical motion due to convection in the Tropics. Note how the bulk of the active convection over the last several months has been between about 160E and 120W, right where the bulk of the convection occurred in the two IOD+ENSO analog winters above. This suggests that the pattern may already be turning more Nino like (supported by recent Gulf of Alaska low pressure systems as well). Considering that convection over the Tropical Pacific is a large driver of where the ridges and troughs in the jet stream set up over North America, and considering that this variable “should” change given the expected sea surface temperature anomaly configuration this winter, and appears to have changed over the last several months to match that, shows that a pattern that is a “repeat” of the very cold winter of 2013-14 is extremely unlikely. That’s not to say this winter will be dry and warm across the whole country, however if we get cold, it will be due to a different set of circumstances.

Pacific Decadal Oscillation (PDO)/Warm Northern Pacific Waters

pdo phases winter

The PDO is a multi-decadal variable that describes the pattern of sea surface temperature anomalies in the Pacific. This is different than the ENSO, because it takes into account the temperatures in the Northern Pacific as well. As the graph below shows, the PDO normally oscillates in 2-3 decade windows. We have been in a cold/negative phase since around 1999:

pdo graph

However, if you recall the global SST map posted at the beginning of the discussion, you’ll note that the current state of the Northern Pacific doesn’t exactly look like a cold PDO, with cooler waters in the far NW Pacific compared to normal, and much warmer than normal waters almost everywhere else. In fact, the monthly PDO values have all been positive/warm since January of 2014. The positive values have decreased a bit over the last couple of months.

The above graphics, as well as a data table of monthly PDO values going back to 1900, can be found at this link:

http://jisao.washington.edu/pdo/

The question at this point is; does all the warm water in the northern Pacific make a huge difference on the expected weather pattern this winter? This is a difficult one to answer…it is likely that the water temperatures in the northern Pacific are more of a result of the prevailing weather pattern, as opposed to the other way around, because waters that are normally in the mid 40’s aren’t going to change the pattern when they warm up or cool down a few degrees…unlike the waters in the tropics that drive thunderstorms, there just isn’t enough heat released from the waters farther north to make a huge impression on the weather pattern.

past year pac pattern

When looking at the large scale weather pattern over the northern Pacific over the last year, it is easy to understand how the northern Pacific got so warm and even flipped the PDO positive. This pattern of strong ridging near the Dateline began to take shape last October, which is before the PDO turned positive, which is a sign that the warm waters in this region are a result of the ridging here, and not vise-versa. In addition, the ridging near the Dateline was most likely a result of a modestly cool ENSO and warmer waters in the Pacific west of the Dateline causing tropical convection to be focused west of the Dateline. Given the change in the Pacific pattern discussed above over recent months, a repeat performance of strong ridging near the Dateline is extremely unlikely this winter, meaning the current SST configuration will probably change over the coming months. In fact, the GFS and ECM ensembles currently agree on a Gulf of Alaska low persisting through much of the rest of the month of October, indicating that the water temperatures over the Gulf of Alaska will cool (which will likely result in a PDO value closer to neutral than anything else, but still probably slightly positive).

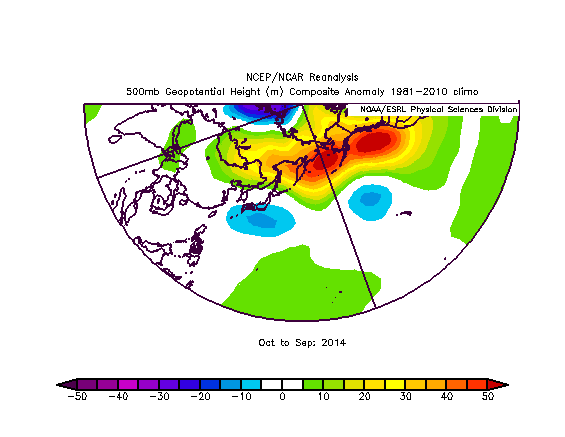
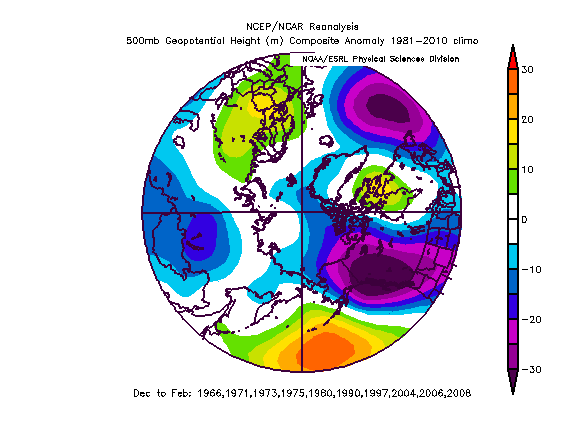
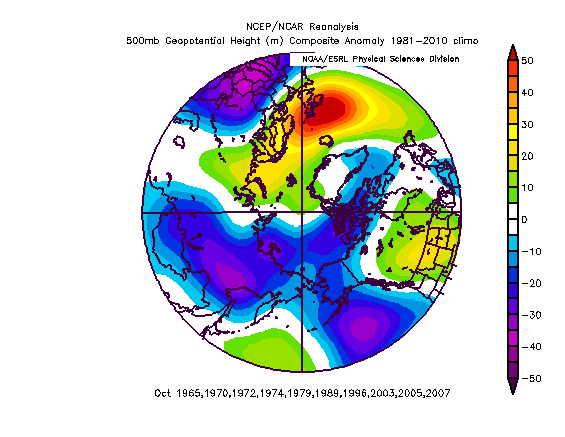
Because the PDO is more of a reflection of a persistent longwave pattern over the Pacific, I thought it would be interesting to look at periods where the PDO also briefly spiked positive during an overall negative PDO regime in the past, as that may indicate a similar change in the overall pattern over the Pacific for a relatively brief period of time, like we have seen over the last year. I tried to pick years where the PDO rose to positive values during the spring or summer months. I then narrowed down the years to include only warm neutral or weak El Nino ENSO states during the winter. The 500mb anomalies during the winters that met these criteria looked like this over the Pacific:

PDO and ENSO composite 500 NEW

This goes along with the idea of tropical forcing occurring farther east this winter as discussed above, suggesting that the large negative anomaly will be located closer to or even east of the Dateline, with any persistent ridging being located closer to western North America. Because I believe a weak El Nino is likely to develop as I discussed above, and similar +PDO spikes during warm neutral or El Nino ENSO events have resulted in a pattern that makes sense with the tropical forcing being focused farther east than the last few winters, which has already began to occur this past summer and heading into this fall, I believe the idea of a low somewhere over the Gulf of Alaska/Aleutians, and ridging over western N. America is reasonable this winter. The question becomes, can we still get high latitude blocking to direct significant cold towards the US, or will we see a much warmer winter in general? I’ll get to that below.

Potential for High Latitude Blocking

The high likelihood of last winter’s Dateline ridging in the N. Pacific being replaced by troughing suggests that the Pacific pattern won’t continuously load significant amounts of cold air into much of central and western Canada this winter. This means that we will need something else to get cold into the US…and that something is possible high latitude blocking. It isn’t particularly easy to guess how certain teleconnections will play out during the winter months or where blocking will occur, but there are several clues that are present by the time we hit October in most given years that can potentially help us determine if significant periods of high latitude blocking are likely in the upcoming winter, and potentially help determine where it will occur.

Quasi-Biennial Oscillation (QBO):

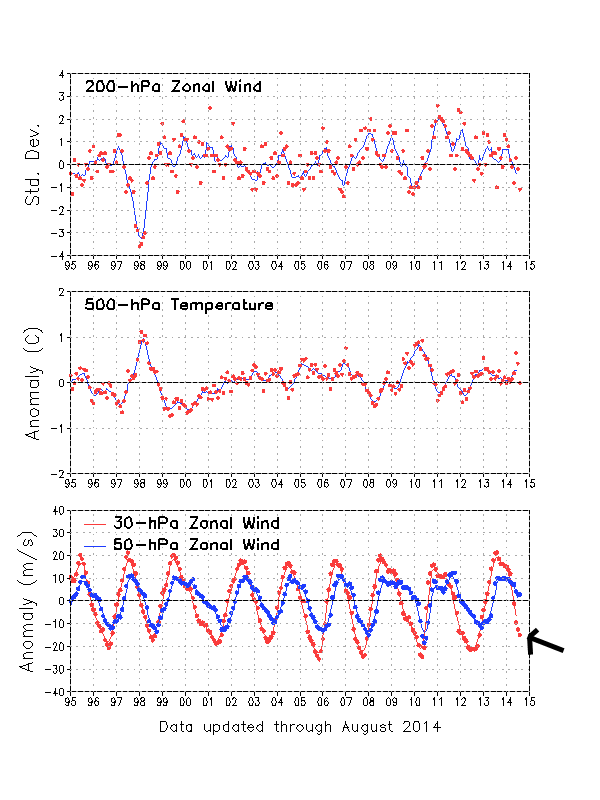
The QBO is a change in direction in the winds in the stratosphere above the tropics. A “negative” QBO represents easterly wind anomalies at this level, and a “positive” QBO represents westerly wind anomalies at this level. The QBO is important to winter because an easterly QBO typically correlates to a weaker stratospheric polar vortex (PV) during the winter across the Northern Hemisphere. A weaker stratospheric PV is more prone to breaking down and allowing sudden stratospheric warming events (SSW) to occur during the winter months. SSWs can down-well into the troposphere and result in a period of strong high-latitude blocking during the winter, which is why the QBO phase and intensity is of interest when trying to forecast whether blocking may be more or less likely to occur during an upcoming winter season.

QBO graph winter forecast

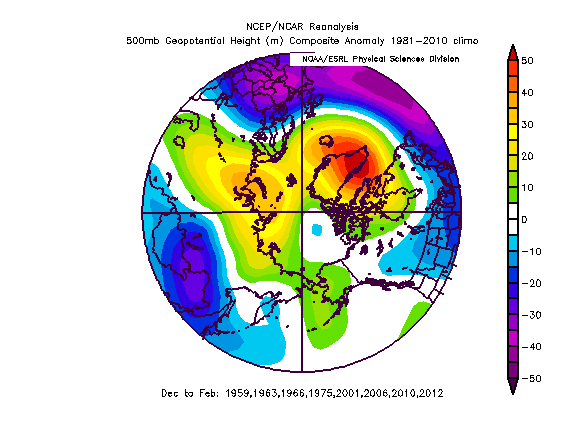
The QBO has currently turned negative over the last few months…in fact, the September value of the QBO, as measured at the 30mb level, was -23, which is strongly negative. This would “appear” to bode well for the potential of high latitude blocking during the upcoming winter, however I have read many times over the year that QBO values of lower than -15 or -20 were “too low.” I tried to substantiate that, first by looking at years where at least one month had a QBO value of -20 or lower (there were only four of those…58-59, 65-66, 74-75, and 05-06)…although 05-06 was a bad winter, the overall 500mb composite for those winters had a –AO and modest –NAO…it is however an extremely small sample size. To relax the criteria a bit, I went ahead and added in where the average DJF QBO number was lower than -15, which added a few (62-63, 00-01, 09-10 and 11-12). Again, 11-12 was a clunker (although a SSW event did occur that winter and cause colder weather so spill into Eurasia during the second half of the winter as a –AO developed), but the overall composite mean from all 9 winters above shows a –AO and a –NAO:

low QBO winter forecast

Data used for the above analysis and further QBO analysis can be found here:

http://www.esrl.noaa.gov/psd/data/correlation/qbo.data

Regardless, looking ahead towards this winter, I’m going to try to “guess” what the QBO values will be in the neighborhood of. To do this, I’m going to look at how long strong –QBO spells tend to last, and try to estimate when our current strong –QBO will start to rise. In the data linked above, I found 21 cases where the QBO attained a value of -20 or lower for at least 1 monthly value. Since our current spell of -20 or lower monthly values is at two months, I threw out 4 cases where the -20 value only occurred for 1 month (leaving 17 cases). In those average cases, the average length of a -20 or lower QBO value was 4.17 months (let’s call that 4 months). (It should be noted that a 1965-66 period of -20 or lower QBO, one month saw the values rise to -19. However, surrounding months were -20 or lower, so I counted that as one 5 month block of -20 or lower).

Our current QBO values of -20 or lower began in August. If this current period of -20 or lower QBO lasts the average 4 months, the values would begin to increase to above -20 by December. Out of the 17 cases where the QBO was lower than -20 for 2+ months, 6 of those (35%) lasted 5 or more months (longest was 7 months in 2005), which would take us into this upcoming winter. Either way, odds are we’ll still have a QBO of lower than -5 for each month this upcoming winter (except for maybe February if it starts rising quickly), but odds also appear to point to the values coming above -20 either before or during the winter. This sounds good, however, I thought it would be an interesting exercise to run years that featured a -20 QBO or lower during the fall that began to rise either just before or during winter. The results weren’t very pretty in terms of high latitude blocking:

QBO analogs winter

Unfortunately, there was a mix of ENSOs in there (several La Ninas, which explains the trough over western N. America…in fact, only one had a somewhat decent ENSO match (79-80)), and below, the October composite pattern in those years doesn’t show a good –AO like we are seeing this October, so the strict QBO analog set shouldn’t be taken extremely seriously:

QBO analogs October

Overall, the –QBO suggests that high latitude blocking is in general more likely than years in which the QBO is positive. Based on the above “strictly QBO analogs,” it appears better if the average winter QBO is -15 or lower, or features one month of -20 or lower, as that composite featured more high latitude blocking. However, in general, these analogs look strictly at the QBO and ignore other important factors, so they aren’t going to define how I draw my outlook to a tee.

October Correlations to Winter

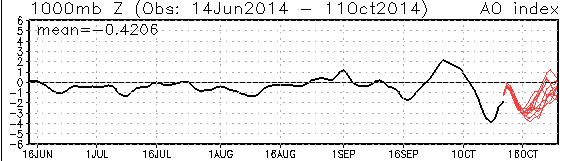
A strong –AO is occurring this month, and I’ll look into that along with a couple of other fun things that happen in October (like advancing snow cover in Eurasia) that appear to have some correlation to high latitude blocking in winter.

Strong –AO in October:

AO winter forecast

This October appears on track to come in with a monthly value of less than -1. It is possible that the value comes in close to or lower than -1.5 for the month, but the latter is nowhere near a certainty yet. Regardless, there have been 10 Octobers since 1950 that had a monthly –AO of less than -1. Those Octobers were 1960, 1966, 1968, 1974, 1979, 1981, 2002, 2006, 2009, 2012. Only two of the following winters (1974-75 and 2006-07) saw a +AO on average. It should be noted than February of 2007 did manage of monthly AO of -1.31 in an otherwise mainly positive AO winter. This seems to be a fairly strong correlation to –AO blocking winters following strongly –AO Octobers.

Monthly AO data used:

http://www.cpc.ncep.noaa.gov/products/precip/CWlink/daily_ao_index/monthly.ao.index.b50.current.ascii.table

For kicks, only 3 of the 10 winters following strong –AO Octobers featured an average –NAO (1968-69, 2002-03, 2009-10), although many of the other winters were only slightly positive. So, there doesn’t appear to be a strong October AOàwinter NAO correlation.

Monthly NAO data used:

http://www.cpc.ncep.noaa.gov/products/precip/CWlink/pna/norm.nao.monthly.b5001.current.ascii.table

Unfortunately, no other classic teleconnections will be strongly negative or positive this month as it looks now, so I did not try to correlate them to this upcoming winter.

Snow Advance Index (SAI)

http://www.aer.com/news-events/blog/snow-advance-index-new-tool-predicting-winter%E2%80%99s-severity

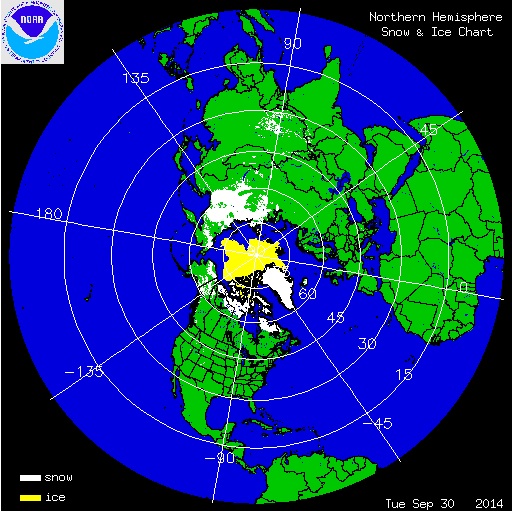
Judah Cohen (PhD) has come up with an index, called the SAI, which has a greater than .8 correlation in determining the upcoming winter AO/NAO indices. In short, when the SAI is positive (faster snow advance than normal in October in Eurasia south of 60N), it tends to correlate to a –AO and –NAO in the upcoming winter. When the SAI is negative (slower snow advance than normal in October in Eurasia south of 60N), the opposite tends to be true. There has been a decent increase in snowcover in that magical area in Eurasia thus far, although note that there was some snow south of 60N when we started the month:

Sept 30 snow-ice

Compared to October 11:

Oct 11 snow cover

These appear to be solid gains south of 60N. The modeled weather pattern over the next week to two weeks suggests this advance should continue, with recent GFS and Euro runs showing below normal heights (which generally are good for snow cover buildup) continuing over Eurasia for the foreseeable future:

ECM-GFS 8-10

This isn’t necessarily the coldest looking pattern ever for Eurasia in October, but they should continue to gradually build snow south of 60N. Early indications are the SAI may come in with more snow advance than normal, which would suggest a –AO/-NAO winter, however the caveat is it’s October 12th so there is some chance this changes.

October Pattern Index (OPI)

A group of Italian researchers has found that a certain October 500mb pattern over the N. Hemisphere is conducive to a –AO in the upcoming winter (or positive if the inverse of the pattern is true). The researchers have not published a paper yet, however they do claim a correlation of over .9. The current OPI index is strongly negative (through the first 11 days of the month plus 10 days of GFS prediction). This initially appears to support a –AO winter, however as with the SAI discussion above, the caveat is that we’re a bit early in the month and this may change.

OPI monitoring:

http://app.til.it/opi/

OPI information:

http://app.til.it/opi/Image/ENF.pdf

Conclusions:

Although an El Nino has struggled to develop thus far this summer, warm sub-surface waters in the Equatorial Pacific, recent slackening of the trade winds across the Tropical Pacific, a long running –SOI, and recent flip to a +IOD suggests that an El Nino will still probably develop by this winter. Given how much trouble we’ve had seeing waters warm though over the last several months in the ENSO regions, a weak El Nino is probably the most likely outcome, with an outside chance at a moderate Nino and a similarly small chance at the ENSO remaining warm-neutral. The brief +PDO spike, combined with this El Nino, suggests tropical forcing will be focused mainly east of the Dateline this winter, suggesting a general low anomaly in heights south of the Aleutians and general high anomalies across western N. America. This also suggests a more active subtropical jet into parts of the southern US this winter.

A strong –AO October, combined with a preliminary look at the SAI and OPI, suggests that a –AO winter is likely. There are more mixed signals on the potential NAO state this winter, however the SAI claims to correlate to the NAO as well. If the ridging forced by the Tropical Pacific is focused closer to the west coast, a –AO may help drive cold into the eastern US this winter. However, if the Tropical Forcing ends up farther east than I currently anticipate, then we would waste the –AO unless an –NAO could also develop.

Given I expect general ridging over western N. America this winter, I expect a dry and warm winter across the western US (especially the NW US). An active sub-tropical jet may bring near normal temps and precip to the SW US, however I’m not sure the El Nino will be strong enough to reverse or even alleviate the extreme drought ongoing in California. The active sub-tropical jet will also likely bring cooler and wetter conditions than normal to the Gulf Coast and SE US, with above normal precip also potentially occurring into the Mid-Atlantic. A ridge on the west coast of the US would probably favor mean troughing over the Great Lakes and Northeast, suggesting cooler than normal conditions in this portion of the country. The Midwest would likely also be drier than normal in general.

Storm tracks that may be common may be low pressures that slide across the Deep South and bring overrunning type wintry precip from parts of the mid-Mississippi Valley eastward towards the Mid-Atlantic and parts of the SE US. Depending on how the AO and NAO play out, storms may either cut NE near the Appalachians or off the East Coast. That’s a broad range, but that is how important getting a –AO and at times –NAO will be. This could be a variable winter for the East Coast, with a lot hinging on the potential NAO state, for which I couldn’t find any really strong signals for right now. So, with signals for western US ridging and a –AO, I will paint in below normal temperatures across the eastern US, however it should be noted that snowfall prediction is a crap shoot, especially for the coast plain. It is possible to have a cold/wet winter but not see a lot of snow in that region if individual storms tend to cut inland with cold coming in behind them. This may be where the NAO state comes into play.

If time permits I may update a few things in early November if any signs become clearer. Until then, enjoy the lack of winter weather across most of the country for the next couple of weeks.

Posted in Pattern Discussion | 1 Comment

Arthur Will Impact Carolinas as a Hurricane Thursday and Friday; Potential Graze Job for New England

The thoughts in this blog are mine and shouldn’t be used to make any important decisions.

You can find official forecasts from the hurricane center, along with watch/warning info, at www.nhc.noaa.gov

Arthur IR

Tropical Storm Arthur has continued to gradually intensify on Wednesday off of the eastern coast of Florida, and has also begun to start gradually moving to the north. This evening’s infrared satellite presentation of Arthur shows that convection and outflow are still somewhat limited on the western side of Arthur. This has prevented an eyewall that has been occasionally noted to fail to completely close off, resulting in only a gradual intensification of Arthur. Outflow is good to the south and east of Arthur, and the southern and eastern eyewall have consistently had deep convection on Wednesday, so if Arthur can shake off the last little bit of northwesterly shear still affecting it, then a more significant intensification trend may commence. Arthur currently has maximum sustained winds of 70MPH with a minimum central pressure of 989MB per the National Hurricane Center (NHC), so any slight increase in intensity would make Arthur a hurricane.

Arthur UL

A look at the upper level winds surrounding Arthur show that there is a very strong equator-ward outflow channel, which essentially removes the air from above Arthur and promotes intense rising motion within the storm. However, there is still a little bit of northwesterly shear affecting Arthur. Although this shear is pretty weak, it is JUST enough to entrain some dry air from over the Carolinas into Arthur’s core, which has kept the storm from closing off an eyewall today. However, southwesterly winds associated with an incoming longway trough are beginning to approach Arthur, which will likely help cause outflow to develop on the pole-ward side of Arthur, eliminate the westerly shear, and give Arthur an opportunity to strengthen more significantly through early Friday.

Arthur GFS vort wind 30

A look at this evening’s GFS model valid Thursday evening shows that the model depicts a much better divergent flow over Arthur by Thursday evening. However, westerly winds would begin to approach levels that would shear the storm.

Arthur GFS 42

As we move forward to Friday afternoon, the GFS appears to show westerly winds beginning to make it through to the core of Arthur, which would likely begin a weakening and extra-tropical transition of the cyclone. This indicates that Arthur has between now and Friday morning to intensify before shear associated with the trough moving into the eastern US begins to become prohibitive. If Arthur moves over the Carolinas between now and Friday afternoon, that would obviously halt intensification sooner.

Arthur TCHP

Sea surface temperatures between Arthur’s current location and the Outer Banks of the North Carolina are plenty warm for tropical cyclone intensification. However, the depth of the warm water is not extreme, as shown above. Arthur is a fairly small tropical cyclone right now, so as it begins to pick up speed over the next 12-24 hours this lack of deep warm waters may not hurt the cyclone. Essentially, once the current light northwesterly shear affecting Arthur weakens, warm enough waters given the circumstances and a favorable wind pattern in the upper levels of the cyclone favors strengthening into the day on Friday, assuming the storm doesn’t make landfall over the Carolinas before then.

Arthur intensity

Given these seemingly favorable conditions for intensification, most of our tropical cyclone intensity models quickly make Arthur a hurricane at some point on Thursday…I think it will likely occur by the 11:00AM advisory from the NHC Thursday morning. Only the SHIPS model actually gets Arthur to category two intensity. However, I believe this may actually be a very possible if not likely solution, and not only because the SHIPS intensity model is statistically one of the best predictors of tropical cyclone intensity.

arthur radar

The above picture shows how high the cloud tops are in Arthur’s showers and thunderstorms, as seen from the Jacksonville, FL radar. Note how not only are there very tall thunderstorms in the northern eyewall, but how the radar is starting to pick up on some better convection trying to go up in the western eyewall of Arthur, which has had trouble closing off today. Also note how the eye is rather small, and how the bulk of the deepest convection is associated with the inner core/eyewall of Arthur.

When tropical cyclones have a small inner core, the energy associated with the cyclone is more focused there, and thus can cause the strongest part of the storm to strengthen significantly. Having a ring of deep convection around an eye in a tropical cyclone on microwave (or in this case radar) imagery is also a sign that a significant bought of intensification is getting ready to occur. Although the western eyewall of Arthur still needs a bit of work, if the weak shear from the northwest affecting the cyclone weakens by Thursday morning as expected by most models, then the eyewall would likely close off and the storm would likely deepen. It is possible that Arthur can quickly intensify to category two or even category three intensity by Thursday night or Friday morning if it could ever close off its eyewall.

It’s a tough call as to whether or not Arthur can pull off this rapid intensification over the next day or so. Most signals say yes, it’s possible, but it’s hard as a forecaster to forecast such a rapid intensification before it starts happening, especially when most of our forecast models don’t show this much intensification. It’ll be an interesting next 24 hours. In my post on Tuesday I said I expected Arthur to max out as a borderline category one/two hurricane (max winds 90-100MPH)…I still think that’s a good range, but there’s a bit of upside if all goes “well.”

How Close Will This Come to the Carolinas? What About Farther up the East Coast?

Arthur steering

Arthur is currently moving to the north at 8MPH. The cyclone is about as close as it can currently get to the Carolina coastline without bringing some impacts to the region. Arthur is currently nestled between a sub-tropical high pressure centered south of Bermuda and a longwave trough moving east out of the central US towards the eastern US. As can be seen on the above image, there is a belt of strong southwesterly winds ahead of the trough over the central US that will begin to accelerate Arthur to the northeast by Thursday afternoon. Unfortunately, this puts Arthur on a path that parallels the North Carolina coastline and possibly brings it over land, especially the Outer Banks. In my last two blog entries on Arthur I mentioned that the orientation of the trough over the central US may cause the western side of the potential track—IE one that brought it very close to or over the eastern North Carolina coastline—to win out. As of this writing, that possibility is a very strong one.

Arthur ATCF track

Most of our hurricane models now show Arthur coming within 20-50 miles of the North Carolina coastline from Wilmington points east, with about half of the models showing a track over or even inside of the Outer Banks. Note how yesterday, all of these models (barely) kept Arthur off shore.

Our two top performing “global” models, the GFS and Euro, both show similar tracks, with a graze job for a lot of coastal North Carolina (especially from Wilmington points east) and a direct impact on the Outer Banks. The GFS ensembles are in general a bit farther west than the hurricane models shown above, with almost all members tracking Arthur over or inside of the Outer Banks:

Arthur GEFS

The European ensemble mean from this afternoon continues to show the mean position of Arthur among all of the ensemble members to be over the Outer Banks on Friday morning, which is a bit of a compromise between the hurricane models and GFS ensembles:

Arthur ENS slp

Given that this slight westward adjustment yesterday makes sense because of the PATTERN, I believe that it is legitimate. Thus, I believe it is likely that Arthur makes direct landfall somewhere along the North Carolina coastline…likely somewhere over the Outer Banks. It is important to note that areas as far west as the South/North Carolina boarder may see fair impacts along the coastline. The timing of impacts will be Thursday afternoon through Friday morning. A storm surge will likely occur over the Outer Banks, and may occur farther west along the coastline. A modest water rise could occur as far north as the Delmarva Peninsula. Winds may be strong enough to cause scattered to numerous power outages across a good portion of coastal and eastern North Carolina, and may be strong enough to cause notable structural damage in the Outer Banks. A few power outages may occur in eastern coastal South Carolina, much of eastern North Carolina (away from the coast) and far southeast Virginia. It is important to listen to advice from local authorities and heed all evacuation orders if issued for your area. If you are traveling to the Carolinas for the holiday weekend, especially eastern North Carolina, check ahead in case Arthur impacts your destination.

Arthur ENS 500

A look at the large scale weather pattern for Friday morning, per the European ensembles, shows that the trough approaching the eastern US is still west of Arthur, and has a neutral tilt. This suggests that Arthur may not be shunned as far east as initially expected. Some rain may affect parts of New Jersey, Long Island, and New England late Friday and Friday night in association with Arthur. In addition, tropical storm force winds may affect Long Island and extreme southeastern New England (Cape Cod, Martha’s Vineyard, Nantucket) as Arthur goes by Friday into Friday night. While the trough is expected to come in just in time to avoid a direct impact on any of these areas, some inconveniences are appearing more likely.

Here is where I think the greatest threat in the Carolinas is:

Arthur SE impacts

Note that a small shift west or east in the track has impact implications. Please stay on top of this by following local news sources in that region. Impacts begin Thursday afternoon.

Here’s where I think impacts are most likely in the Northeast:

Arthur NE

Posted in Storm Forecasts | Leave a comment

Arthur Likely to Become a Hurricane off Southeastern US Coastline

In yesterday’s post about (then) Invest 91L, I discussed what would need to occur for what is now known as Tropical Storm Arthur to potentially intensify to hurricane intensity later this week. It is looking very likely that this will happen, and some impacts will be felt across the southeastern US through Friday. Let’s take a look at what Arthur is doing now, what may cause it to intensify, and areas that may see impacts. Remember that these thoughts are just mine and shouldn’t be used for any important decisions.

arthur vis

In stark contrast to yesterday, Tropical Storm Arthur’s satellite presentation actually has some good characteristics. There is a much larger, more organized area of deep convection that isn’t as displaced to the southeast of the surface circulation as it was yesterday. There is a bit more convection north of the center of circulation. Cirrus outflow has improved considerably in the southern semi-circle, and is attempting to develop in the northern semi-circle. This all points to Arthur becoming better organized and intensifying.

arthur radar

A look at recent radar imagery however suggests that we may have to wait a little while before Arthur intensifies notably. Yesterday I discussed the potential for the surface circulation to re-develop closer to the convection associated with the mid-level vortex (the vortex has been tilted to the southeast due to northwesterly shear). That appears to be happening, however that is not an instantaneous process. It takes a while for the old center of circulation to “spin down.” Regardless, the old surface center and the convection associated with the mid-level vortex appear to be rotating around a common point. In their 5PM EDT advisory, the NHC appeared to go with the common point for the current location of Arthur. Radar loops reveal that the old surface center is currently moving southwest (and becoming less defined), while the mid-level vortex (and potential location of the next surface center assuming shear does not continue to tilt the vortex) is moving to the north-northwest. This rotation suggests that a new low-level circulation is developing beneath the mid-level circulation, which would explain why the old surface center is rotating around a common point with the mid-level center and stronger convection.

Arthur shear

A look at the upper level environment around Arthur suggests that once this center relocation completes and the vortex becomes vertically stacked, it should remain stacked and intensify. An upper level anti-cyclone that yesterday was located west of Arthur and inducing northwesterly shear has moved east today and is now essentially centered over Arthur. Shear analysis (yellow lines) shows less than 10 knots of wind shear over Arthur, which is favorable for intensification. Also note, the wind barbs representing the upper levels of the atmosphere are moving away from Arthur. This verifies the satellite appearance showing improved outflow, and promotes continued deep convection.

Arthur wv

In yesterday’s post, I discussed how there was dry air in close proximity to the surface circulation associated with Arthur. This is less of an issue tonight. Water vapor imagery shows that mid-upper level dry air that yesterday was impinging on the surface circulation of Arthur has been mixed out. Precipitable water values are now safely over 2” well outside of Arthur’s central dense overcast. This shows that the persistent convection associated with Arthur for the last 24 hours or so has mixed out the dry air near the center of circulation, as the updrafts containing warm, moist air literally transport moisture from the ocean into the upper atmosphere. If shear stays low, dry air won’t be a significant issue for Arthur going forward.

Arthur GFS 30

Looking at the 18z GFS run valid Wednesday evening, the model shows good upper level outflow persisting. Note how the wind barbs essentially rotate around Arthur (the yellow blob off of the Florida coast), and don’t pierce threw it. This suggests Arthur will be in a good upper level environment for intensification for at least another 24 hours.

Arthur GFS 54

Moving ahead to Thursday evening, increased upper level winds associated with a longwave trough settling into the eastern US will begin impinging on Arthur. However, if Arthur can become a deep cyclone over the next 48 hours (as I expect and as the GFS depicts), then it would likely take until Friday for shear to impact the core of the cyclone. You have to squint a bit to see it, but note how the few wind barbs located over the core of the cyclone as light and divergent, indicating that shear would not be affecting the cyclone yet by Thursday evening. By Friday, the shear will likely become too much for the outflow of Arthur to fend off, resulting in the beginning of a weakening by late Friday and a transition to an extra-tropical cyclone by the weekend.

Arthur TCHP

The tropical cyclone heat potential product, essentially a product of the depth of warm water in the ocean, shows that there is a little juice off of the southeastern coast, but not a ton. This, combined with Arthur’s expected slow movement over the next couple of days, may impact the ceiling of Arthur’s top intensity.

Arthur intensity

Most intensity models bring Arthur up to category 1 intensity by Friday before weakening, with the SHIPS model bringing it up to category 2 intensity. Given radar/satellite trends mentioned above, the expected favorable environment through early Friday, and marginally deep warm waters off of the southeastern coast, I’m inclined to lean towards the higher end of this intensity guidance. This means Arthur could become a category 2 hurricane for a time Thursday night or Friday before weakening. If current organizational trends continue, Arthur could become a hurricane by Wednesday evening.

Where Will This Go?

Arthur GFS 700

A look at the 6 hour GFS forecast valid 8PM EDT Tuesday for the steering flow relevant to Arthur right now shows that Arthur is still in a weak steering flow. This explains Arthur’s continued nearly stationary motion. However, a trough visible over the upper-Mississippi and Ohio Valleys in this image will combine with the intensifying ridge of high pressure to the east of Arthur to cause Arthur to begin moving north and eventually northeast of the next couple of days.

Arthur GFS 500

A look at the steering flow that would be relevant to Arthur if it becomes a hurricane as expected by Thursday afternoon shows that it will be influenced by strengthening southerly and westerly winds. This suggests the cyclone will really begin to move northeast by Thursday and especially Friday and into the weekend.

Although it has become very likely that as expected, Arthur won’t quite make landfall in Florida, some rain will continue to affect the state over the next day or so. Breezy conditions and an enhanced rip current risk will continue along the eastern coast through Wednesday. By the time we hit Thursday and Friday, questions over whether or not Arthur will significantly impact the eastern Carolinas or not remain.

Arthur ATCF track

The most recent update of the hurricane models remain tightly clustered in showing a track over or extremely close to the Outer Banks, with a track close enough to bring at least mild impacts to coastal South Carolina and eastern North Carolina. A track like this would likely have minimal impacts along the East Coast north of southeastern Virginia, save for perhaps some wind/rain for Long Island and Cape Cod Friday night into Saturday morning.

Arthur ENS 500

A look at the pattern shown on the European ensembles for Thursday morning shows the aforementioned trough approaching the eastern US and getting ready to begin accelerating Arthur to the northeast and eventually out to sea. However, there are modestly above average heights across the northwestern Atlantic, which allows the trough to slow down and take on a modest negative tilt over the Great Lakes and Ohio Valley. If this occurred, it may still allow the western portion of the guidance envelope shown above to play out.

Arthur GEFS

The GFS ensembles (tracks shown above) agree with the European ensembles on the pattern that will steer Arthur over the next several days, and have several members that take Arthur inland over North Carolina. Some of the members are likely way too far west (a New England impact is extremely unlikely at this point), but the ensembles in general are farther west than the hurricane models with the track of Arthur.

Arthur ENS slp

The European ensemble mean suggests that most members may also be a bit farther west than the hurricane models. The mean position of Arthur Friday morning is south of eastern North Carolina and moving northeast, which would take it extremely near or over the Outer Banks.

Arthur NHC

The National Hurricane Forecast is as always extremely close to the average of the hurricane models shown above, and shows a hurricane tracking extremely close to the Outer Banks Thursday night into Friday.

The point here is that minimal impacts…rain and some breezes…are likely for coastal Florida, Georgia, and most of coastal South Carolina. More significant impacts are possible for eastern coastal South Carolina, eastern North Carolina, and extreme southwestern Virginia. Strong winds, heavy rains, and some storm surge will be hard to avoid in the Outer Banks, but the significance of impacts here will depend on whether Arthur can track over or west of the Outer Banks, or stays just to the east. If Arthur misses the Outer Banks, impacts would not be significant in the grand scheme of things. If Arthur passes over the Outer Banks or even into eastern North Carolina, there would be notable impacts to the region. It is a very close call right now as to where this tracks in relation to North Carolina.

Heavy rains are possible ahead of a cold front over a good portion of the Mid-Atlantic and New England Thursday into Friday. These rains will not be directly related to Arthur, however moisture being drawn north from Arthur may cause these rains to be heavier than normal.

This storm will unfortunately impact parts of the southeastern US at a time when a lot of people may be traveling. Conditions will improve in Florida by Thursday morning, in extreme eastern Georgia by Thursday night, and in the Carolinas/eastern Virginia by Friday evening, however if a direct hit occurs, then power outages/damage may still affect the holiday weekend, mainly in eastern North Carolina and the Outer Banks. It is not up to me whether or not you alter plans to that region this weekend, however it is very important to heed any evacuations ordered by local government.

Here is an updated quick look at my thoughts:

Arthur map

Posted in Storm Forecasts | Leave a comment

Invest 91L is Likely to Develop Into a Tropical Cyclone off the Florida Coastline

The Tropics appear to be “heating up” in the North Atlantic and I have a few moments of free time, so let’s chat…these thoughts are just mine and shouldn’t be considered official or used for any important decisions…

91L vis

A non-tropical low pressure system that emerged into the waters off of the Southeastern US coastline over the weekend has gradually acquired tropical characteristics while spinning over the waters near the Gulf Stream. A Hurricane Hunter aircraft investigated this low pressure area this afternoon, and found that there was a well-defined surface low pressure with winds of around 30 knots. Radar and satellite data (satellite above) shows that while there is a well-defined surface low pressure, the system is convectively challenged in the northern semi-circle, which is causing the National Hurricane Center to hold off on designating this system as a tropical depression. However, the Hurricane Hunters found that surface pressures are falling with this system (down to 1009mb during their last pass), and all data says that this surface low is well defined and tropical, so any increase in convection will result in this becoming a tropical depression. I’m expecting that to happen by Tuesday morning.

Here is a look at extrapolated sea level pressure and flight level winds (left) and a map of the flight and winds (right), courtesy of Levi Cowan (http://www.tropicaltidbits.com/recon/):

91L recon collage

There are two main factors that have inhibited development into a tropical cyclone thus far. There has been moderate northerly shear from an upper level high pressure system centered to the west of the low pressure system, and dry air in the northern semi-circle of the system that have both combined to keep convection to a minimum near and north of the surface circulation. A recent water vapour image, with satellite estimated precipitable water values overlaid, shows that the air north of the low pressure center is much drier than the air near the circulation. The moisture pouch associated with the system is actually quite small. This drier air to the north is getting entrained into the circulation by the northerly wind shear:

91L WV

In addition, the persistent northerly shear has caused the vortex of the system to fail to become vertically aligned. When plotting the 850mb (about 5000 feet above sea level) vorticity on top of the satellite imagery, it is clear that the mid-level vortex is located south of the surface vortex. This is also contributing to the bulk of the convection with 91L remaining south of the surface center:

91L vort

So essentially, at this point in time we have a well-defined low pressure system, however shear and dry air are causing the system to feature a rather disheveled appearance, which is preventing the NHC from classifying it as a tropical cyclone. However, weather weenies can breathe a sigh of relief, as this northerly shear is expected to relax soon, per essentially every important model (ok, just the GFS and Euro):

91L GFS vort shear

By Wednesday evening, the 18z GFS shows that the upper level winds (barbs) over 91L (the yellow blob just east of Florida) will be much lighter. In fact, the upper level winds over the invest are forecast do become divergent. This suggests that shear should relax over the next 24 hours, and that the upper level winds will help ventilate the system, promoting continued convection with it. This all means that the vortex of the system should become more vertically stacked over the next day, which means convection would become better co-located with the center, likely earning it tropical cyclone status. This could happen as early as tonight, and I believe is almost a lock to happen at some point on Tuesday at the latest. If this becomes a tropical storm, its name would be Arthur.

WHERE WILL THIS GO?

91L has been slowly drifting south to southwest over the past day, and is now close enough to the Florida coastline that some outer rain bands are affecting the state. The system is currently being steering by high pressure located to the west. The high is trying to bubble into parts of the southeastern US, and the clockwise flow around this high is what has been nudging the low south to southwest:

91L GFS 850

If 91L remained weak, it would continue to be steered by the low level flow. However, I am expecting to it become a bit stronger tomorrow, which means it is appropriate to look at a slightly higher layer to determine what will steer this system:

91L GFS 700

By the time we hit Tuesday evening, assuming the system becomes a bit more vertically stacked than it is right now, there would be a few factors influencing 91L’s movement. There would be the same high pressure in the Gulf of Mexico, however a trough will begin building in from the north, and there will be a stronger high pressure to the east of the low, which may work with the trough to cause the storm to stall and eventually begin recurving in a couple of days. By the time we hit late Wednesday, you can definitely see that the trough moving in from the northwest will likely begin turning our low pressure system to the north and then northeast:

91L GFS 700 2

Essentially, it seems likely that 91L will continue drifting south to southwest over the next day…into Tuesday…before essentially stalling/gradually turning more west and eventually north/ through Wednesday…before beginning to gradually accelerate to the northeast by Thursday and Friday. Most of our hurricane models show this general motion over the next few days:

91L models

Based on all of the above, there are two areas that stand a chance at a “direct landfall” (center moving overhead): The Atlantic Florida coast, and North Carolina, and an outside chance in South Carolina. Other states may see indirect impacts such as increased rain and surf.

Most of the ATCF models above keep 91L just off the Florida coast, however it is very close. The surface circulation was moving southwestward towards the coast earlier today, but appears to have stalled. It is possible that our surface center will jump to the south or southeast tonight towards where the better thunderstorm have been focused this afternoon. If this happens it may be affected less by the low level high pressure trying to build to the north, which may ultimately keep it off the Florida coast. If the surface circulation doesn’t relocate tonight, it may move into eastern Florida at some point Tuesday or Wednesday. Given radar trends during this writing, I’m leaning towards a center re-location, which would likely keep the system just east of the Florida coast, however it may still get close. Some heavy rains and breezy conditions are possible along the Atlantic Florida coast through Wednesday.

As for a potential Carolinas impact, that is farther down the road and less certain. All models agree that the trough currently located over the upper Midwest will move east and help recurve 91L, assuming it can develop any further from where it is now. However, how quickly it recurves will determine if it can directly impact the Carolinas or not on Thursday and Friday. The GFS and European ensembles both show above normal 500mb heights across the northwest Atlantic and over the Western US, and both show the trough taking on a bit of a negative tilt over the Ohio Valley on Thursday. This may allow the western side of the guidance envelope to win out, which would take any potential tropical cyclone towards North Carolina Thursday into Friday. The Euro ensemble means show this, with the mean low pressure right over the Outer Banks Friday morning:

91L ENS slp

It’s still very far out (considering a tropical cyclone hasn’t officially formed yet) to say definitively whether or not the eastern Carolinas may see a direct hit, however it is possible and needs to be watched.

It is difficult to determine how strong any system would be when it buzzes the Carolinas on Friday, as there are several factors that will ultimately impact its intensity. If 91L spends time over eastern Florida over the next day or two, it may not intensify as much in the short term. However, if the system can remain over water and become a bit deeper by Wednesday, the jet streak associated with the trough approaching the East Coast may really ventilate the system, which may allow for an uptick in intensity on Thursday and Friday:

91L ECM 96

Although the incoming trough would eventually shear the cyclone, the European model valid Friday morning shows how jet-streaks can temporarily ventilate tropical cyclones without shearing them, which often leads to a burst of intensification. IF 91L can strengthen some over the next 2-3 days, and IF it doesn’t do something unexpected and drift too close to land or even go inland, then it may become a hurricane by Friday as it passes over or east of eastern North Carolina. There are a few “ifs”, however the potential is on the table.

Elsewhere up the East Coast, the incoming trough will likely keep pushing any tropical cyclone east. However, the large scale southwesterly flow ahead of the incoming trough will likely draw moisture from whatever develops out of 91L north. As a cold front moves east, it will likely ring out this moisture. This could result in heavy rains up the East Coast Thursday-Friday night. It is too early to declare the 4th a washout along the East Coast, but it’s possible, and the 18z GFS illustrates why quite well:

91L GFS PRE

Here’s an informal look at what may happen with this system:

91L map

Posted in Uncategorized | Leave a comment