December 18-19 Lake Effect Post-Mortem

For some reason, I posted the forecast for this event as another page and not a post. Here’s the link to that page:

https://ohwxramblings.wordpress.com/december-18-19-2015-lake-effect-snow-event/

Based on storm reports and some estimation based off of radar/terrain, here is my best guess on how much snow fell during the event:

actual 12-19 snow

Here was my forecast:

12-18 snow

The biggest bust may have been in Geauga County, due to banding getting farther south than expected Saturday morning. This resulting in 1-3″ and 3-6″ type snows getting farther south than expected. The heavy snow also got a bit farther south than expected across Ashtabula and Crawford Counties. Overall I’m happy with the forecast, as with the exception of central/southern Geauga County the differences from actual are fairly minor/cosmetic. Not perfect, but not terrible either, which is all I sometimes home for with lake effect snow.

There was some interpolation/estimation to fill in the map, as spotter reports are often spaced pretty far apart. Used radar/satellite loops and elevation maps to estimate as needed.

Posted in Uncategorized | Leave a comment

12/2/15 Lake Enhanced Snow Post

For record keeping purposes, here is a post I made on Neoweather’s Facebook page this afternoon regarding the expected lake enhanced rain/snow tonight in NE Ohio

snow 12-2.png

HRRR 1

HRRR 2.png

HRRR 3

HRRR 4

An upper level low pressure combined with a trough of low pressure in the low levels of the atmosphere will combine with moisture and instability off of the relatively warm waters of Lake Erie to cause rain to develop this evening across the lakeshore counties and Snowbelt east of Cleveland that changes to snow tonight and ends Thursday morning. The potential exists for a period of moderate to heavy snow overnight tonight inland from Lake Erie in the Snowbelt that produces accumulating snow and a period of hazardous travel. Travel conditions should improve during the AM rush…but locations from the hills in southern and eastern Cuyahoga County points east could see some lingering impacts during the early portions of the AM rush.

Rain showers will increase in coverage across portions of our coverage area this evening, mainly from Cuyahoga County points east. These showers could be mixed with a little graupel or soft hail, but will primarily fall as rain initially. The heaviest precipitation before midnight will be mainly focused on parts of Lake, Geauga and Ashtabula Counties. After midnight, the trough of low pressure will start slowly shifting southeast, which will start pushing precipitation into the rest of the lakeshore as far west as Erie County, including the Cleveland metro. The rain will likely start changing to snow away from the lake by midnight as colder air works in. Temperatures during the snow may stay a little above freezing, which means it will be a very wet snow.

A period of moderate to heavy snow appears to be a decent possibility in inland portions of the Snowbelt for a few hours during the pre-dawn hours on Thursday. Temperatures will again be a little above freezing in the snow, but the heavy nature of the snow could cause slick roads to develop in parts of the Snowbelt east of town at times after midnight. The heaviest snow in the Snowbelt will likely occur between 2AM and 6AM Thursday. As the precipitation moves southeast across the Cleveland metro, light to moderate bursts of snow are also possible away from the lake in parts of Lorain, Cuyahoga, northern Medina and northern Summit Counties. Again, the lakeshore will stay mainly rain or a mix.

The window for snow will be fairly brief (only a few hours), but the potential for moderate to heavy snow should allow for 1-3” of slushy snow to fall in the inland portions of the Snowbelt east of Cleveland; that’s eastern Cuyahoga, Geauga, inland Ashtabula, northern Trumbull and possibly far southern Lake Counties. Some portions of northern Geauga County and inland Ashtabula County could see locally up to 3-4” of wet snow if the changeover to snow occurs quickly enough. In the Cleveland area, a light dusting could occur inland from the lake…and the hills in southern Cuyahoga, northern Medina, northern Summit and northern Portage Counties could see a slushy accumulation up to an inch. Elsewhere, a few snow showers could occur and a dusting can’t be ruled out, but there won’t be any accumulations to write home about outside of the Snowbelt.

The amount of snow won’t be a ton and this will all end quickly Thursday morning, but a period of slick travel with low visibility due to snow seems like a decent possibility during the wee hours of Thursday morning in parts of the Snowbelt away from Lake Erie, with a lot of other areas seeing some snowflakes. Plan accordingly if you are an early commuter east of Cleveland. Conditions will again improve quickly during the rush hour Thursday morning. –Jim

Posted in Uncategorized | Leave a comment

December 2nd-3rd Lake Enhanced Rain/Snow Event

Accumulation map. Confidence: Lower than preferable

12-2 no neo

Although I’m not sure how much snow ultimately falls due to marginal temperatures, we’ve had a slow start to the LES season in NE Ohio, so I’m going to do a write up on this event.

NAM 500 27

Aloft, a closed off upper level trough will move right over Ohio Wednesday night, with strong height falls, a good shot of PVA and deep moisture. The upper trough will also bring colder mid-level temperatures and a surge of colder air at the surface behind a secondary cold front that will move through early Wednesday evening, which will allow some lake induced instability to develop Wednesday night in combination with synoptic lift and deep moisture.

NAM sfc theta 27

As the upper trough moves overhead Wednesday evening, the models are in good agreement on an inverted trough in the low-mid levels developing across Lake Erie into extreme NE Ohio and into northern PA. The models have come into agreement on perhaps initially lifting this trough across the Cleveland metro early Wednesday evening, before lifting it northeast a tad over the primary Snowbelt and then swinging it southeast early Thursday morning as the upper low begins pulling away and winds turn more NNWrly. The area where this inverted trough “pivots” (somewhere over far NE Ohio or perhaps NW PA) will likely see the most prolonged period of moderate to heavy precip, and will likely see a good amount of QPF…the question will be how much of this falls as snow.

There appears to be good potential for heavy precipitation where this inverted trough sets up Wednesday evening due not only to lake enhancement but also due to good synoptic moisture and non-lake effect related sources of lift.

NAM 700

The low resolution NAM shows the convergence with the trough over Lake Erie and far NE OH/NW PA extending up above 700mb, with good vertical velocities showing up as a result. On its own, convergence this strong would likely be enough to get half decent precip to develop. In addition, positive vorticity advection in the mid-levels with the upper trough is also a source of lift.

NAM 700 rh

In addition to a good amount of lift from the trough moving over Lake Erie/far NE Ohio, the upper trough will provide for very deep ambient moisture…to around 500mb…so moisture will not be a limiting factor to this event.

BUFKIT 1

Although lake to 850mb and lake to 700mb temperature differentials won’t be extreme…13-15C for the lake to 850mb differential and 23-25C for the lake to 700mb differential…the upper trough moving directly overhead will bring inversion heights way up, to near 15k feet. So although lake induced instability isn’t “extreme,” there’s lake induced CAPE and deep moisture to 12-15k feet or slightly higher from Wednesday evening through early Thursday. 500mb temperatures are progged to get to around -32C Wednesday night, which gives lake to 500mb temperature differentials of 40-42C off of the central and eastern basin. This is around the threshold for thunder, so although there won’t be a lot of lake induced CAPE, the deep layer of moisture/instability and strong lift from the trough through a fairly deep layer of the atmosphere may be enough for some lightning strikes over and near the lake at times, mainly during the first half of Wednesday night.

At this point I’m fairly convinced that moderate to heavy precip will develop Wednesday evening and persist for several hours Wednesday night…possibly over the Cleveland metro early on before shifting into the primary Snowbelt for a good chunk of time, before swinging southeast and then weakening early Thursday. The main questions now become if temperatures will cool quickly enough to support accumulating snow, and if this happens, where will the heaviest precipitation and possible accumulations be?

wetbulb 27

One factor that may be important will be wet bulb temps…especially south of the band…as WSW winds into the band could advect in this cooler/drier air and allow wet bulb cooling to occur under the band along with dynamic cooling from lift within the band and perhaps precipitation drag of cooler air down to the lower levels. The NAM at 10PM Wednesday has wet bulb temperatures near 40F under the band and above 35F across much of northern OH…while the GFS on the right is several degrees cooler. The difference appears to be due to the NAM showing dew points in the mid 30s persisting inland until much later Wednesday night, while the GFS cools dew points to near or below 30F inland from the band after midnight. Dew points to our west are in the upper 20s/lower 30s, so I am inclined to believe the lower dew points inland, which would support wet bulb temperatures being a bit cooler. The wet bulb temps appear to cool enough for a change to snow to start occurring after 10PM.

NMM 2m temps

The NMM has temperatures under the band (this model has it across Lorain and Cuyahoga Counties initially) cooling to 33-36F by 10PM, with that cooling continuing as the band swings northeast over the next few hours into the primary Snowbelt after midnight. Given the potential for good dynamical cooling under the band and wet bulb cooling from cooler/drier air inland trying to get drawn into the band, a scenario like this seems quite possible…although the model does never get temperatures below freezing under the band.

NAM 925

The NAM shows 925mb temperatures starting to fall below freezing by 10PM Wednesday…and getting below freezing in much of the NE OH Snowbelt by 1AM Thursday…by 4AM Thursday it also gets 925mb temps below freezing in NW PA.

Based on when wet bulb temperatures inland get below freezing and when 925mb temps are progged to fall below freezing, my guess is that locations inland from the lake, especially in the higher terrain in Geauga County and NW PA, will start changing to snow by 10PM Wednesday and become mostly snow by around midnight. The precipitation should start as rain possibly mixed with graupel initially, as low level temps will definitely be too warm for snow initially.

hi-res QPF

The hi-res models are in decent agreement on 0.50-0.75”+ of QPF where the band stalls for a few hours late tomorrow evening into the wee hours of Thursday morning. The Euro and low-res NAM also even have over half an inch of QPF, and the GFS has 0.25-0.50” of it.

At this point, for placement of the lake enhanced band, the NAM, Euro, GFS and ARW (along with most of BUF’s WRFs) develop it initially over the Cleveland metro before quickly moving it northeast into Lake, northern Geauga, Ashtabula and parts of Erie/Crawford Counties, while the NMM and hi-res Canadian are a bit farther south. The band placement will be mainly driven by where the synoptic inverted trough develops and less by lake effect processes, however with WSW winds south of the band and a warm lake possibly trying to focus the surface trough a little farther northeast, I’m going to lean towards the north camp. The models do swing the band SE early Thursday morning, which could bring a period of decent precip in much farther west, but it would be brief. Lake effect conditions remain OK into Thursday morning, but the synoptic support will be over, and winds will turn onshore which will push warmer air over the lake farther inland, so I doubt there are any real accums in the NNW flow lake effect Thursday morning once the trough moves southeast.

Accumulations with the trough are ultimately tough…we’ll definitely have a good amount of QPF to play with, and given there are mesoscale processes driving the precipitation including lake enhancement, I have to think the hi-res models with the higher QPF are more on the mark. The question, how much falls as snow and how well does it accumulate? I don’t expect any accumulations before 10PM…but should see the precip change to mainly snow (especially inland) between 10PM and midnight, with accumulations likely starting in the higher terrain by midnight. This gives a few hours and a quarter inch or so of QPF of potential accumulating snow in the primary Snowbelt before the trough swings southeast and takes the band with it. This could give 2-3” in the higher terrain in northern Geauga County and southern Erie/northern Crawford Counties. If the changeover occurs any quicker, or the models are a little too quick in shifting the trough southeast, someone could get a little more. I could see 1-2” in the rest of the primary Snowbelt excluding the lakeshore, with little to none along the lakeshore, as surface temps should stay in the 35-40 range. Maybe a heavier burst deposits a dusting along the shore, but I struggle to see any more playing out. There could be a brief burst of snow farther west later at night, but with marginal surface temps and a short duration of decent snows, although some grassy/car top type dusting are possible, I don’t expect more than an inch outside of the primary Snowbelt right now.

Posted in Storm Forecasts | Leave a comment

11/22/15 Lake Effect Final Call

snow 11-22

I *finally* got around to putting numbers on my map and tweaking things.

Unfortunately, I definitely had to lower amounts from my initial thinking. The models all converged on a solution that was weaker with the storm, which allowed drier air to move in quicker. Of course, the Euro showed this solution two days ago, and I wrote it off since seemingly every other model disagreed with it. I’ve found that when I disagree with the Euro it usually pulls off the coupe, so maybe I should stop doing that.

The winds will be WNW late tonight into Sunday morning, and moisture looks pretty good through tonight, so I do think that there’s an initial burst late tonight into Sunday morning. Instability will be extreme by this point too. It still looks like things may get disrupted for a few hours Sunday afternoon as a little wind shift moves through, but we should see another increase Sunday evening as ridging over land causes convergence to increase over the Snowbelt.

As for amounts, instability is still going to be extreme and although moisture actually looks pretty marginal now, we do still have a long fetch working for us and the potential for some convergence over the Snowbelt to try to help focus things. Winds do look to go to a more true WNW direction which should try to push things into northern Lorain and Cuyahoga Counties, so I kept the idea of light accumulations there. The window for that looks to be a few hours long late tonight into Sunday morning, and with more questionable moisture I decided to only go with 1-2″ there. We’ve seen bands in this area surprise with a WNW flow before, so I suppose it’s not impossible someone gets 3 or 4″ in northern Cuyahoga County (outside of the far east side where I have it drawn in), but it’s not likely. I overall decided not to shift the area of heavier amounts much farther south in the heart of the Snowbelt compared to my first guess. There will be a pretty strong lake-land temp differential, which should create a pretty decent lake aggregate trough and tend to try to keep snow a little closer to the lake. With two potential windows for banding along with extreme instability and a long fetch, I still think a few or several inches could fall, but think amounts should stay under 6″. Confined the heaviest accumulations to the higher terrain.

Hopefully we get a more legitimate event soon!

Posted in Storm Forecasts | Leave a comment

November 22nd Lake Effect Snow Event

THE TIME HAS COME! For the first time this fall, we are looking at the potential for a decent lake effect snow event in Northeastern Ohio late Saturday night through Sunday night.

GFS 60 850

A fairly potent low pressure will track northeast across Lake Erie Saturday evening and push a strong cold front across Lake Erie. Behind this front, the coldest airmass of the season thus far will move into Northeastern Ohio on a west to at times west-northwest wind. This system will drop moderate to heavy snow across Iowa, southern Wisconsin, northern Illinois, Michigan, far northern Indiana and perhaps extreme northwestern Ohio. Very little synoptic snow from this system will fall in Ohio outside of far NW Ohio, where perhaps a few inches may fall Saturday into Saturday evening.

GFS 51 925

925mb temperatures will fall below freezing quickly by mid to late Saturday evening across N OH, signaling any remaining precipitation changing to snow. The deformation zone will miss NE OH well to the northwest Saturday night due to the low track being to our northwest, so any synoptic snow showers will not add up to much.

The attention will then turn to Lake Erie later Saturday night as instability increases off the lake and winds become better aligned out of the west.

BUFKIT 1

The GFS and NAM (NAM shown above) both bring the winds around to westerly with moderate lake induced instability, moisture to about 8k feet and high inversion heights by 6z Sunday. This should allow some lake response to begin late Saturday night. With a mainly west wind, you’d expect the best snow to occur over Lake, Geauga and Ashtabula Counties in NE Ohio into NW PA, with northern Cuyahoga County (especially northeastern) possibly getting grazed. The question at this point is how strong is convergence over the Snowbelt, and is any upstream lake moisture involved?

BUFKIT 2

The NAM and GFS both briefly get winds to a little more WNW for a few hours Sunday morning, before ridging starts building in and the winds starts slowly turning more W and then eventually SW.

BUFKIT 3

The GFS has a similar, brief backing of the winds to a slightly more WNW direction early Saturday, so this is actually pretty good agreement among the two American models at least. Both models have extreme lake induced instability (lake to 850mb temp differentials of 20-22C, lake to 700mb temp differentials of 30-32C, lake to 500mb differentials of near 40C, and 750-1000 J/KG of lake induced CAPE, to go with inversions remaining near 10-15k feet), moisture to at least 7-8k feet, and fairly negligible low level wind shear. This would seemingly support any bands producing heavy snows.

NAM 72 sfc

As winds start backing Sunday afternoon thanks to ridging building in, convergence should remain strong/possibly strengthen across the northern primary Snowbelt, but banding will also start slowly shifting up the lakeshore. Inversion heights and moisture depth really start diminishing Sunday evening after remaining decent to favorable through Sunday afternoon, and by midnight Sunday night any lake effect should be light to moderate and confined to perhaps northern Ashtabula County and Erie County PA as winds continue to back as ridging pushes in.

BUFKIT 4

The NAM maintains decent lake effect conditions at Erie until midnight Sunday night, before ridging pushes the winds completely offshore, inversions crash and moisture goes away. This should cause an end to the lake effect in NE Ohio by midnight Sunday night.

In general, the ingredients appear to be there for heavy lake effect snow:

-Instability is moderate to extreme late Saturday evening through Sunday evening

-Moisture depth is between 7-10k feet through Sunday afternoon

-Wind shear is fairly weak

-Steep lapse rates and high RH through the snow growth zone much of the event

-Long fetch

The big questions are when does convergence flare up and help support a strong, single band, exactly where does the band setup, does the band move much, and how will Lake Michigan moisture possibly influence lake effect off of Lake Erie?

NAM 4 57

With winds trying to turn more WNW early Sunday, that tends to strengthen convergence near the lakeshore…especially when surface pressures over land are trying to rise and push winds more offshore. The 0z hi-res NAM shows convergence starting to develop over the Snowbelt by 4am Sunday, and shows it persisting until the end of the run at 7am Sunday.

GFS 60 wind

The 0z GFS also has pretty strong convergence across the Snowbelt Sunday morning, but actually weakens it for a few hours Sunday afternoon. I can’t get a good zoomed in version of the lower res NAM right now, but it appears to do something similar. The GFS and NAM then both flare up convergence late Sunday into Sunday evening as ridging really starts nosing in, before any banding would then shift offshore:

GFS 72 10m

I’m not sure what causes this possible brief weakening of the convergence Sunday afternoon. The NAM appears to hint at potentially a very, very subtle trough moving by, possibly disrupting the wind fields? Either way, as we head towards evening, convergence should really increase as temps on land plummet and surface pressure continue to rise from the south. If there is indeed a small trough that passes early Sunday afternoon, which would argue for decent activity Sunday morning, as heavy lake effect often occurs just before a trough passes.

With pretty good evidence for decent convergence Sunday morning for several hours, I’d have to imagine a fairly well defined convergence band will form. With winds over the lake fairly strong and out of the WNW, this convergence and any associated band would likely settle inland a little bit into southern Lake, a good portion of Geauga and central and southern Ashtabula Counties. With a WNW wind, there is some risk of any band settling into northern Cuyahoga and perhaps even northeastern Lorain County too. If convergence weakens as shown on the models Sunday afternoon, any band could become disorganized for a few hours…although with well aligned winds, good shear, orographic lift in the higher terrain of the primary Snowbelt and still some frictional convergence, I can’t picture the snow completely stopping. I’d then expect the snow to redevelop Sunday evening as ridging really builds in and convergence increases again, although by this point the band would likely occur farther northeast than Sunday morning and slowly be shifting farther northeast as time went on.

NAM winds

As for how steady any banding would be, the NAM doesn’t show winds moving much late Saturday night into Sunday morning. There are some fluctuations, but no large shifts until Sunday afternoon when the winds start backing towards the southwest. With any banding Sunday morning driven by convergence caused largely by the lakeshore, and winds not moving a ton, it’s quite possible that any band late Saturday night into Sunday morning is fairly steady for several hours, before convergence possibly weakens for a time Sunday afternoon. By Sunday evening the winds will be shifting, so any band that redevelops along the eastern lakeshore may only stay over any given spot for a couple of hours.

NAM 4 57 radar

As for potential Lake Michigan moisture, the models are trying to signal a significant band developing over Lake Michigan Saturday night on a NNW wind behind the surface low, with the band possibly swinging east late Saturday night into Sunday morning as the low pulls northeast and the winds go more westerly off of Lake Michigan. The models are trying to hint at pretty good convergence with this band, with colder air trying to work in from the southwest. This could give a few hours of good Lake Michigan pre-seeding late Saturday night into Sunday morning. By Sunday evening the winds may be too southerly to get good Lake Michigan moisture to Lake Erie.

So, with all of this said, let’s try to figure out how things will play out and how heavy amounts may be:

I think there’s a good chance a good W-E convergence band develops after midnight Saturday night into mainly the primary Snowbelt…initially Lake, northern Geauga and Ashtabula Counties. The band should settle south some early Sunday morning as there seems to be good agreement on the winds going WNW in this timeframe. This should push the band into a good portion of Geauga County and southern Asthabula County, with northern Lake and Ashtabula Counties possibly seeing a lessening of snow at this time. With a WNW flow over the lake, if it actually occurs as currently modelled, convergence would likely increase enough along the central lakeshore for some banding into northern Cuyahoga and perhaps northeastern Lorain County Sunday morning for a few hours…with the best potential for decent snows on the east side, although not impossible for some accumulations on the west side. There seems to be support for convergence weakening for a few hours Sunday afternoon, possibly due to a weak trough moving through and altering the wind fields, which may disrupt the band some. However, there should still be enough support for at least snow showers continuing. Winds do start backing slowly Sunday afternoon so the snow should end during the afternoon in Lorain and much of Cuyahoga County, and shift north some in Geauga County. By Sunday evening, rapidly falling temps overland and high pressure continuing to nose in should cause convergence to increase again…probably across Lake and northern Ashtabula Counties…likely causing any banding to reflare. The banding should slowly shift northeast up the shoreline and be out of Ohio around midnight or so Sunday night.

With extreme instability, decent moisture, high inversion heights, fairly low wind shear and the potential for Lake Michigan moisture helping things late Saturday night into Sunday morning, snowfall rates of 1-2” per hour seem possible under any banding. If banding becomes slow moving for several hours as I expect, snowfall totals would quickly approach half a foot in the favored areas and could exceed it. With 850mb temps cooling below -10C by Sunday morning with 925mb temps of -5C through the event, any decent snow band will produce accumulations down to the lakeshore…and in the lower elevations of Cuyahoga and Lorain Counties…although, warmer surface temps near or slightly above freezing near the immediate shoreline could cause lower snow ratios and hence somewhat slower accumulations near the immediate lakeshore under any banding. If banding becomes more disorganized for a period Sunday afternoon as seems possible, snow accumulations would obviously slow considerably. By Sunday evening moisture and inversions do fall some, so snow rates may not exceed 1” per hour consistently in any re-flareup as it looks now.

I’m not extremely confident in throwing out hard accumulation numbers yet…although I will certainly do so Friday evening at some point…however, I suspect that locations that get under the good band Sunday morning…assuming it forms…would likely be the jackpot. At this point I think this occurs in far southern Lake, the northern half of Geauga and central Ashtabula Counties. Moderate accumulations could occur in parts of eastern Cuyahoga County and also along the lakeshore where banding may not be as consistent during the heaviest part of the event. I do think there’s opportunity for prolonged enough banding with good rates to see totals of at least 6” wherever the jackpot zone occurs…with a decently large area seeing at least 3”.

Potential caveats are the Euro is weaker with the surface low than the GFS/NAM/Canadian/UK and has a shorter window of good lake effect. The Euro did trend some towards the more amped camp this run. The GFS has remained extremely consistent with its solution. This gives me decent confidence the event plays out similar to what the GFS would imply, but it’s not 100% confidence yet.

With that said, here’s my general thinking…I’ll put hard numbers on this Friday evening.

11-22 no neo

Posted in Storm Forecasts | Leave a comment

11/14/15 Long Range: Thanksgiving Week Cooldown Idea Gaining Steam

current 500

Model images in this post came from:

weatherbell.com, tropicaltidbits.com, weather.cod.edu, instantweathermaps.com and the University of Berlin’s Atmospheric Diagnostics website.

A brief cool down is occurring in the Northeast US, with some lake effect snow, after another good shot of mild air across much of the central and US this past week. This cool down is the result of an upper trough associated with a storm that brought severe weather to the Midwest moving east, and being slowed down by a transient west-based –NAO (1).

This pattern will not last long, as the very large trough (2) centered over Alaska is sending another very potent shortwave down into the western US this weekend. This shortwave will phase with the sub-tropical jet and produce another large storm in the central US during the first half of this upcoming week, with heavy rains, gusty winds, severe thunderstorms and backside snow all threats somewhere with it. This recent pattern of frequent troughs dropping into the west has been very good for ski resorts out there, and they need it in the worst way after the last few winters.

Other features of interest over the next couple of weeks that are currently on the hemispheric map will be a strong jet over Asia and the western Pacific (3) that will attempt to coax ridging up towards Alaska and dump cold into Canada and the central US, and a potentially favorable look (4) for a later winter –AO developing over Siberia.

EPS 72

Ok, so let’s start diving in now. As we head into the work-week, more heavy western US snow is likely as another very potent trough dives into the Four Corners region. Although a west based –NAO exists, short wavelengths allow for ridging to build between the western US trough and the “50/50 low” near Newfoundland. This allows for the eastern US to quickly forget about the current chill, and allows quite a stark temperature gradient to develop across the central US as this large trough ejects out of the southwest.

GFS 250 84

The result of this trough is the polar jet phasing with the sub-tropical jet and causing a respectable jet streak to eject out into Texas Monday into Tuesday, with a stout temperature gradient over the Plains. The wavelengths are shorter than typical for mid-November and are allowing for a very meridional weather pattern to develop over the US this upcoming week:

GFS 84 850

The strong jet streak, strongly curved flow with the trough and strong temp gradient over the Plains results in yet another deep surface low developing over the Plains Monday into Tuesday and slowly moving northeast. The strong pressure gradient between the deepening surface low over the Plains and a fairly large high over the eastern US results in a large area of prolonged and strong southerly flow ahead of the surface low, advecting quite a bit of warmth and moisture north ahead of the low:

GFS 96 PWAT

The GFS has a swath of 1.3” PWATs getting into the Great Lakes and 1.8” PWATS getting close to the Ohio River…both of which would threaten record high PWATs for the time of year. The closed off nature of the upper trough as it moves across the Plains this week, very moist air ahead of the system and a strong low to mid-level flow will result in a potential swath of significant rains across parts of the Plains east into the Mississippi Valley and potentially the lower Ohio Valley. In addition, strong wind shear and a relatively warm/moist airmass could result in severe weather threats across the southern Plains on Monday and potentially farther east and north on Tuesday. On top of the rain/severe threats on the warm side of this system, there will be enough cold air on the backside of the system for snow. The slow moving nature of the storm combined with the strong nature of the storm could result in a blizzard across parts of the Rockies east into parts of the Plains. The GFS has trended faster (and towards the Euro) recent runs which has caused it to cut down snow totals in the Plains, but this could still be enough to have an impact on the backside of the low:

GFS snow

In the grand scheme of things, the bigger impact this system may have on the overall pattern is to possibly (like the storm that recently moved through the Midwest and Great Lakes) coax a negative NAO by next weekend:

EPS 120

The prolonged and strong warm air advection ahead of the storm as it slowly moves across the central US will cause heights to rise across the eastern US and Canada, and as the trough over the central US comes east it may try to undercut the ridging over eastern Canada and cut it off, causing a –NAO to form. The 12z Euro ensembles showed this occurring emphatically, and had strong agreement from the operational version of the model:

EPS 192

The significance of this –NAO, even if it only lasts for a few days, would be to potentially help cold air move farther east in the US as the Pacific pattern becomes more favorable over the next 7-10 days. The 18z run of the parallel GFS ensembles (which will allegedly become operational in December) attempted to develop a –NAO like the 12z European suite, but didn’t quite get there:

PGEFS 192

Yes, the ensemble did show a significant height rise into the Davis Strait and Greenland, and if this occurred it would probably cause the numerical values of the NAO to be negative…however, this type of setup is rather transient looking and wouldn’t be as helpful as a European type solution. Note how the ridge into Greenland is more of a thumb ridge extending up from the US East Coast, as opposed to a blocking ridge, with the negative height anomalies south of the low well off the East Coast (as opposed to closer to Newfoundland). Here’s what the 18z parallel GFS ensembles looked like a couple of days later:

PGEFS 240

Although yes, positive height anomalies persist in the NAO domain and yes, this North Atlantic pattern wouldn’t be a negative for cold over the eastern US, you can see that again it’s just a thumb ridge extending into Greenland, which may not to a whole lot to slow down troughs over the eastern US and allow them to dig, which is what a classic –NAO does.

EPS 240

The 12z European ensembles are marginally better at day 10, with an independent ridge over Greenland/the Davis Strait (NOT a thumb ridge extending north from the mid-latitudes). This block isn’t the strongest, but would in my opinion be a somewhat better North Atlantic look than the 18z GFS ensembles. What the Euro ensembles do that is very interesting is begin to develop a “ridging over the top look” with ridging into Alaska and Greenland, with troughing underneath across the US. This would be a good looking pattern for below to potentially well below normal temperatures in a good portion of the CONUS Thanksgiving week.

The 0z Saturday operational GFS trending significantly slower with the Plains storm this week (like the Euro), and came in with a better –NAO next weekend than previous runs. We’ll have to see if the ensembles and future runs continue to support this idea, however it may not be a coincidence that the GFS trended more towards the Euro with the central US storm and conversely trended toward the Euro’s stronger –NAO idea:

GFS 192

The ridging along the East Coast isn’t optimal, but a closed off 573dm contour near the southern top of Greenland with an upper low pinned south of that ridge is a pretty solid –NAO.

A huge key to the potential cooldown Thanksgiving week that both sets of ensembles are at least hinting at above is ridging developing in the NE Pacific and nosing into Alaska, allowing cold air to start filling up in Canada and potentially moving south into the US.

If you read my post last week, you remember that I discussed the ensembles retracting the Pacific jet before Thanksgiving, which supports ridging in the NE Pacific and a cooler CONUS weather pattern. However, I was struggling to find irrefutable evidence that the jet retraction would occur long enough for ridging to develop where we want it to for cold in the US, and at that time the ensembles were not emphatic about above developing the ridging. I did go for at least seasonable to somewhat cooler weather in the central and possible US for Thanksgiving week and suggested I’d have a better feel for that this week. And at this point I’m more optimistic for a few reasons.

GEFS 250 240

One reason I’m more optimistic is the GFS and European ensembles have consistently, run after run, shown the jet retraction beginning to occur next week and persist through much of Thanksgiving week. They began hinting at this in their Thursday, November 5th runs (at least that’s when I picked up on it) and HAVE NOT WAVERED in the jet retraction. It is a good sign when the two top medium range ensembles in the world do not waver on such a major idea for so long.

The reason this jet retraction is important is because divergence in the left-exit quadrant of the jet supports storminess and lower heights; this puts lower heights near or west of the Aleutians, which puts ridging over the NE Pacific due to mass transport of warmer air north to the east of a trough and general storminess. This ridging is key to cutting off the flood of mild Pacific air into the continent and allows Canada to become colder, which makes it more likely for truly cold (not just these come and go marginal cool shots we’ve been seeing the last month or so) to try to move south into the US if there’s a mechanism to bring it south.

One reason I’m more confident in the NE Pacific ridging develop within a week and persisting through Thanksgiving week is there’s now a more clear signal for the jet retraction to even occur. It’s not just ensemble voodoo at this point.

200mb vpa

Part of the reason appears to be Indian Ocean convection remaining very persistent over the last few weeks, and likely persisting for at least the next week to 10 days. The Indian Ocean convection appeared to have possibly suppressed the El Nino related enhanced convection for a couple of weeks, rather unexpected for such a strong El Nino, although some convection is returning to the Tropical Pacific. As long as the Indian Ocean convection persists and the El Nino convection doesn’t get too strong too far east (which it right now isn’t, it’s strongest near the International Dateline which is decent), the enhanced Asia jet idea and weaker eastern Pacific jet remains on the table.

The reason the enhanced Indian Ocean convection persisting appears to be important is it likely helps re-enforce a rex block over eastern Asia that is pinnacle to the strong Asia-west Pacific jet:

GFS asia 144

The enhanced Indian Ocean convection strengthens the jet over western Asia, which keeps storminess and lower heights over north-central Asia, beneath a Barents-Kara Sea high. The lower heights over Asia, possibly bolstered by strong radiational cooling due to above average snow cover in Siberia, contribute to a very strong pressure gradient over SE Asia which results in the enhanced jet here. The GFS and Euro and both sets of ensembles agree on the idea, and tropical forcing seems to support it, so I’m becoming rather confident the jet retraction will occur.

global IR

One possible concern would be increasing Pacific convection causing the jet retraction to struggle to realize itself. At this point, the most persistent convection is located along the Dateline, which is near the latitude of the Aleutians…strong convection here wouldn’t affect the jet retraction. I think at this point the Asian pattern is locked and loaded for a very strong jet over Asia and the western Pacific, which should cause the jet retraction and attendant NE Pacific ridge to occur regardless. A flare-up of convection farther east in the Pacific may just bring an end to the pattern by early December. We’ll see. The GFS and Euro are both hinting at a recurving typhoon in about 10 days which could bolster the pattern and allow favorable Pacific ridging to persist into the first week of December.

How strong the NE Pacific ridge gets will be interesting. It continues gradually trending stronger on the ensembles, and the 0z op Euro just came out with enough ridging to actually facilitate a cross-polar flow into central Canada, which would allow some true arctic air to possibly come into the equation Thanksgiving week. It’s one op run…but something to watch if the trend for a more amplified NE Pacific ridge continues:

ECM 240

Given all of this, here is my forecast for the next three weeks:

November 16-22: Starts mild in the east and cold in the west. A strong storm brings heavy mountain snows to the west, possible snow to parts of the central Plains, heavy rain to the Plains, Mississippi Valley and Ohio Valley, severe weather in the southern Plains and possibly east towards the Mississippi Valley, and warmth to all of the eastern half of the US for a few days. Cooler behind the system across the Midwest, Great Lakes and possibly New England late this week into next weekend.

November 23-29: Increasing evidence of cold centered in the central US; possible that troughs still dive into the Rockies as the Euro shows, allowing for colder than normal conditions here too. Eastern US call is tougher and more NAO dependent, however I have to believe a gradient pattern may develop where New England is colder than normal, the Mid-Atlantic is near normal and the SE is warmer than normal. It’s possible that true arctic air is tapped this week, which would most likely dump into the central US by Thanksgiving, possibly setting off major lake effect snows. A gradient pattern…with the heart of the cold dumping into the central US…could possibly support some sort of synoptic snow from parts of the southern Plains east across the Ohio Valley, Great Lakes, Appalachians, interior Mid-Atlantic and New England. Where exactly this occurs (or if) is highly dependent on if we can pull off a –NAO, and if Alaskan ridging can build enough to tap arctic air. Neither is a certainty, so the prospects for potential well below average temps in the Midwest and a possible snowy system are uncertain but certainly non-zero.

November 30-December 5: This may be when El Nino starts flexing its muscles again. I suspect this week could end up below normal across the east, but we may see a Gulf of Alaska low start to return, starting to flood the western and central portions of the continent with milder air.

A word about the stratosphere (since I said last week I’d try to mention it this week):

winter outlook SAI steps

A part of my winter outlook was October snow cover advancing faster than normal across Eurasia, possibly supporting a second half of the winter flip to a –AO per research done by Dr. Judah Cohen. Let’s check on the steps so far:

  1. Siberian snow cover advanced faster than normal in October.
  2. Snow cover induces surface cooling:

EPS 96 globe

EPS 192 globe

Both the GFS and European (shown) ensembles have higher than normal surface pressures over Siberia over the next week to 10 days, corresponding to strong radiational cooling in this area. Step 2 appears to be getting underway on schedule.

3) Tropospheric jet amplifies, enhances polar heat flux/vertical wave propagation:

As discussed above, the tropospheric jet is amplifying south of the Siberian cold over the next week to 10 days, supporting our pattern change! Ridging on either side of the Siberian block could qualify as enhanced polar heat flux if they persist/occur as currently forecast, which may allow vertical wave propagation into the stratosphere to begin occurring:

EPS 240 globe

It’s also not impossible that if a strong –NAO develops it also upwells a bit into the stratosphere.

The GFS and Euro both appear to attempt to start upwelling some warmth into the stratosphere in the long range, although it should be noted this is still fairly far out, and would need to persist to be of help for our later winter AO state:

ECM 240 strat

The Euro (shown) and GFS both have warming beginning to become evident, especially between 20mb and 70mb by 10 days from now over the northern Pacific, possibly related to the aforementioned Asian and Pacific pattern. This would need to persist to really alter the stratospheric vortex and possibly coax a –AO maybe in January, because the +QBO base state combined with the very very strong polar vortex as is will attempt to fight off any attempts at warming:

Euro 1

The 1mb polar vortex is very strong and well organized for mid-November. We’ll need to attack that moving forward.

One more encouraging sign, besides the Asian pattern seemingly trying to follow Cohen’s SAI theory model, is this difference map I threw together just for shits. I simply took Novembers that proceeded a +AO winter since 2000 and subtracted them from Novembers that proceeded a –AO winter since 2000 to see what differences in the pattern were evident across Asia:

AO diff

It’s important to note that these years only looked at winter AO and the November 500mb heights over Asia, and ignored all other factors. But, it’s interesting that lower heights over central and eastern Asia with higher heights over the top across the Barents-Kara Sea in November occurred in months that proceeded –AO winters when compared to months that proceeded a +AO winter.

Anyways, I really need some rest, so that’s all for this post. I think I gave you enough to chew on for a little while.

Posted in Pattern Discussion, Storm Forecasts, Storm Speculation | Leave a comment

11/8/15 Long Range: Early November Blow Torch is Over; Any True Cold Coming?

current 500

It was a very warm first week of November in the central and eastern US, with many record highs (including some monthly records) broken from Florida all the way up to Michigan. The weather pattern still isn’t a cold one, with three of our main teleconnections for North America pointing to a cool west and warm east, however this will change some as we head towards the end of the week; the question is, will this be enough of a change to allow for a good shot of below normal air to occur with possible snow, or will it just be enough of a change to knock temperatures back closer to normal after last week’s very warm conditions?

GEFS 72

As we head towards mid-week, a very potent shortwave associated with a 150kt+ jet streak will eject out of the Rockies into the Plains and cause a strong lee cyclone to form and track towards the Great Lakes. The strong jet streak combined with a tight temperature gradient between cold with the trough moving out of the Rockies and persisting warmth over the southern and eastern US will allow this low to become quite deep as it tracks into the Great Lakes, possibly fostering an outbreak of severe thunderstorms and causing a large area of gusty winds behind the system:

GFS 84 850

If time permits I’ll have a post detailing this system Tuesday night (assuming it still looks to be a potentially potent severe threat), but the main impact in the bigger picture this storm will have is to re-enforce ridging over eastern Canada and then undercut it, causing a bit of a west-based –NAO block to form:

PGEFS 144

The parallel GFS ensembles (they’ll be operational at some point) show a decent little ridge over eastern Canada and the Davis Strait, which is enough to slow the trough down over the eastern US and force it a bit farther south. There MAY be enough cold air with this solution for perhaps some minor lake effect snow off of the Great Lakes and some upslope snow showers in the mountains in northern New England, but overall the –NAO is not very strong or well located for big East Coast storms moving forward, and there’s no real 50/50 low either…so essentially the upper low/trough continues to eventually move east under the ridge:

PGEFS 216

You can see by day 9 that the trough has moved northeast away from the US, showing that although there is a modest –NAO block, which doesn’t hurt, it really isn’t significant enough to have a major impact on the pattern in the day 6-10 timeframe…although it may slow down/amplify the trough enough for a couple days of below average temps over the Northeast. The 0z ECM and 12z GGEM ensembles agree with this evolution.

By this point in 9 days, the look from the GFS ensembles has improved some from current; although it’s not a classic block, there is some west based –NAO ridging, and higher heights over Siberia and the Davis Strait are extending into the Arctic and at least allowing the AO to trend to more neutral values; this downward AO trend is more a result of tropospheric influences than it’s due to any stratospheric activity, as the stratospheric polar vortex is currently very strong and strengthening (which isn’t uncommon for November). The next opportunity for some upwelling and weakening of the stratospheric vortex may come later this month (and I’ll try to look at that more next weekend). The Canadian and Euro ensembles in the day 8-9 timeframe do overall show a similar look:

GEPS EPS 9

The ESRL GFS ensemble based teleconnection graphs do show the improvement in the NAO department over the next 7-10 days, but also show the issue, that is also plainly visible on the images above too:

ESRL teleconnections

Although the Atlantic and Arctic improve slightly, the Pacific remains rather putrid for eastern US cold for at least the next 10 days. The PNA remains negative, indicative of higher heights near the Aleutians and lower heights along the west coast, while the EPO remains positive, indicative of troughing over the Gulf of Alaska and Alaska, which floods much of the continent with mild Pacific air. The WPO being positive isn’t as much of a kiss of death if the low height anomaly with it ends up a little farther south or west towards northeast Asia, however this isn’t the case over at least the next 10 days. Basically, these indices are telling us that a small black hole will form over Alaska and the Gulf of Alaska over the next week and a half at least, which will flood the continent with mild Pacific air…so any marginal NAO help probably won’t be able to overcome this and allow for sustained cold in the east. In fact, it wouldn’t surprise me with such a strongly negative PNA that the week of the 16th at least starts warmer than average in the east after a few days of cooler weather centered on next weekend.

current global IR

Last week I discussed how tropical forcing was becoming stronger from the Indian Ocean, and this has remained the case this week. This supports higher heights over a good portion of the northern Pacific and troughing over the western US. There is a bit of change this week as some convection has begun re-flaring in the Pacific just east of the Dateline, although the Indian Ocean convection has generally been stronger and more persistent this week. Here’s what the global jet stream looks like:

GEFS current world

It’s again important to explain how/why tropical convection can alter the hemispheric weather pattern: more persistent convection releases latent heat along the equator, causing higher heights north of the convection and a stronger jet stream due to a tighter pressure gradient aloft. When the jet stream gets east of the persistent convection and attendant higher heights you get an area of divergence, which tends to support storminess, which pulls warm air north east of this region and causes a ridge aloft. Extra-tropical forcing can also affect the jet stream, tropical convection/forcing is just an (important) part of a larger equation.

On the above image, which is essentially current (it’s a 12 hour forecast), you can see a stronger jet north of the persistent Indian Ocean convection, and some attempt at ridging over the central Pacific, which does support western US troughing as discussed last week. The increasing convection just east of the Dateline may also be supporting a stronger jet over the north-central Pacific, which supports storminess over Alaska. If this storminess is persistent it can cause a fairly persistent upper low to develop over Alaska/the Gulf of Alaska, which the three ensembles all suggest happening over the next 7-10 days. From here, it’s important to try to predict what convection in the tropics will do over the next couple of weeks to find out if a more improved Pacific pattern may try to develop:

200mb vpa

It’s evident that over the last 2-3 weeks that Indian Ocean convection has flared up significantly, to the point where it suppressed the El Nino related convection over the Pacific, as discussed last week. The Indian Ocean convection appears to have edged east over the last week, while there are some signs per the time longitude plot and above images that the El Nino convection may be trying to fire back up. It will be interesting to see if the Indian Ocean convection really weakens or holds steady. Although it has edged east slightly over the last week, an argument can likely be made that the Indian Ocean convection is more of a standing wave than a propagating MJO, as it has moved very slowly.

MJO phase models

The GFS and Euro ensembles both appear to agree on the convection over the Indian Ocean trying to weaken over the next week, although to what extent it weakens is disagreed upon. The convection has persisted more than either model expected a week ago. The GFS ensemble solution shows the Indian Ocean convection completely weakening, which would likely allow El Nino forcing to take back over during the next 1-2 weeks. The GFS ensemble does then show another flare-up developing in the 10-14 timeframe in a potentially more favorable area if you want cold in the eastern US. The European ensemble shows the convection remaining over the Indian Ocean but perhaps weakening some. The Euro makes a bit more sense to me as the convection isn’t a propagating wave, and if El Nino convection does try flaring back up over the next week or so it may try to suppress convection elsewhere. In general, I’m not really hot on the idea of convection becoming more focused near the Dateline in the near future, which is the eastern US cold sweet spot.

GEFS global 312

One interesting feature to note, is that the GFS (shown) and Euro ensembles have both been persistent in their idea of retracting the Pacific jet for a few days around November 20th, perhaps as a result of convection in the tropics shifting around some. If this occurred, it would suggest the low over Alaska shifting west towards the Aleutians, causing the PNA to rise and the EPO to fall in about two weeks. As far as my interpretation goes, I don’t think tropical forcing supports this persisting for an extended period of time, but both ensembles have shown this for a few days. This could support a cool down in the central US (that possibly works east) Thanksgiving week.

GEFS 384

Both ensembles (GFS ensemble shown) begin extending the jet again after a few days, which would make sense if convection increases in the central Tropical Pacific in associated with the El Nino and very warm waters there. This leads me to believe that any Pacific driven cooldown around Thanksgiving would be short lived.

GEFS parallel

The parallel GFS ensembles do attempt to show a brief improvement in the Pacific pattern around the 20th as the Alaskan low retrogrades west, which would possibly support ridging over Alaska/western Canada and allow some cold into the central US, but note how the low starts shifting back west towards Alaska towards the end of the run, which would likely allow Pacific air to start blasting into North America again shortly after Thanksgiving.

In general, I’m thinking that after the east warms back up for the first few days of this week that a few days of below average temperatures do occur across parts of the Great Lakes, Ohio Valley, New England and northern Mid Atlantic as a west based –NAO occurs and causes a trough to slow down and amplify some as it tracks across the Northeast. The Western US should be mild in this timeframe.

As we head into the week of the 16th I expect near normal temperatures and stormier conditions to return to the west (especially the northwest), with milder weather compared to normal over the central and eastern US.

Between the potential for modest NAO help and some ensemble suggestion for a brief Pacific pattern improvement, it wouldn’t surprise me if Thanksgiving week is a bit cooler than average over the central and eastern US and warmer than average over the west, but I expect El Nino forcing to allow for a Gulf of Alaska to return to start December, resulting in a mild start to the month.

Posted in Uncategorized | Leave a comment

11/1/15: Warm Start to November

current 500

As we flip the calendar to November, many of the teleconnections are pointing to warmth in the eastern US and cooler conditions in the west. Lower than average heights over the North Pole are indicative of a +AO, with lower heights over Greenland and the adjacent N. Atlantic associated with a fast flow south of Greenland and Iceland, associated with a +NAO, with high heights over the Aleutian Islands and lower heights near the US West Coast, associated with a –PNA. The lower heights over western Canada into Alaska can also qualify as a +EPO. All of these teleconnection signs point to a trough over the western US and a ridge over the eastern US over the next several days, with the European ensembles showing this by midweek:

ECM ENS 96

This would result in active weather continuing in the west, where they desperately need the rain, with warm and mainly dry weather over the east. The European and GFS ensembles are in good agreement in ejecting the trough out of the west and providing for a brief cool down in the Midwest, Great Lakes and Northeast to end the work-week and into next weekend, however, the PNA stays negative and the AO/NAO stay largely positive, suggesting this cool down will be transient and not particularly intense:

ECM ENS 168

The European ensembles do indeed build the western US trough and eastern US ridge back into place by the time we start NEXT work-week (the week of November 9th):

ECM ENS 240

It appears that for those excited for winter in the east that they’ll have to wait until later in November for any hope. The GFS ensembles are in agreement, keeping all three main teleconnections unfavorable until at least mid-November, with very few members deviating from this. Yes, the NAO and AO start trending down towards mid-month, but this isn’t a strong enough signal (on its own) to forecast a cold second half of November:

GEFS tele

This November warmth may come as a surprise to many, as believe it or not, most strong El Nino events since 1950 have featured a cold November in the central and eastern US:

Strong Nino November

This begs the question, why is this discrepancy occurring this November, and how long will it continue? The likely explanation for this departure from a “normal” El Nino pattern for at least the first half of November likely has to do with MJO activity in the Indian Ocean:

MJO 90

After the bulk of the last 90 days featuring no MJO activity, which is quite typical in stronger El Nino events, as tropical forcing is dominated by consistent convection over the central and eastern Tropical Pacific in strong El Ninos with subsidence and limited convection elsewhere, the last week or so has featured an MJO “flare-up” in the western Indian Ocean. MJO activity here is actually more typical in La Nina events, when the waters in the central and eastern tropical Pacific are cooler than normal, so it’s not a surprise that MJO activity typically associated with a La Nina (the opposite of El Nino) forces quite a different North American weather pattern than what we’d expect with an El Nino.

You can visualize the difference in convective forcing over the last week by examining outgoing longwave radiation (OLR) plots; lower OLR is associated with more clouds and precipitation (in the tropics, this usually means thunderstorms that can affect tropical forcing), while higher OLR is associated with fewer clouds and precipitation:

OLR 90

The strongest tropical forcing occurring near and east of the International Dateline enhances the jet stream over the central Pacific (due to latent heat released from the convection increasing geopotential heights in the Tropics and tightening the pressure gradient north of this area), forcing a low south of Alaska (due to favorable upper level divergence in the left-exit quadrant of the enhanced jet), forcing a ridge over central and western N. America. The last 90 day 500mb pattern matches this idea fairly well (although not perfectly over eastern N. America):

500 90

Over the last week, the OLR anomalies clearly show the more active convection over the Indian Ocean (and somewhat less impressive convection over the eastern Pacific), which changes where the tropical forcing occurs and alters the large scale weather pattern across the entire Northern Hemisphere, as the jet becomes more enhanced over Asia, and not the Pacific:

OLR 7

The 500mb pattern over the last week, while not perfectly resembling the look above, does have the general idea:

500 7

There is still some sign of typical El Nino forcing, with a low over the Aleutians, however it is significantly diluted from what you’d expect in a typical El Nino pattern (typically in strong El Ninos, this low is stronger and farther southeast in November).

In attempting to determine how long this trough west/ridge east pattern will continue into November, the key likely lies in determining how (or even if) the current MJO activity will propagate east, and when more convectional El Nino tropical forcing will return.

MJO phase models

The GFS and European ensembles have slightly different ideas over the next two weeks; both models do suggest the MJO will weaken some, however, the GFS maintains the more active convection over the western Indian Ocean and keeps the MJO safely outside of the “circle of death,” while the European slowly propagates the MJO east will weakening it. The European solution would likely result in more typical “El Nino” forcing returning in 2-3 weeks, while the GFS would belabor that process.

Given that strong, basin wide El Nino events (with the exception of 1987-88) tend to feature limited MJO activity, the European solution makes more sense, and would likely result in near normal temperatures in the eastern US for the last week to 10 days of November, with warmer than normal temperatures building into the west (especially the Northwest, compared to normal) and perhaps northern Plains (so, the pattern would start to take on the typical canonical strong El Nino look by the end of the month).

However, this MJO activity will have to be monitored closely as we head through November to see if it will in fact just weaken, returning us to El Nino dominated tropical forcing. It isn’t normal to have a basin wide El Nino that is this strong, period, however the very warm waters along the west coast of North America and in the Indian Ocean may be indicators that typical very strong El Nino progression may not work out “perfectly” this winter, as I discussed extensively in my winter outlook.

As for AO/NAO help, at this point it’s a waiting game to see if we can start getting an attempt at enhanced heat flux from the troposphere to the stratosphere in November as Dr. Cohen’s Snow Advance Index suggests, along with other research. Any AO/NAO help later in November would likely have to come from tropospheric influences.

I’ll attempt to update these longer range, large scale pattern posts once a week or a little more frequently, but that’s dependent on how busy I am on a week to week basis.

Posted in Uncategorized | Leave a comment

10/27/15: Quick Thoughts on Potential Wednesday Low Topped Severe Wx Event in Eastern US

Definitely think there’s some interesting potential for a low CAPE/high shear severe weather event from portions of Ohio and West Virginia points east across Virginia, Pennsylvania, New York, Maryland, Delaware, New Jersey and perhaps parts of New England late Wednesday afternoon straight through to very early Thursday. Although the previous SPC D3 outlook basically punted another day, I suspect they’ll start introducing severe probs for a fairly large area, and depending on how things evolve I could see a decent slight risk area (potentially even an enhanced) being needed for some of the areas outlined above.

There will be two primary areas to monitor for potential severe weather:

1) Main cold front moving east across parts of eastern OH/WV/upstate NY/PA/MD into New England, NJ and DE late Wednesday afternoon through early Thursday morning.

2) A secondary cold front across Ohio/WV and perhaps adjacent northern KY/western PA late Wednesday afternoon into Wednesday night.

NAM 500

NAM 850 1 NAM 850 2

NAM 925

Very strong 500mb winds are expected to overspread the warm sector Wednesday afternoon into Wednesday night, with surface to 500mb shear near or above 50 knots over quite a large area. Very strong low level winds and associated high low level shear values are expected along and ahead of the main cold front Wednesday and Wednesday night…with 850mb winds of 50-70 knots over quite a large area and 925mb winds of 40-50 knots even.

NAM vort

NAM moisture div

NAM skew-t

With a potent vort max and strong height falls overspreading the warm sector Wednesday evening and night…and strong lift with the surface cold front…even though CAPE will be meager (on the order of a couple to few hundred J/KG of MLCAPE) I’d have to imagine that low topped convection will develop along and ahead of the cold front by Wednesday evening and rapidly progress east. The shear values look very supportive of any line segments easily producing strong to at times damaging winds, and there appears to be enough low level turning and helicity for the possibility of a spin up tornado or two.

The NAM and GFS both develop a little instability along a trailing secondary type cold front across OH later on Wednesday into Wednesday night, and the NAM really ramps up shear in this area Wednesday evening too, so some locally strong to damaging winds wouldn’t surprise me if any convective showers can develop along this feature farther west Wednesday afternoon into Wednesday night…although the strongest forcing and strongest low level shear (and overall better threat) appear to be farther east along and ahead of the primary cold front.

Posted in Uncategorized | Leave a comment

Jim Sullivan’s 2015-2016 Winter Outlook for the United States

Here is a look at my winter outlook for last year (along with links to previous outlooks):

https://ohwxramblings.wordpress.com/2014/10/12/jim-sullivans-2014-2015-winter-outlook-for-the-us-and-southern-canada/

Maps and Brief Summary:

This winter will be strongly affected by a very strong “El Nino” in the Tropical Pacific. This will likely result in a warm December, an up and down January, and a cold February in the Eastern US. The western US will become warmer as the winter moves on. Precipitation will be abundant across the Deep South in response to the El Nino. I expect the El Nino to contribute to continued rain/snow chances in California through December, before conditions gradually dry up in January and especially February.

There could be an active storm track from the southern Plains east towards the East Coast. Locations like the Great Lakes may stay north of the big storms, while locations like the Ohio Valley are near the northern edge of the active storm track later in winter.

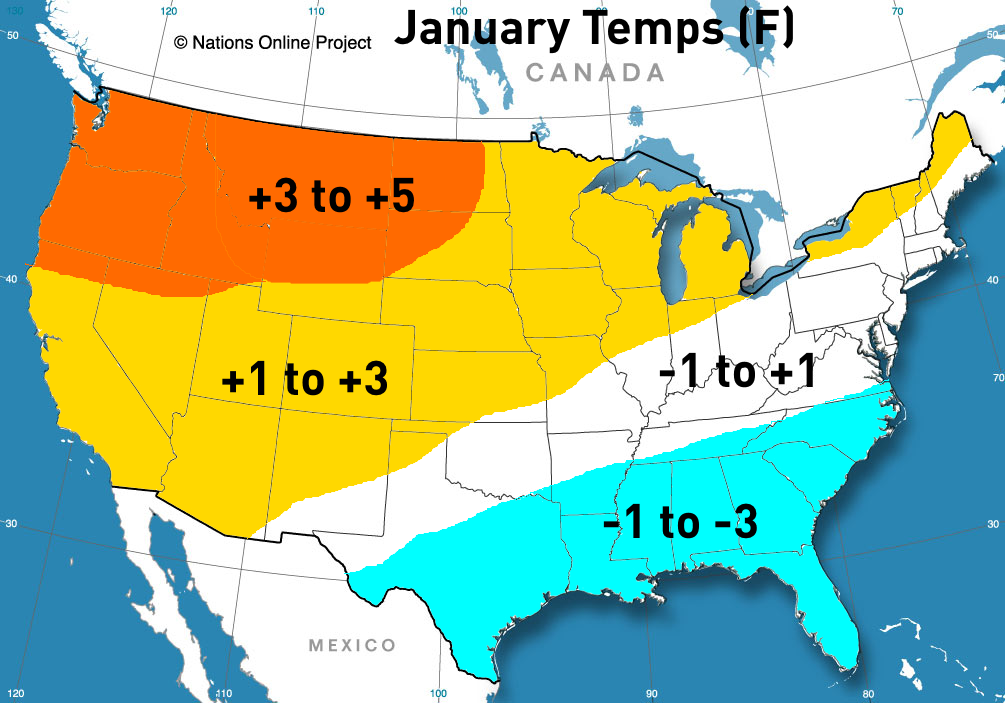
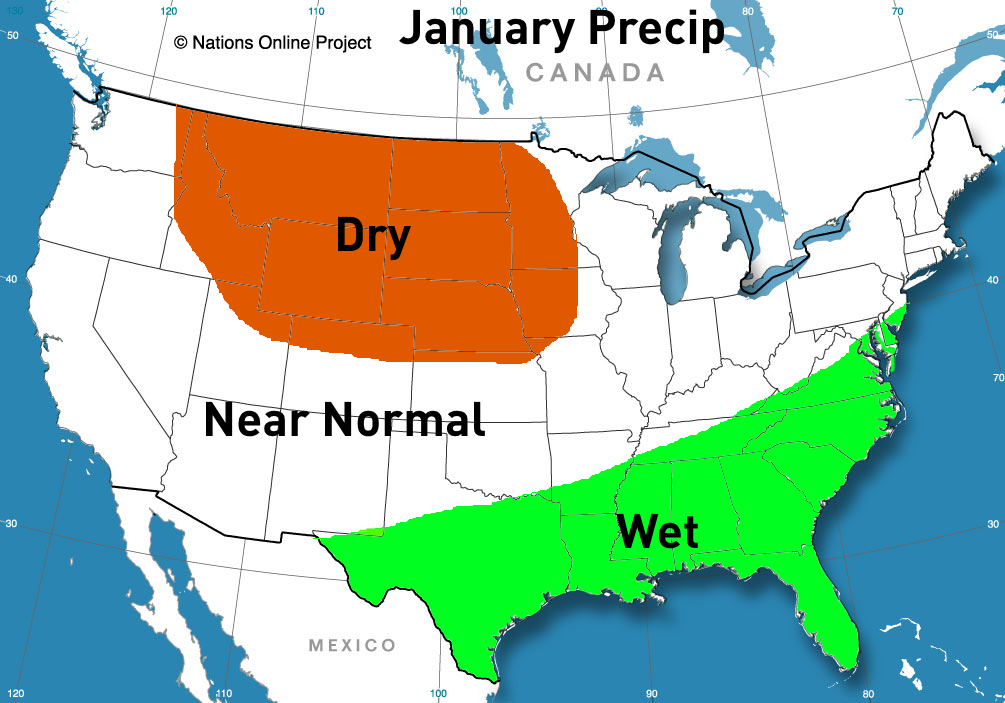
The following are maps depicting departures from normal for the winter months across the country for temperatures, and general precipitation patterns. Remember a warm month overall can still have some cold days, and vice versa.

December:

winter outlook December

winter outlook December precip

January:

winter outlook January temps

winter outlook january precip

February:

winter outlook February temps

winter outlook February precip

Technical Discussion:

This will be my 6th winter outlook; I’ve had two decent outlooks (2009-2010, 2014-2015), two outlooks that had varied success in different regions of the country but could’ve been much better (2012-2013, 2013-2014), and one that I’d consider subpar/not very helpful (2010-2011). I guess it’s good that I consider my most recent outlook to be one of my better ones.

I do arrive at a set of analogs at the end, which I do partially base my monthly maps off of, however extensive reasoning is provided herein on how I came to my conclusions.

Let’s Start With Sea Surface Temperatures:

winter outlook current SST

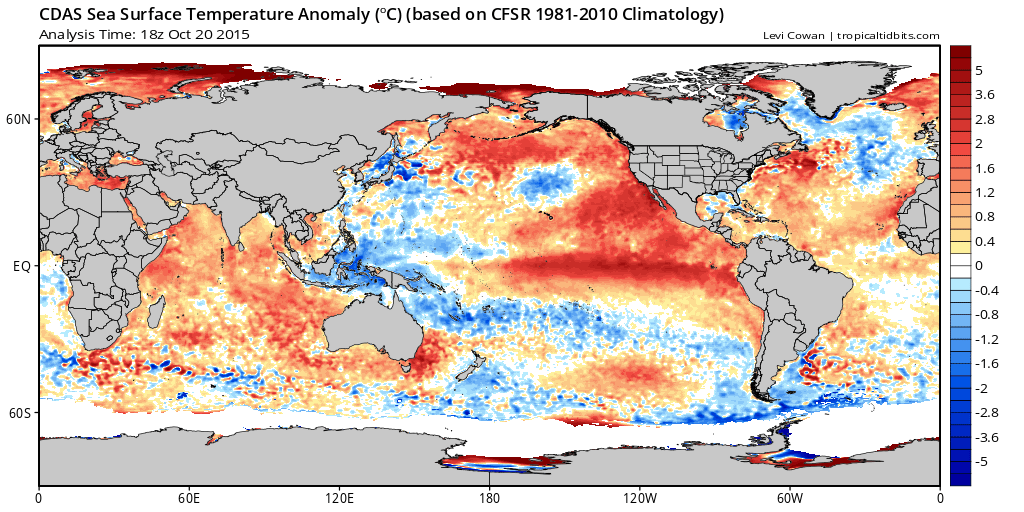
Current sea surface temperatures as we head into October show several distinct features; a basin-wide and strong (bordering on “super”) El Nino in the Tropical Pacific, impressive warm waters well north of the ENSO regions from near Hawaii all the way to California, an abnormally warm Indian Ocean, very warm waters compared to normal, surrounding the Aleutian Islands, warm waters (that have cooled some recently) south of Alaska and off of the west coast of Canada, and an overall very warm Atlantic, with the exception of a large cold pool across the N. Atlantic.

Closer Look at El Nino:

winter outlook nino regions

The western Nino regions (3, 3.4 and 4) have all featured warmer than average waters since summer of 2014, although the eastern region (1+2) did cool during the winter of 2014-15. All Nino regions except for 4 (which was quite warm already) warmed strongly starting in the spring of 2015, and after a brief “leveling off” in the warming late in the summer, have warmed again in September. Nino 4 has the smallest warm SST anomaly, however this is quite typical, an anomaly of around +1C for Nino 4 is impressive. Regions 1+2, 3 and 3.4 all have SST anomalies of +2C or greater, which pushes them into the “super El Nino” range. These very warm waters haven’t persisted long enough for this El Nino to be officially classified as a super El Nino yet, although that may just be a matter of time.

winter outlook 850 time-long

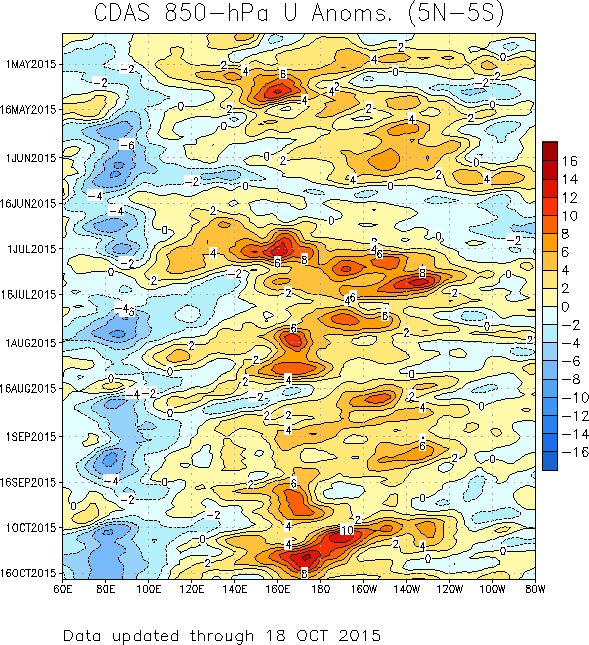
A look at the 850mb winds over the equatorial Pacific shows that there have been persistent weaker than normal trade winds (denoted by the warm colors) since last Spring, with a few well defined westerly wind bursts (WWB). These weaker trades are important, as they help the warmer pool of water normally located closer to Australia and the Pacific Maritimes to spread farther east and limit upwelling of cooler waters. Westerly wind bursts are especially proficient at encouraging further warming, and usually help downwell warmer waters. There is a robust WWB occurring at present across much of the eastern equatorial Pacific, which is likely accounting for the recent warming discussed above. This suggests that the El Nino is not done strengthening as we head through October.

winter outlook tdepth

One distinct characteristic of an El Nino is a deepening of the thermocline east of the International Dateline. The thermocline has deepened considerably farther east over the last two months, all the way to the S. America coast. This suggests that El Nino’s effects are not confined to just the central and western Nino regions, this is a basin wide event (NOT a modoki or anything close). This is important as it has an impact on where the strongest tropical forcing may be located this winter. It’s also notable that the recent WWB has had a noticeable effect on deepening the thermocline in the central Pacific over the last two weeks.

Winter outlook MEI

http://www.esrl.noaa.gov/psd/enso/mei/

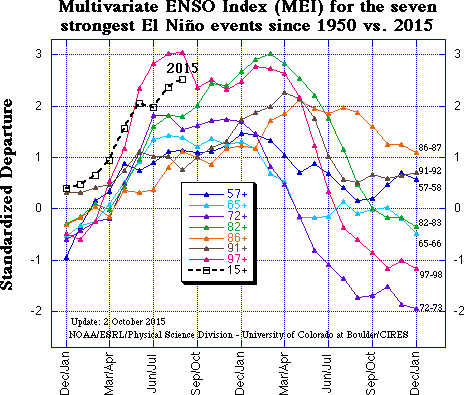
When comparing the 2015 El Nino to past strong El Nino events, using the Multivariate ENSO Index, which incorporates factors other than just sea surface temperatures when determining ENSO strength, it can be seen that for the August/September period, the only El Nino stronger than 2015 was the 1997-98 super El Nino. The only two El Ninos to peak higher than 2015 at any time of year are 1982-83 and 1997-98. Those two El Ninos are the only two “super” El Ninos since 1950 (MEI of +3 SD or greater), and both of those events had a secondary MEI peak in mid-winter.

Winter Outlook ONI

http://www.cpc.ncep.noaa.gov/products/analysis_monitoring/ensostuff/ensoyears.shtml

Another method of determining Nino strength, called the Ocean Nino Index, relies strictly on sea surface temperature anomalies in the ENSO regions. The most recent tri-monthly value for JAS was +1.5, making this a strong El Nino. Weekly values have been generally +2 for quite some time, so it’s likely that the next two tri-monthly values continue to increase. The threshold for a “super” El Nino using the ONI is an anomaly of +2.0C or greater; that has only been done three times, in the 1972-73, 1982-83 and 1997-98 El Nino events. The JAS ONI value was the third highest since 1950, behind 1997 and 1987. 1987 did not get any stronger after JAS, while 1997 intensified into the early winter.

Either way, given the recent WWB near the Dateline and the continued deepening of the thermocline in the equatorial Pacific, further intensification of this El Nino is likely in the near future. A peak very close to or possibly stronger than 1982-83 is possible, although a peak matching or exceeding 1997-98 is a bit more of a stretch.

Winter outlook typical Nino

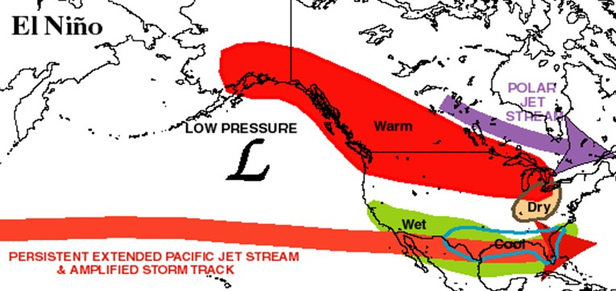
This very strong El Nino is a very good indicator of the general pattern that will likely be in place this winter across the CONUS; tropical forcing is usually focused in the central/eastern Pacific, east of the Dateline, which forces a persistent low pressure somewhere near or south of Alaska, which drives the polar jet northward across the west coast of the continent, causing warmer and somewhat drier conditions across much of the northern US in an El Nino winter. El Ninos also strengthen the sub-tropical jet, bringing increased moisture to the southern US and usually cooler weather to the Deep South.

Typically, stronger El Ninos match the above “perfect El Nino” pattern better than weaker ones, as the forcing with weaker El Ninos may not overwhelm other factors. However, not all El Ninos come in the exact same flavor (or else I’d be done with my outlook right now):

http://www.jamstec.go.jp/frcgc/research/d1/iod/enmodoki_home_s.html.en

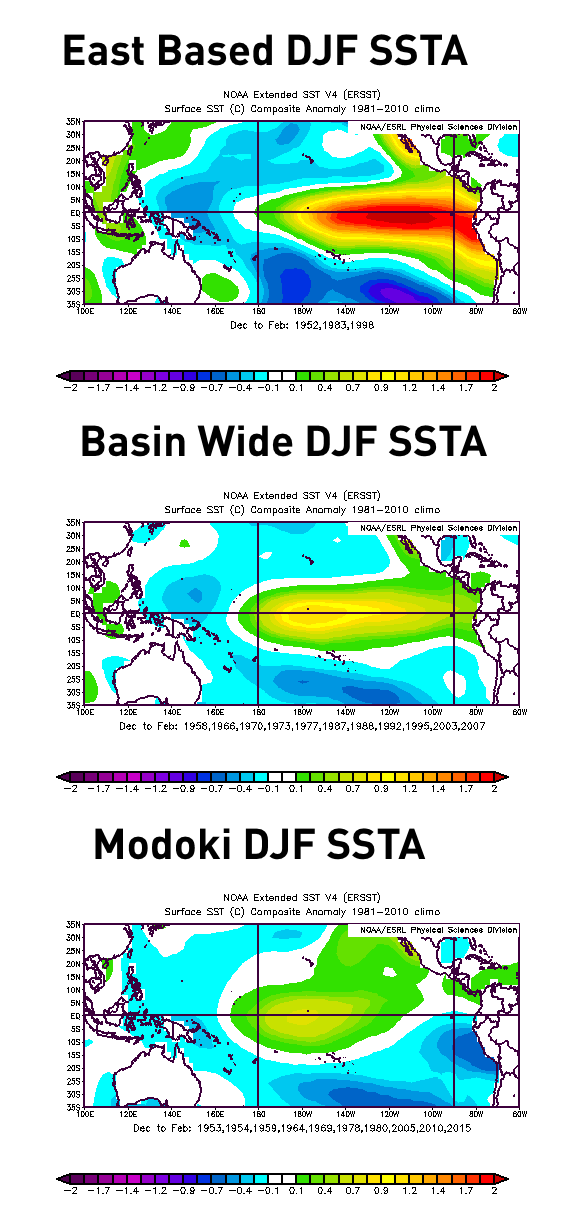
This webpage from JAMSTEC explains the difference between a “Modoki” El Nino, one that has the warmest anomalies in the central Pacific, closer to the Dateline, with cooler waters off of the S. American Coast, and a normal El Nino, that has warmer waters farther east. The location of the warmest waters can have a big impact on where persistent tropical convection that ultimately drives the jet stream’s response to an El Nino occurs.

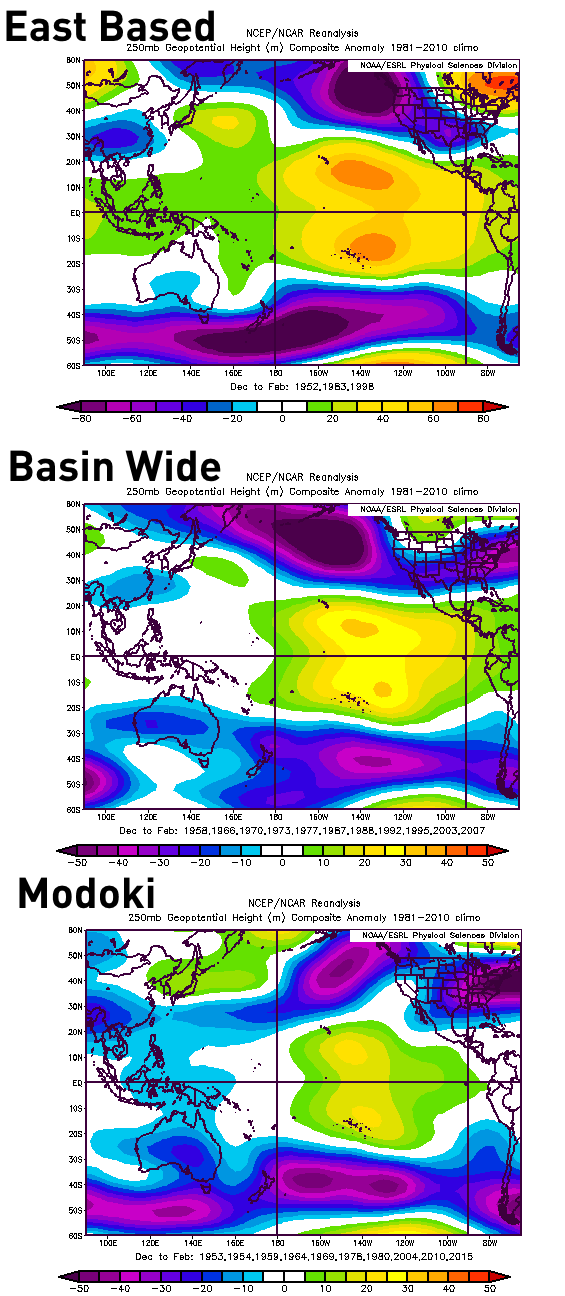
There are really three different types of El Nino: Modoki, basin wide, and east based:

winter outlook EN SSTA

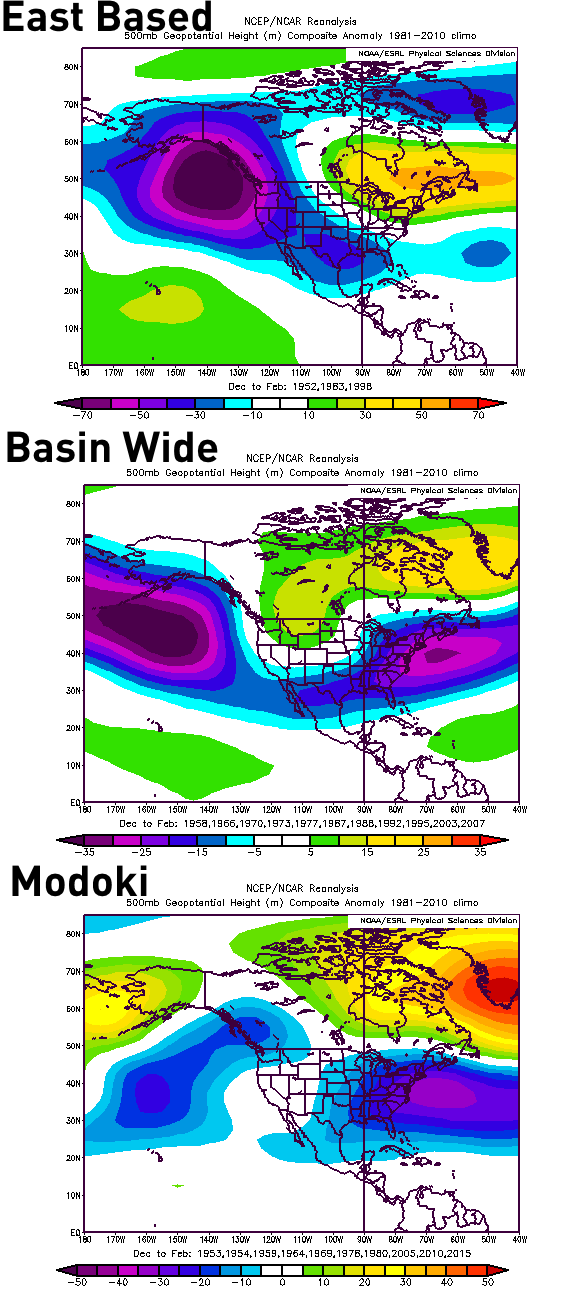
All three different types, on average, yield a different positioning of the Gulf of Alaska low, and a different CONUS wintertime weather pattern:

winter outlook EN patterns

Note how a central based/Modoki El Nino tends to have a weaker GOA low that is generally farther southwest, while the east based lows, in the means, are stronger and progressively farther northeast, flooding more of the CONUS with mild Pacific air, resulting in the negative anomaly moving farther southeast off the East Coast. These composites were made using all El Ninos since 1950 regardless of strength, however the Modoki and basin wide events have a reasonably large sample size and produced reasonably strong composite anomalies when blended together. Two of the three east-based El Ninos were strong-super, not a coincidence.

The difference in the GOA low position is due to differences in the intensity and location of the strongest tropical forcing in different El Nino winters. In an attempt to further diagnose this difference in forcing to use it as an aid in forecasting this winter, I looked at a few different methods to quantify the tropical forcing in the different El Ninos:

winter outlook EN 250 Pac

The first method was to look at 250mb height anomalies during DJF; the reasoning behind this is tropical convection gives off a tremendous amount of latent heat, which will thicken the atmosphere and raise the geopotential heights of the upper atmosphere. This is important because this tightens the pressure gradient immediately north of the higher heights and strengthens the jet stream, altering the downstream weather pattern. This first exercise was actually rather interesting, as it seemed as though the strongest anomalies in all three types of El Nino were located near 130W; it was the strength of the anomalies and eastward extent that differed. East based El Ninos had the strongest anomalies at 130W, with the anomalies extending farther east, likely suggesting that the convection along the equator in the Pacific in those El Ninos was more robust and also occurred farther east than the basin wide and especially modoki events. This may also be a by-product of the east based and basin wide El Ninos on average being stronger than Modoki events (with east based events being stronger than basin wide on average). With east based events, weak positive height anomalies extended well west towards the Indian Ocean; this was not the case with basin wide or Modoki events.

Winter outlook EN OLR

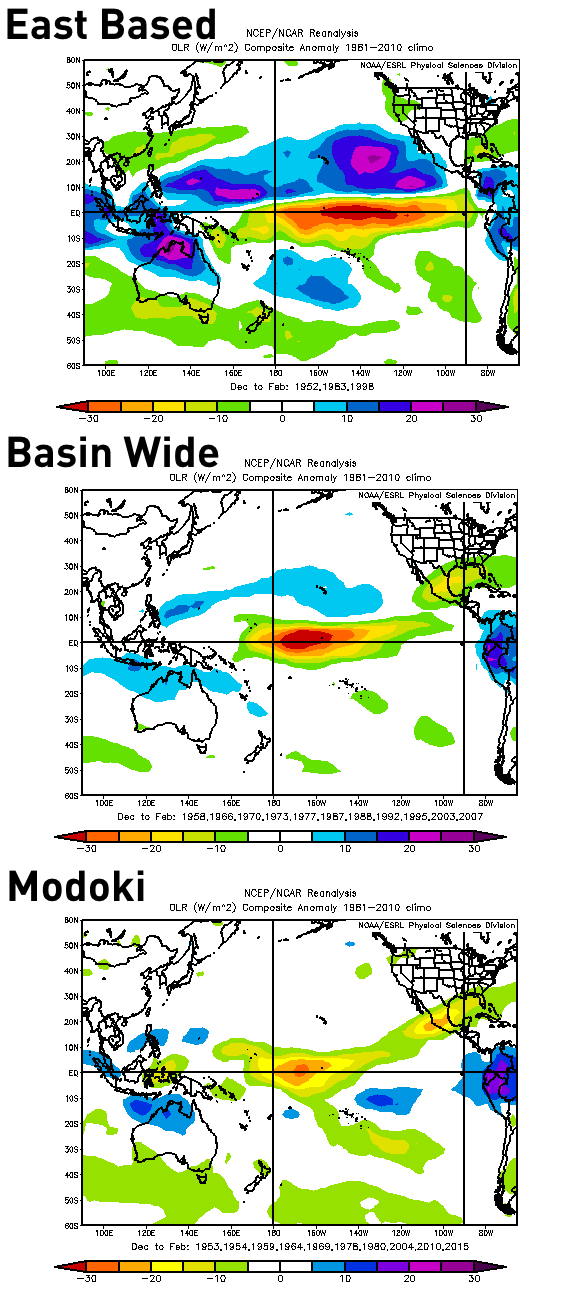
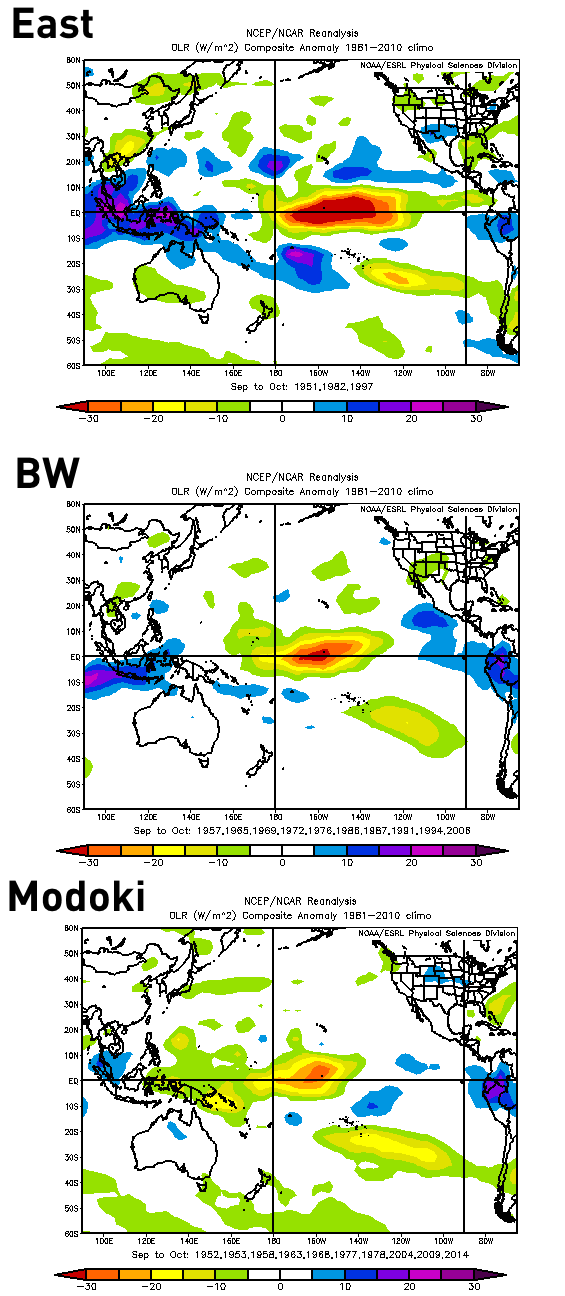
The second method was to examine outgoing longwave radiation (OLR) anomalies in the Pacific during the three types of El Nino during DJF. This helps show where tropical forcing is more prevalent because the colder cloud tops associated with thunderstorms radiates less outgoing longwave radiation; so a dearth of outgoing longwave radiation indicates more persistent thunderstorms. This method was similar to the 250mb height anomaly method in that the Modoki El Nino forcing was generally weaker than the basin wide and east based events, however the difference in this method is that the east based forcing shows up as being centered much farther east than the other two, unlike the height anomaly method where the max anomalies were near the same longitude (130W). It’s notable that the positive OLR anomalies (associated with less convection than normal) across the Maritimes into the Indian Ocean are much more distinct with east based events than basin wide or Modoki ones, indicated a lack of MJO activity overall with east based events.

winter outlook EN 850 winter

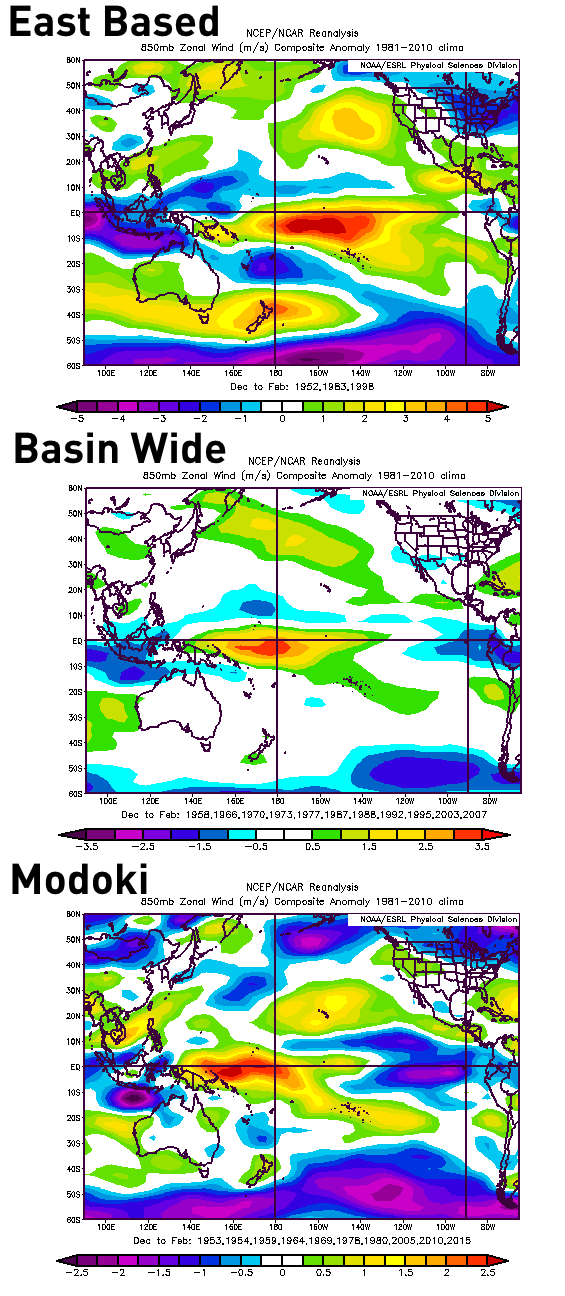
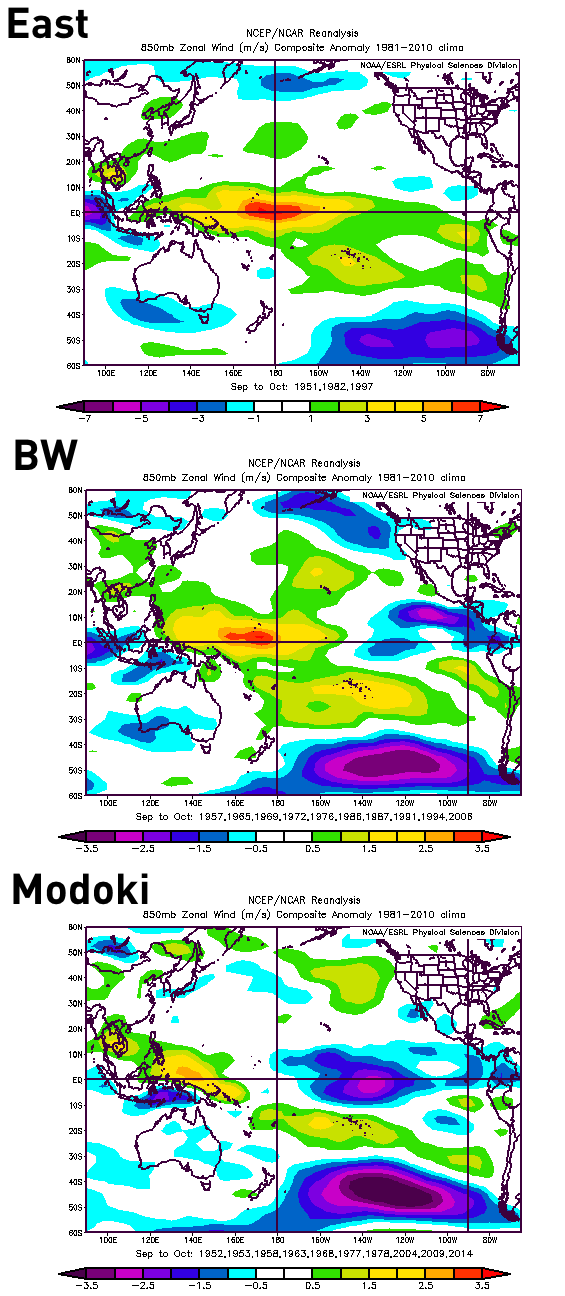
A third proxy I used was 850mb zonal wind anomalies. This does two things; it determines where warmer/colder waters are likely to persist in the equatorial Pacific (westerly anomalies/weaker trades suggest warmer waters, vice versa with easterly anomalies/stronger trades), and also suggests where more persistent tropical convection is likely to be, as low level convergence along the eastern edge of the westerly anomalies promotes more active convection. Much as the case with the 250mb height anomalies and OLR anomalies, east based events feature stronger anomalies farther east, while basin wide are markedly farther west and a bit weaker, while modoki events on average feature the farthest west and weakest anomalies.

So, with all of this said, let’s start comparing to this year:

Height anomalies for September and first half of October:

winter outlook 2015 SO 250

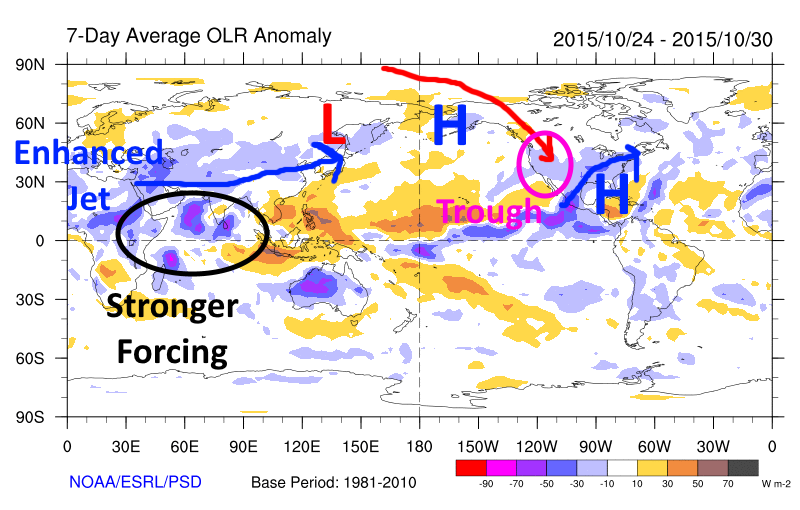
September 1-October 18 OLR anomalies:

winter outlook 2015 SO OLR

September 1-October 18 850mb zonal wind anomalies:

winter outlook 2015 SO 850

(note that I tweaked the scale some to show that while the anomalies near 150E are very strong, that strong anomalies extend well east of the Dateline)

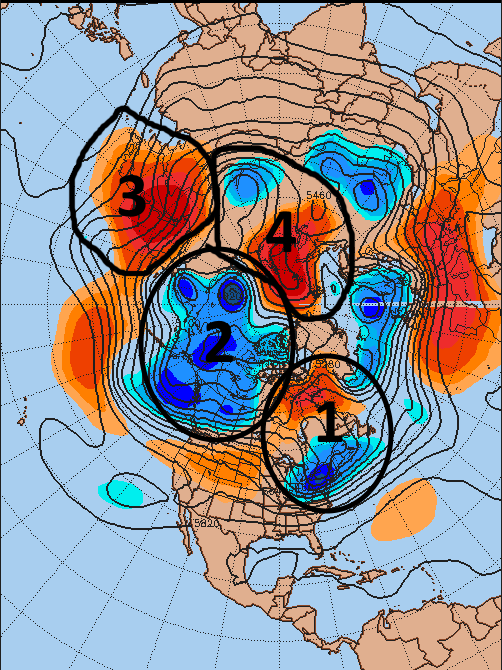
Another method of looking at the position of the 200mb and 850mb anomalies:

winter outlook 250mb time-long

winter outlook 850 time-long

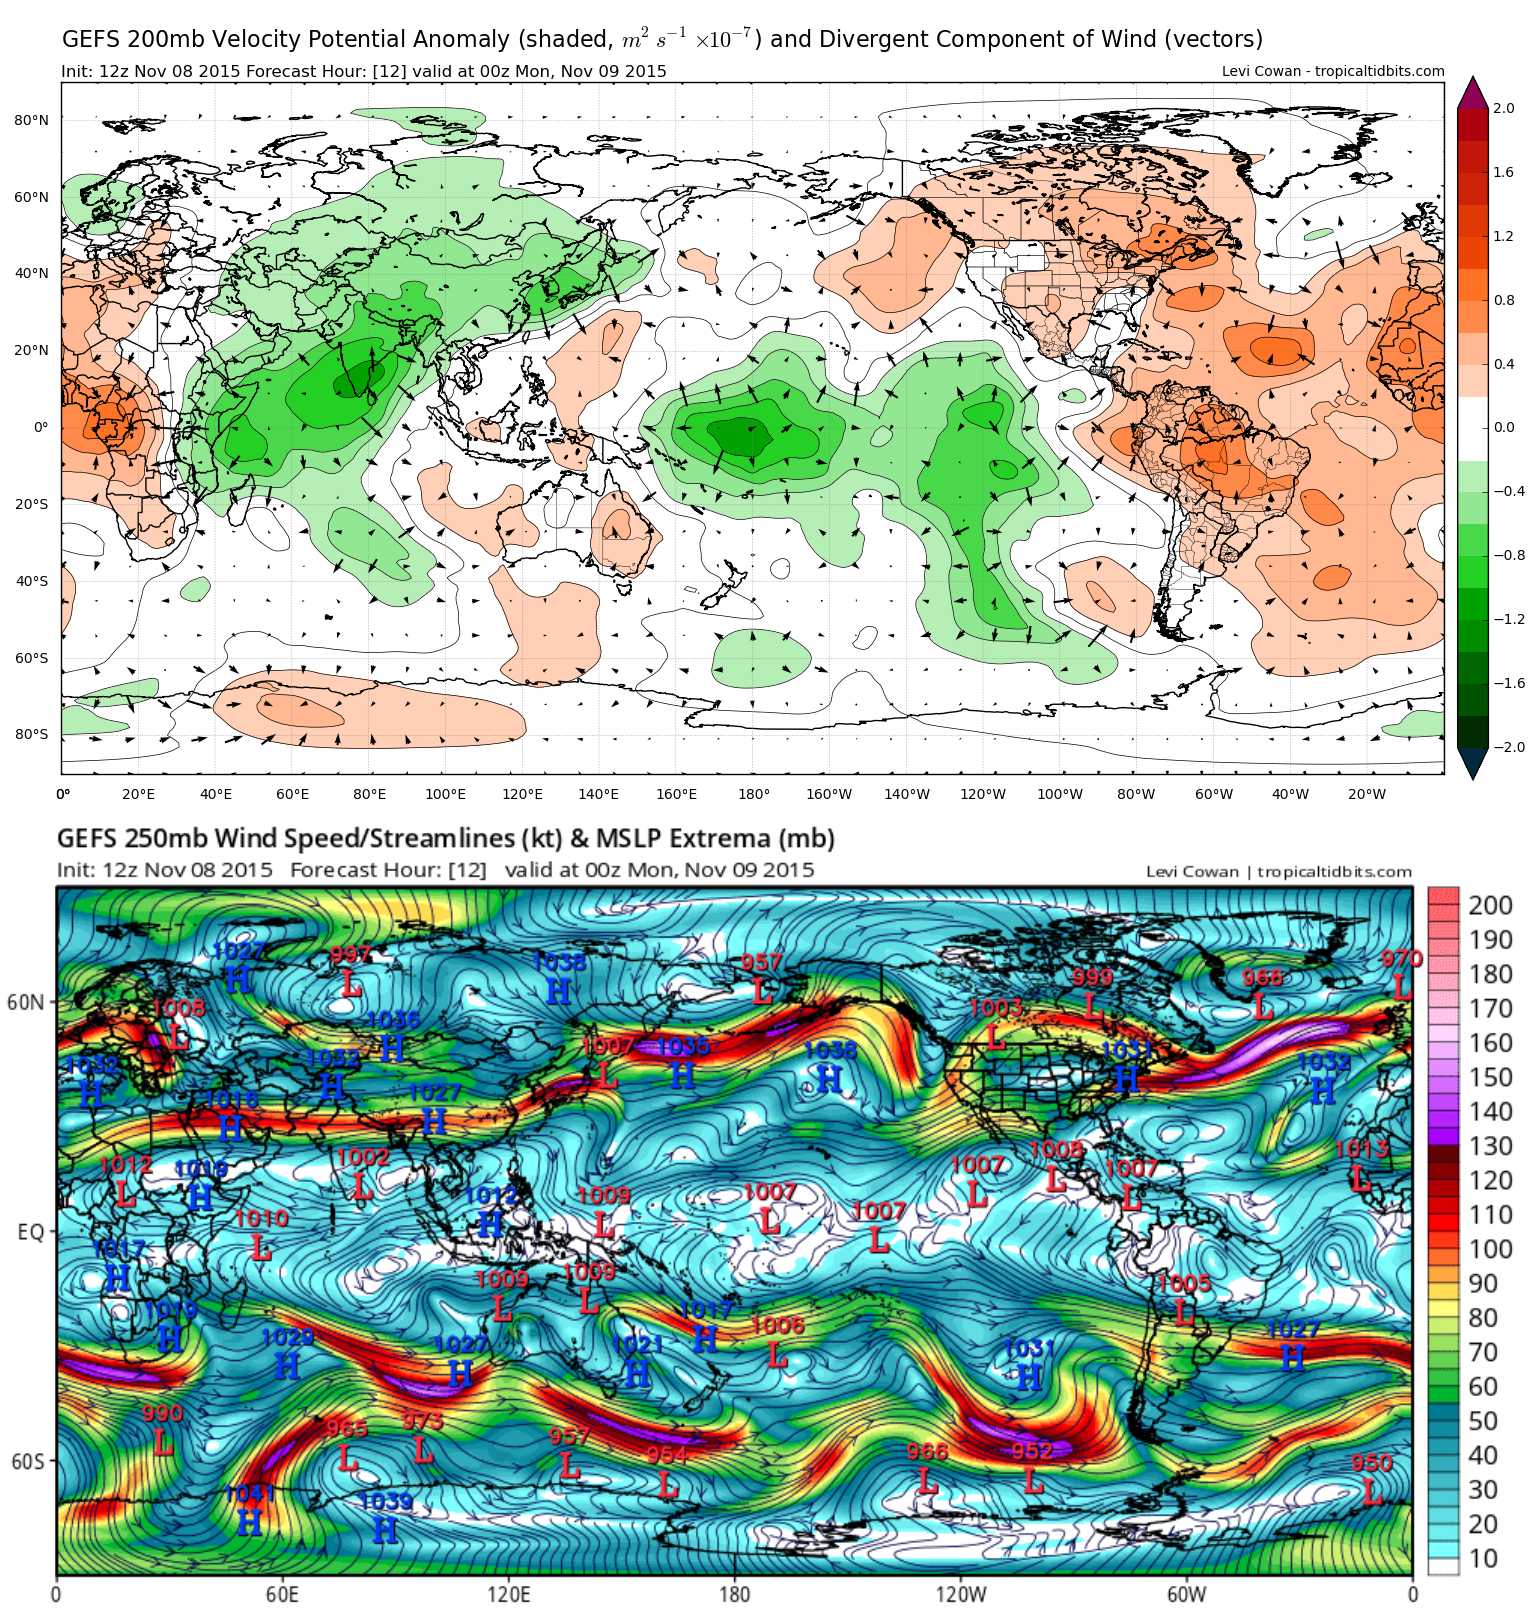
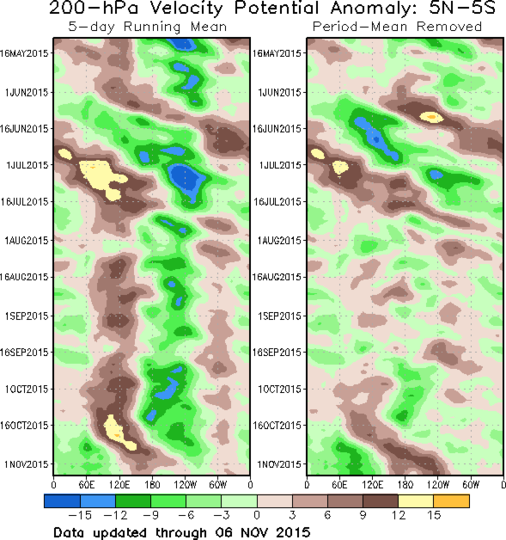
A few things of note: The strongest negative OLR anomalies are located near the Dateline, much farther west than the DJF means for any type of Nino, however stronger anomalies along the equator do extend rather far east in a fashion most similar to basin wide events. The 250mb height anomalies are pushing 60m, close to the DJF mean for east based events, and stronger than the basin wide events mean. Also, the positive anomalies extend well east towards S. America, most like east based events. There’s also a stout positive height anomaly from NE Asia towards western Alaska. The 850mb zonal wind anomalies are centered much farther west than the east-based DJF composite; in fact, the max anomalies are centered near the DJF modoki composite, however the implied convergence at the eastern edge of the westerly anomalies is located farther east, closer to the basin wide DJF composite. The strongest 200mb velocity potential has been located along and a bit east of the Dateline, and has gradually nudged west over the last couple of months.

Before we go any farther, it’s important to note that these height/OLR anomalies for 2015 are for September-October, NOT DJF. First, I’m going to recreate the 250mb height anomaly, OLR anomaly and 850mb zonal wind anomaly for the three types of El Nino events for S-O:

250mb height anomalies:

winter outlook EN SO 250

OLR anomalies:

winter outlook EN OLR SO

850mb zonal wind anomalies:

winter outlook EN 850 SO

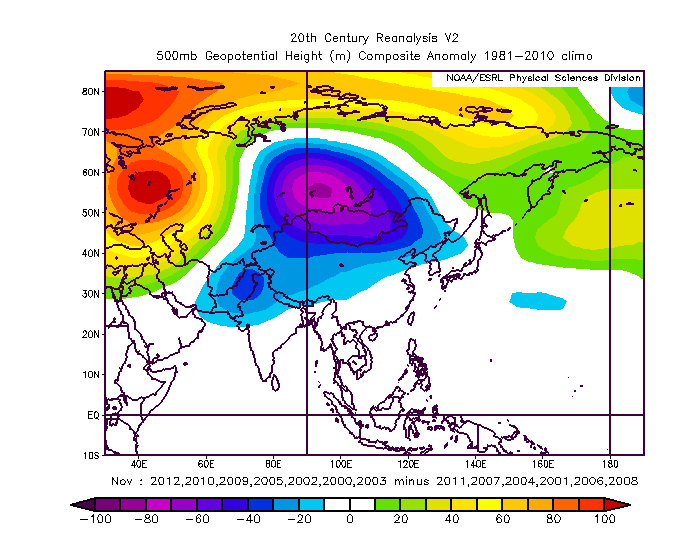
When comparing this September-October (so far) to the composites above, the 250mb height anomalies in the mid-latitudes are actually closest to the modoki composite; it’s very notable that really NO other El Nino since 1950 has had such high 250mb geopotential height anomalies over the tropics. The OLR and zonal wind anomalies are somewhat mixed in the comparisons; the strongest OLR anomalies in September-October are centered smack dab over the dateline, which is actually farther west than the strongest OLR in any of the September-October El Nino composite anomalies. However, the negative OLR anomalies extend farther east, so overall it has more of a basin wide event forcing look. The 850mb zonal wind anomalies are similar; the strongest westerly anomalies are well west of the dateline, centered somewhere between the modoki and basin wide strongest composite westerly anomalies, however per the time-longitude plot above, this is skewed a bit by a strong, but brief WWB in early October east of the Dateline. Overall, the strongest westerly 850mb anomalies have been west of the Dateline, most similar to basin wide events. In general, it seems like forcing is currently mirroring basin wide events the best this fall, however, as noted above it’s not a perfect match.

Now, I’m going to look at all moderate-super El Ninos (per ONI) since 1950 to determine which El Ninos had similar September-October patterns to this one, and determine what kind of El Nino they were and how their upcoming winters turned out. It was actually tough to find similar analogs to this year, with very few years that looked anywhere close to the N. American pattern we have seen thus far this fall during a moderate-super El Nino. Another complicating factor was this year’s odd convection placement along the equator; there’s a clear max in convection centered at the Dateline, however a lesser but still abnormal amount of convection has occurred rather far east.

After looking over all moderate-super El Nino Septembers and Octobers, I determined that 1957, 1986 and 1987 were the “closest” matches to our current tropical forcing. With this said, the overall pattern in the mid-latitudes doesn’t really match what we’ve seen this fall thus far. Because 1986 was the first year of a two year El Nino and was strengthening through DJF (very unlikely in this second year El Nino), I tossed it out. The overall OLR composite for September and October for 1957 and 1987 is “OK”:

winter outlook 57 87 analog SO

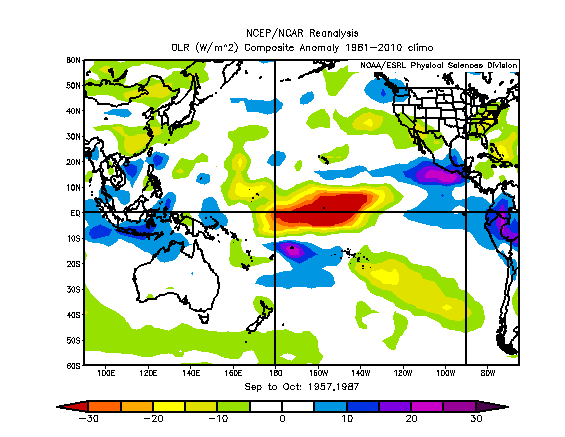
The following DJF mean OLR anomaly looks close to what you’d expect for a basin wide El Nino event, with the GOA low positioning also close to what you’d expect for a basin wide event:

winter outlook 58 88 DJF

After the review above, my best guess at this time is that the Gulf of Alaska low placement will be somewhat close to what is “typical” for basin-wide El Ninos. This makes sense; this is clearly NOT anything near a Modoki based on the exhaustive review done thus far, but warm SST anomalies along with the location of the most persistent tropical forcing are most certainly farther west than east based events, despite very warm SST anomalies in the eastern Nino regions.

It is worth noting that per the MEI, this is the strongest basin-wide El Nino since at least 1950, and if the ONI continues rising as it should per the recent weekly ENSO region weekly anomalies, there’s a good chance this will beat 1972-73 for the strongest basin wide El Nino per the ONI as well. So, we’re already in potentially uncharted territory when looking at just the El Nino strength and type.

Other factors heading into this winter are also rather unusual, and will be investigated now. The very warm waters off of the western N. American coast, in the sub-tropics and in the northern Pacific are very impressive. These waters aren’t paramount to tropical forcing that is a significant driver of the wintertime jet stream strength/position, but seem somewhat important.

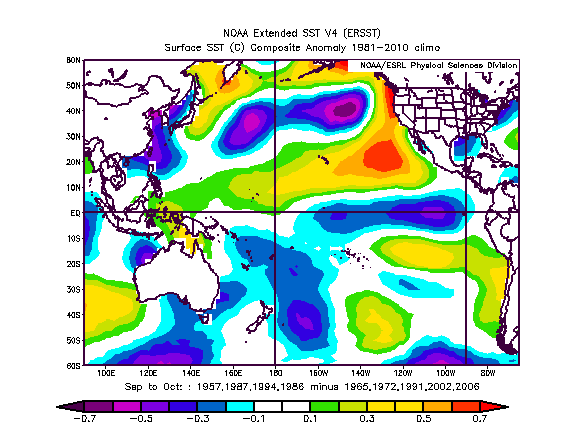
The first area examined specifically will be the area of very warm waters extending from south of Hawaii east-northeast towards California. This year’s waters are off the charts warm in this area, with widespread anomalies of +2-4C right now. There are a few possible things I can think of this effecting: It could possibly weaken trade winds farther east (weaker temperature and pressure gradient between the EQ and the sub-tropics in this area), possibly forcing convection farther east. It may also allow additional moisture into the Southwest US. To examine this area, I looked at all moderate or stronger basin wide El Ninos since 1950 (per ONI), and looked for years that also had warmer waters in this region. No year has waters as anomalously warm as this year, however a few did have generally warmer waters in this same area. Her is the September-October SST difference map in the four Ninos I have with warmer waters from Hawaii up to near California compared to the rest of the basin wide, moderate plus El Nino events since 1950:

winter outlook warm SE Pac SST dif

When looking at the difference of several potentially key DJF variables between years that featured warm waters from near Hawaii to California, a few interesting features were evident:

winter outlook warm SE Pac SST diffs

It is worth noting that these years ignore all other variables. This is just the difference in moderate or strong El Nino winters between ones that had the warmer HI-CA waters compared to years that didn’t. It’s possible that other variables are affecting some of these differences.

One interesting difference is an apparent tendency to pull tropical forcing a bit farther west in years where the warm water is present; the Pacific jet is stronger overall, but strongest over the central Pacific, with stronger trade winds and less OLR (indicative of more clouds/convection) along and west of the Dateline, potentially indicative of more MJO activity, which is normally limited during stronger El Nino winters. This results in the heights over the Aleutians being lower (GOA low farther west) and heights along the west coast being a bit higher (overall a slightly more favorable +PNA look). There is also a distinct tendency for a strongly west based –NAO. The look also looks potentially wetter for CA (stronger westerly 850mb winds, a stronger jet, lower OLR).

The overall tendency appears to be for winters that have a more favorable N. Pac orientation and NAO for troughing over the eastern US…however, the sample size is small, and it’s quite possible other factors influenced/caused these differences. It IS worth noting that my two tropical forcing “analogs” (1957-58, 1987-88) and 1986-87 (not one of my forcing analogs, tossed due to being a first year Nino that strengthened during winter) are in the list of moderate or stronger basin wide El Nino winters that had warm water from HI to CA.

The next area/factor examined specifically will be the very warm N. Pacific waters and strongly positive Pacific Decadal Oscillation (PDO). The PDO is a pattern of north Pacific SSTs that tend to persist for around 30 years. A warm phase of the PDO features colder waters of the north-central and northwest north Pacific, with warm waters off of the west coast of N. America, while a cold phase of the PDO features warmer waters of the northwest and north-central north Pacific, with colder waters off of the west coast of N. America.

http://research.jisao.washington.edu/pdo/

We had been in a 10-15 year old cold PDO phase, but have seen a strong rise over the last couple of years, which isn’t uncommon during El Nino events that occur during an otherwise cold PDO. Sea surface temperatures in the PDO region are not nearly warm enough to force convection that completely re-shapes the jet stream, however, PDO trends may be more indicative of persistent weather patterns, and although the sea surface temperatures here aren’t nearly as significant as over the tropics, they may cause small differences in the track/intensity of mid-latitude cyclones in this region that does have some impact on the overall pattern.

September’s PDO value came in a +1.94, per the University of Washington, which is the highest it has been since March. There are only two moderate or stronger, basin wide El Nino events since 1950 that had a September PDO of greater than +1.50 per the University of Washington dataset (or greater than +1 for that matter); 1957 and 1987. These are ironically the two best tropical forcing “analogs,” and are also two of the four moderate or stronger basin wide El Nino events since 1950 that featured warm water from HI to CA. When looking at difference maps as done above between the moderate or stronger basin wide El Nino events with strong warm September PDOs and the rest of the moderate or stronger basin wide El Nino events, some similar trends are noted:

winter outlook strong PDO DJF

One initial warning here is that we are starting to deal with small sample sizes (two years), and that factors other than PDO may influence some of these differences. However, some trends that are again apparent is for stronger trade winds east of the Dateline, perhaps suggesting tropical forcing will be located somewhat farther west than most basin wide El Nino events. The 250mb zonal wind difference also suggests a stronger jet over the Pacific, although in this instance the jet is even stronger in the west coast of North America. There is also a tendency for a more strongly west based –NAO in 1957-58 and 1987-88 compared to the rest of the basin wide moderate or strong El Nino winters…again however, this is a two year sample, and should be used with caution.

The next factor examined is the very warm Indian Ocean; much of the basin is experiencing SST anomalies of near or above +1C; since 1950, only 3 moderate or stronger basin wide El Nino events have featured a warm overall Indian Ocean (and most not as warm as this year), when looking at September-October Indian Ocean SSTs. The years are: 1987-88, 2002-03 and 2006-07. Here are the difference maps compared to basin wide moderate or stronger El Nino winters that had normal or cooler than normal Indian Oceans:

winter outlook warm IO DJF

A few interesting trends; again, much like warm HI to CA SSTs and strong +PDO years, the jet is stronger across the northern Pacific; however, in this instance, the OLR is lower west of the Dateline, indicating more convection than the rest of the basin wide Nino years in this areas, perhaps due to a more active MJO than what normally occurs in El Nino years (which is potentially a direct result of the warm Indian Ocean supporting lower pressures and more convection than what would occur farther west in a typical El Nino). There’s also a strong high latitude blocking signal across N. America, although it’s possible other factors such as the stratosphere or solar influences are at work here. There is an overall trend for the GOA low to be centered a good bit farther west in these winters than in typical basin wide El Nino winters.

As a note, 1987 is the only September-October moderate or stronger basin wide El Nino since 1950 that featured a similar N. Atlantic SST configuration to 2015. That seems to be a top analog based on global SST patterns.

Winter outlook all EN 500 months

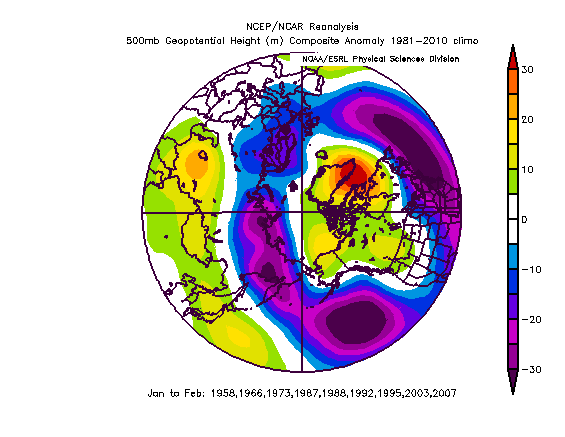
Moving on and looking more specifically at high latitude blocking now, there is a clear trend in all moderate-super El Nino winters since 1950 (regardless of east based, basin wide or modoki) for a progressively more negative NAO and to an extent AO as the winter progresses (along with a trend for the GOA to retrograde through the winter). This signifies that there is a strong chance that tropical forcing associated with stronger El Nino events tends to favor a –NAO. The question is, why, and will a –NAO be favored later this winter as well?

winter outlook bw minus others 500

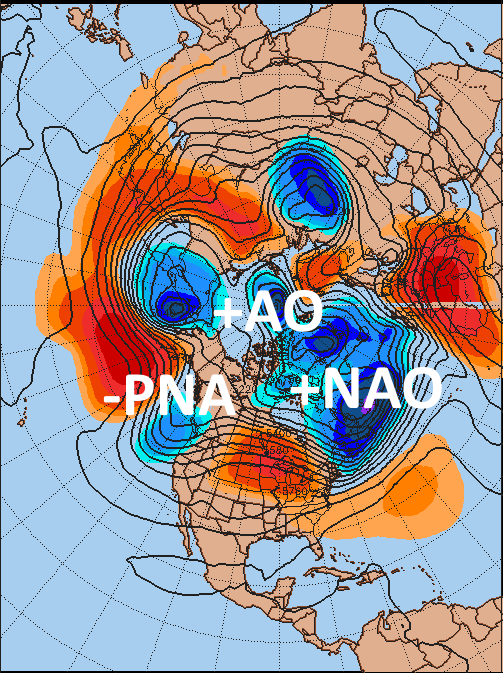
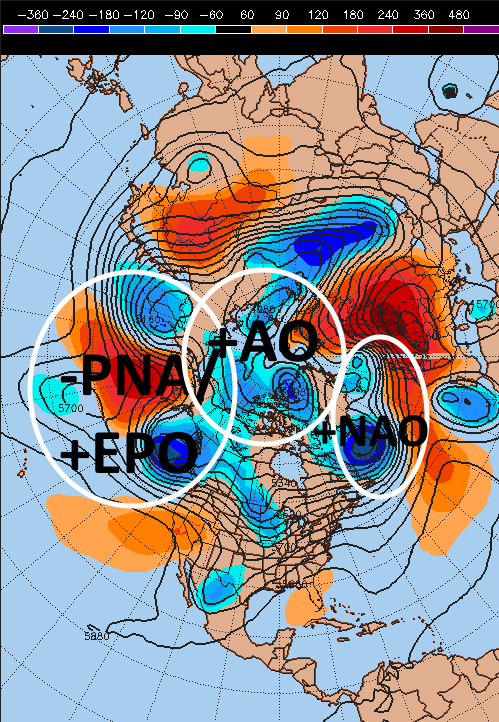
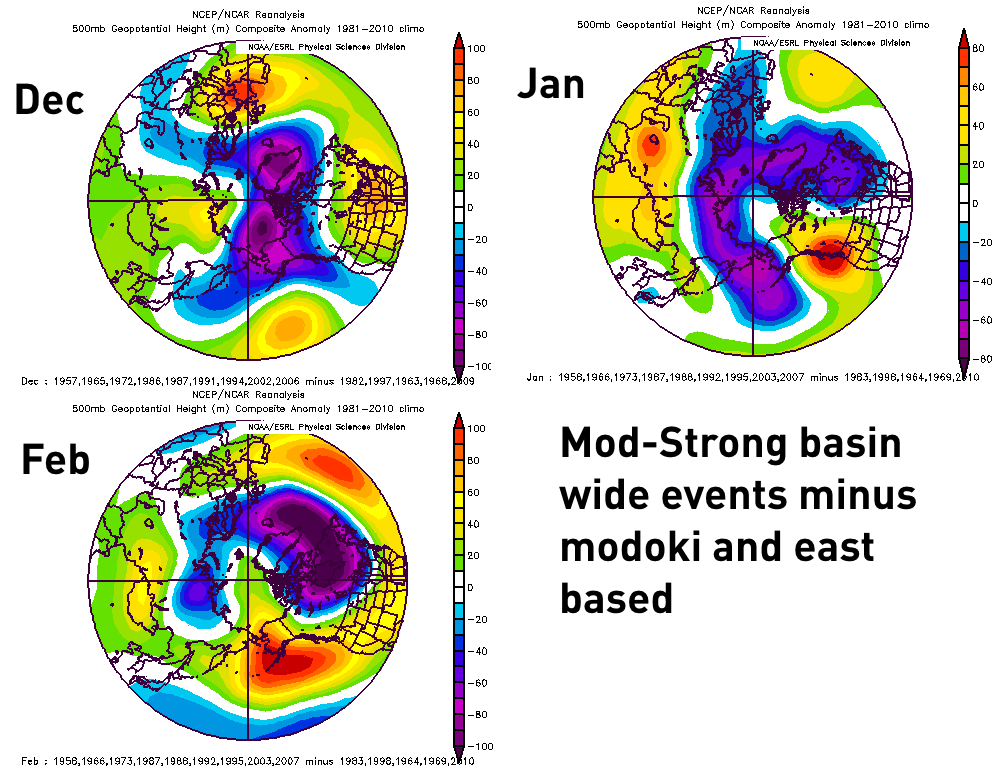
When taking the basin wide events (which we will be dealing with this winter) and subtracting all other moderate to strong events from it, the –NAO signal becomes weaker! Granted, a great –NAO winter like 2009-10 is removed in this process. Also, there’s a tendency for higher heights in the PNA/EPO domains, potentially due to removal of east based super El Nino events in 1982-83 and 1997-98. There is still a –NAO signal in the means for basin wide events for January and February, although the above implication is that removing the modoki events likely weakens the overall –NAO signal for moderate to strong El Nino winters:

winter outlook basin wide EN JF 500 NAO

QBO/Stratosphere Stuff:

winter outlook current QBO

The Quasi Biennial Oscillation refers to phases of more westerly or easterly winds in the stratosphere over the Tropics. Easterly phases are typically associated with a weaker winter time stratospheric polar vortex (and a better likelihood of sudden stratospheric warming events, leading to potentially periods of deep –AO blocking), while westerly phases tend to be associated with a stronger winter time stratospheric polar vortex (and a lower likelihood of the vortex getting disrupted in winter, potentially leading to periods of +AO conditions). There are exceptions to the rule, but the correlation is fairly well understood.

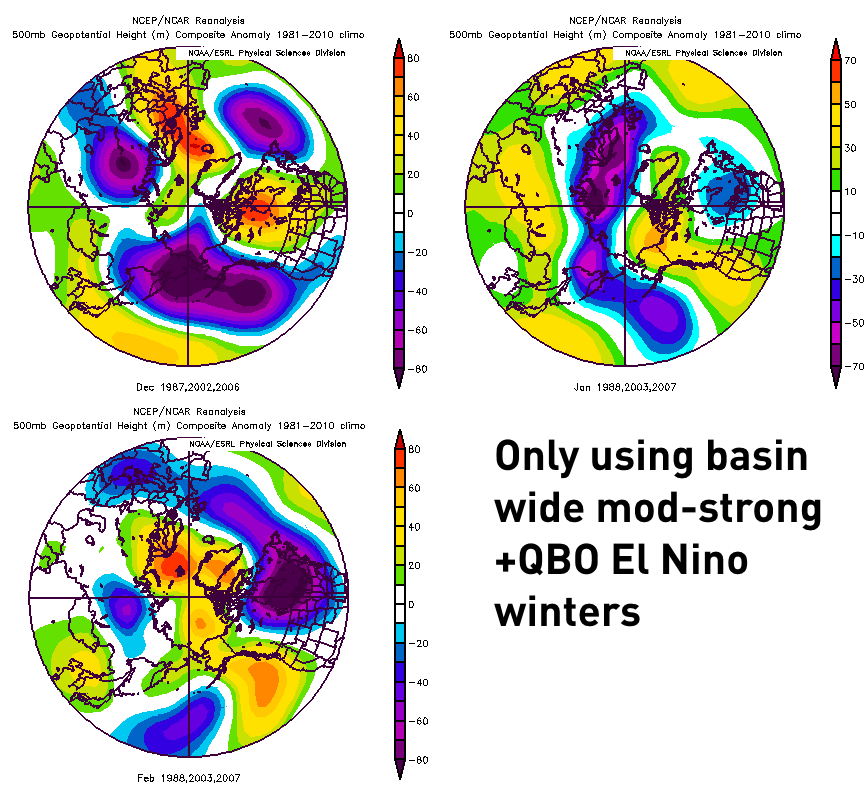
As seen on the above graph, there are westerly winds descending through the stratosphere right now, suggesting that the winter QBO will be positive or westerly. There have been 5 moderate to strong El Nino winters since 1950 that featured a +QBO (per 30mb wind anomalies), per these data sources:

http://www.cpc.ncep.noaa.gov/data/indices/qbo.u30.index

https://climatedataguide.ucar.edu/climate-data/qbo-quasi-biennial-oscillation winter outlook wQBO EN

There was a pretty strong signal for retrogression of the GOA low through the winter and a developing –NAO by February. The February pattern looks quite favorable, even with the super east based El Nino of 1982-83 in that composite.

winter outlook wQBO BW

When removing the modoki and east based El Nino winters from the composites, the overall message doesn’t change a ton; a fairly warm December with a GOA low flooding the CONUS with Pacific air, with no AO or NAO help, followed by a retrogression of the GOA low for January and February allowing for West Coast ridging, with a declining AO and NAO for February. The AO decline is much more noticeable in this composite than the one including all moderate-strong +QBO winters.

Another factor that influences the potential for high latitude blocking during winter is solar activity; I’m not extremely well versed on how this process works so I won’t try to explain it, but in general, the best combination for a deep, -AO winter is a solar minimum and –QBO. Monthly solar radio flux data from the sun can be found here back into the 1940’s:

http://www.spaceweather.gc.ca/solarflux/sx-6-mavg-en.php

We are currently coming off of a weak solar maximum; slightly weaker than the maximum in the early 1970’s; radio flux output will likely be in the neighborhood of 85-105 if the current rate of decline continues into this winter. Out of the +QBO basin wide ENSO years above, 1988 is an OK but not great solar match, as the radio flux was very similar to what’s expected this winter, however 1987-88 was near the beginning of a significant ramp up towards the next solar maximum near 1990. 2002-03 is also not the best match, as the radio flux values are higher, however, 2002-03 was a winter that also occurred in the declining phase of the solar cycle. 2006-07 occurred before the most recent solar minimum, with numbers slightly lower than what will likely occur this winter. If we see a ramp up in solar activity, 2002-03 could become a better analog; if we see a decrease, 2006-07 could become a better analog from a +QBO/ENSO/solar perspective.

Overall, the current solar activity doesn’t appear extremely helpful or unhelpful in attempting to get high latitude blocking this winter.

Peaking at “newer” research done by others:

winter outlook SAI steps

https://www.aer.com/science-research/climate-weather/arctic-oscillation

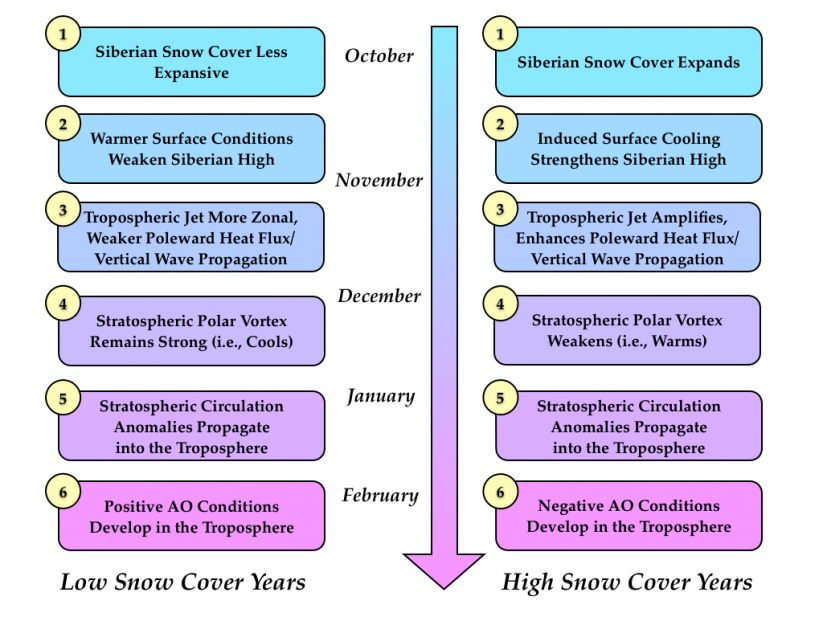
Dr. Judah Cohen has done extensive research that suggests that the late winter AO state is strongly correlated to October snowcover advance in Eurasia south of 60N (especially in Siberia); the reasoning is found in the graph above. The “Snow Advance Index” did very well in predicting AO state until the last two winters (with the 2014-15 winter being a fairly large failure); there is valid meteorology behind the idea, so although the index failed to properly predict last winter’s AO state, it is still worth looking at for this winter.

winter outlook Eurasia snow

The above plots, found Dr. Cohen’s blog linked above, it can be seen that so far, through the first half or so of October, Eurasian snowcover is advancing quicker than normal, but a bit behind the last two years.

winter outlook GFS snow

The GFS has been persistently showing a significant amount of snow south of 60N across Eurasia over the next 10 days. Considering the model has been showing this fairly consistently, and considering the current Eurasian pattern features a few upper lows/troughs well south of 60N, likely supporting snow, and considering the thus far decent (but not as good as last year) snow advance this month, it seems more likely than not that the SAI will finish higher than normal, suggesting a more –AO winter is potentially more likely. It remains to be seen whether it’s well above normal or just a bit above, but currently this factor doesn’t look to hurt things.

winter outlook SLP NAO

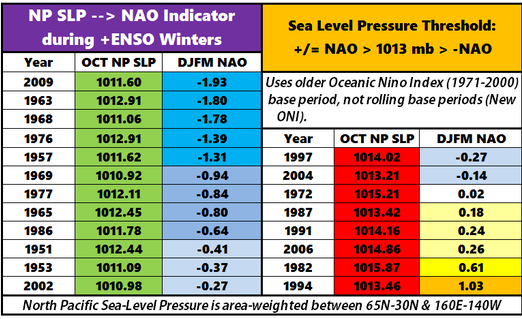
Research done by Al Marinaro (wxmidwest) suggests that the winter NAO state in El Nino winters is correlated to N. Pacific sea level pressure in October. This correlation makes sense when thought through, as El Nino winters in general appear to favor a –NAO, with some exceptions, generally based on where/how strong the tropical forcing is. This may be an early way of diagnosing the tropical forcing, and seeing if it’s in a favorable location for a winter –NAO.

winter forecast n pac SLP oct

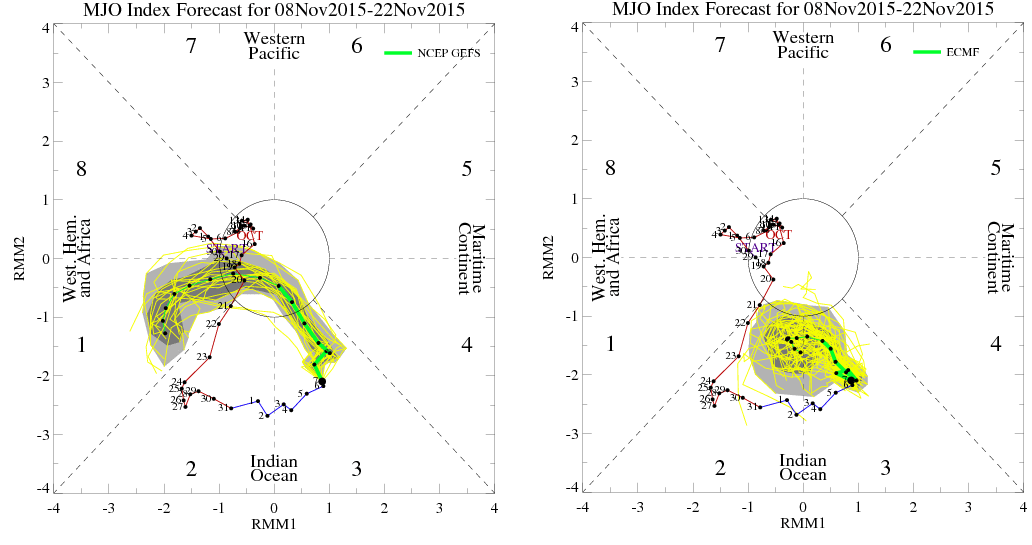
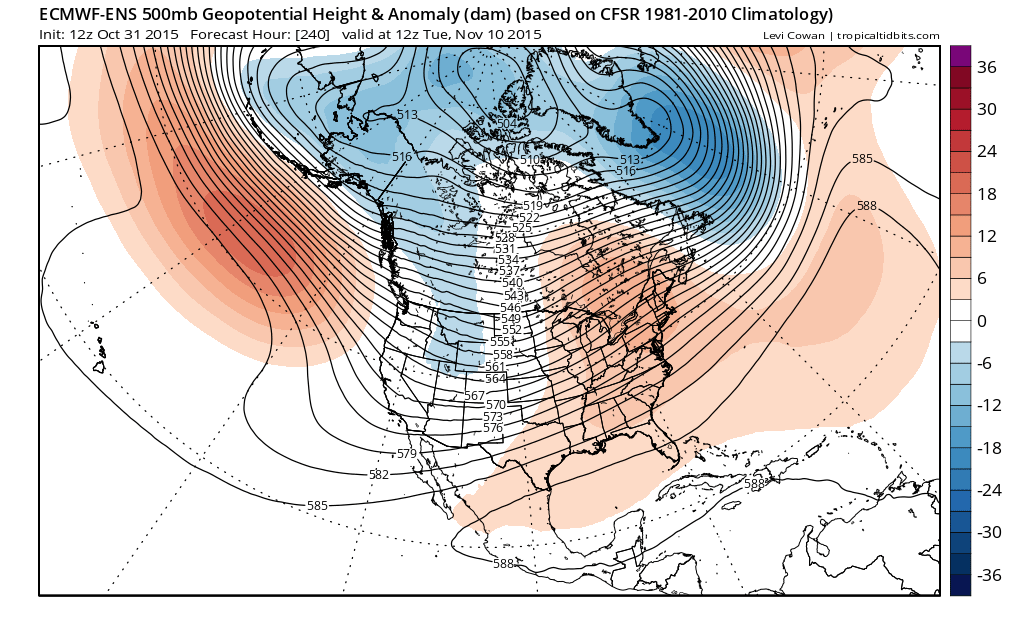
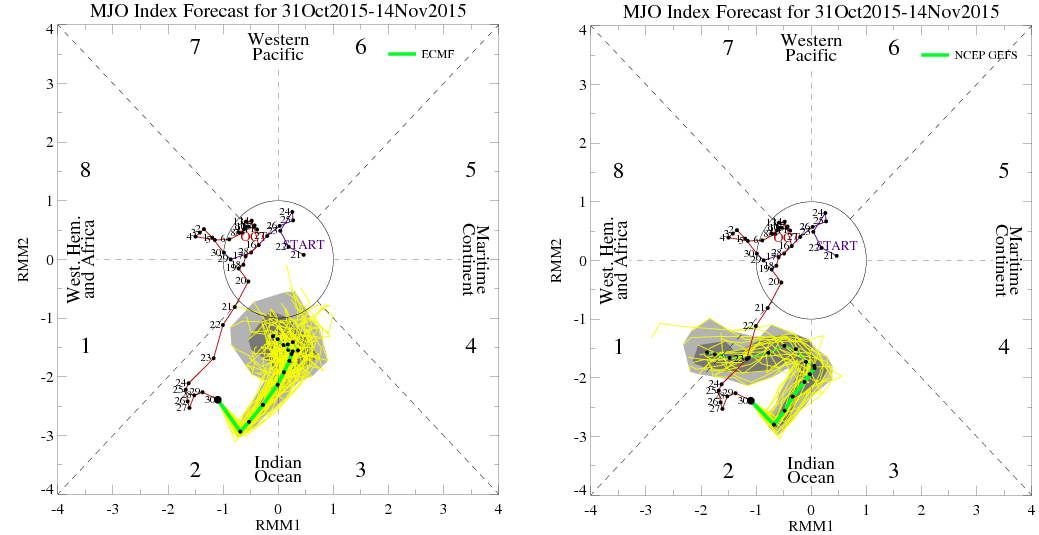
SO FAR, through October 18th, the N. Pacific SLP appears to be averaging lower than 1013mb, which would favor a –NAO. The catch is it’s a bit early. The “good” news is, the European ensembles insist on a very active weather pattern in the N. Pac, with a persistent Aleutian low through the remainder of October with a recurving typhoon perhaps deepening the feature quite a bit:

Winter outlook EPS

It appears possible that the N. Pac SLP in Al Marinaro’s box will be quite a bit below 1013mb on the mean for the month of October, which tends to correlate to a –NAO in an El Nino winter.

In Conclusion:

We are essentially in uncharted territory since at least 1950 in terms of a basin wide El Nino event of this strength, when combined with a warm Indian Ocean, very warm waters compared to Hawaii to California and a very warm N. Pacific. However, there is evidence that the warm Indian Ocean may act to cause somewhat more MJO activity that what is common during stronger El Nino winters, and in general, the warmer waters elsewhere in the East Pacific tended to pull the Aleutian low farther west when compared with other moderate to strong basin wide El Nino events. This suggests that a +PNA may become more likely as the winter goes on, after Pacific air likely floods a good portion of the CONUS in December.

In general, basin wide El Nino winters favor a negative NAO as you head farther into winter, although not as strongly as modoki events. The three moderate to strong basin wide El Nino events since 1950 that had a +QBO as we’ll have this winter featured decent AO/NAO blocking by February, after a warm December and up and down January. Research done on October snow advance in Eurasia by Dr. Judah Cohen and on October N. Pacific sea level pressure by Al Marinaro both suggest that trends this month also support a –AO/NAO this winter.

In general, a rising +PNA could limit California/west coast rainfall by later in winter. Hopefully they’re very active before then, as they desperately need the rain. The eastern US looks cold/active for the second half of winter, after a potentially very slow start.

The potential bust factor here revolves around how the Nino behaves. Other basin wide El Nino events with such a warm Indian Ocean (1987-88, 2002-03) saw more MJO activity than normal for stronger EL Nino winters, which likely contributed to a favorable pattern for eastern US snow. If this event becomes more strongly east based, this may not be able to occur. Another overall question mark is if all of the correlations discussed, small sample size for some of them notwithstanding, hold up with such a strong El Nino. We may learn quite a bit this winter…hopefully not at the expense of this forecast.

Analogs, based on good SST matches globally and QBO:

1957-58, 1987-88 (2), 2002-03, 2006-07

Posted in Uncategorized | 1 Comment