Manuel Threatens Western Mexico as Possible Hurricane; Low Pressure Emerges in Bay of Campeche

Manuel radar

Woah! What’s that? It looks a lot like a hurricane not too far from Los Cabos and La Paz over the southern Gulf of California. Well, as of 2PM PDT it was a strong tropical storm, however it is close to becoming a hurricane. I didn’t talk much of Manuel yesterday because it looked like this would remain below hurricane status and drift west towards La Paz over the next few days. However events today have significantly changed that thinking.

Instead of drifting west and only slowly intensifying resurrected Manuel has been slowly drifting north and has a very impressive radar presentation, complete with a well formed eye and eyewall. This system is expected to become a hurricane later this evening. So, what has caused this sudden forecast change? First and foremost, the system became much stronger than normal. When looking at the upper level winds near Manuel, conditions are very favorable for development with winds in the upper levels of the atmosphere fanning away from Manuel. This is called an upper level anticyclone (or high pressure) and helps promote rising air beneath it and helps maintain low wind shear over the tropical storm:

Manuel upper

This favorable upper level wind pattern existed yesterday however this rapid intensification didn’t begin occurring until this morning. In addition, most of our forecast models and the National Hurricane Center did not expect this rapid intensification to occur today. Why not? The NHC cited downsloping winds off of the mountains in mainland Mexico as a possible hindrance to intensification. Downsloping winds aren’t good for a tropical cyclone because they feed much drier air into the circulation and disrupt thunderstorm development. However, we still had very intense convection occur in and around Manuel’s circulation today, and as of this writing they aren’t showing any signs of dissipating. My theory is that because Manuel is a relatively small cyclone with its circulation really only grazing land that downsloping isn’t having much of a negative affect:

gre manuel

Note how the lower dew points over inland Mexico…in the 50’s and 60’s…have NOT filtered down to the coastline with dew points in the 70’s around Manuel. This is one possible explanation for why Manuel has over performed today. Manuel being stronger than expected appears to be tugging the tropical storm north, which is different than the more westerly track expect just this morning. Here’s why:

Manuel low steer

When looking at the flow between about 5,000-10,000 feet up in the atmosphere over the eastern Pacific…and this is the flow that steers weaker tropical storms, like Manuel was yesterday…one can see that Manuel is stuck in weak steering currents between two areas of high pressure (note the two areas of clockwise winds to the east and west of Manuel). It was expected that Manuel would remain in this area of weaker wind flows and sit over the southern Gulf of California for a couple of days before the high pressure to the west extended east and began steering Manuel towards the west in the general direction of La Paz. However Manuel has been moving due north or perhaps a tad bit east of due north today, which was not forecasted. Let’s look at other layers of the atmosphere:

Manuel mid steer

When looking at the flow between about 5,000 feet above the ground to about 23,000 feet above the ground over the eastern Pacific we can see some subtle differences…most notably being a better defined trough over the Rockies. While not a huge difference, the fact that Manuel has become stronger and is now being steering by the flow farther aloft allows it to “feel” the trough to its north a bit better, causing the northward motion we’ve seen today. While at the end of the day the forecast track will only be off by 50-100 miles compared to yesterday, the Gulf of California is less than 150 miles wide at its widest, which basically means Manuel will have direct impacts on the mainland of Mexico now as opposed to Baja.

So the forecast for Manuel:

Continue to drift along the western coast of Mexico for the next 36 hours. The system may make landfall at anytime between tonight and Friday between Culiacan and Ahome. Even if the system does not make a classic landfall anywhere along this stretch of coast, winds may gust over hurricane force at times over the next couple of days. Heavy rains will also be likely. As we head towards Friday and Saturday high pressure is still expected to briefly build in from the north and begin turning Manuel to the west. From this point it may threaten Baja between Loreto and La Paz. Fortunately the area between those two cities is extremely sparsely populated.

Manuel will likely become a hurricane this evening. Although the system is quickly intensifying as of this writing if it moves much closer to land the intensification will cease. Thus, I have a hard time forecasting anything stronger than a category 1 hurricane out of Manuel over the next couple of days. Most of our models show enough land interaction as Manuel moves up the increasingly narrow Gulf of California…and potentially some upwelling of cooler waters and Manuel constantly churns up the sea over the same area for the next few days…to significantly weaken Manuel by Saturday. This mucks up the track forecast somewhat over the weekend…as another trough is expected to dive into the western US. A stronger Manuel would likely be picked up by the trough while a weaker Manuel would likely continue to slowly drift near Baja. At this point we’ll again try to go with a weaker solution, causing Maneul to possibly make landfall on Baja this weekend as a weakening tropical storm that eventually dissipates. A look at our forecast track models for Manuel show how several different solutions are being portrayed by our various models:

Manuel models

Elsewhere in the tropics we continue to monitor an area of low pressure that has recently emerged over the Bay of Campeche after spending some time over the Yucatan Peninsula. Shower and thunderstorm activity has begun to become more concentrated near this rather potent low pressure center and a tropical depression will likely form within the next 24 hours if this trend continues:

95L vis

The center of circulation appears to be near the northern edge of the ball of convection on the above satellite imagery, due to some moderate northerly wind shear. As we discussed yesterday I expect shear to begin diminishing over this disturbance as an upper level anti-cyclone builds over it. This appears to favor a strengthening system over the next couple of days and we should have Tropical Storm Jerry in the southwestern Gulf of Mexico by the weekend.

From there the forecast remains highly uncertain as a trough over the central US possibly interacts with this area of low pressure. The models show the trough getting far enough south into the Gulf to pick up a stronger cyclone but leave behind the weaker one. You can see how borderline it is on this afternoon’s run of the National Weather Service’s GFS model:

95L GFS 96

IF this system remains weak it may get left behind by the trough and either dissipate or make landfall in Mexico. A stronger system may get picked up by the trough and get sling shot towards the Northern Gulf Coast. I still favor a weaker system staying south and moving into Mexico Friday or Saturday however if this low pressure system becomes more robust…oh say like Manuel over the past day…there could be a threat to the Northern Gulf Coast. Continue to stay tuned as we monitor this disturbance.

Posted in Uncategorized | Leave a comment

Tropical Trouble in the Gulf?

95 IR

Looks like the tropics will remain relatively active close to home for the next few days. Satellite shows a well-defined low pressure system just north of the Mexico/Belize coastline this evening with some thunderstorms firing near this low pressure. This system is tracking towards the WNW and should move into the Bay of Campeche on Wednesday.

95L vort wind

Environmental conditions are currently marginally conducive for development. An upper level low just west of the low pressure may cause modest northerly shear over the system for the next day or two…however that upper level low is shown by all modeling to weaken/move west. A weak upper level anti-cyclone (high pressure) exists near the low pressure and this is helping to vent the thunderstorms associated with the low pressure…note the winds to the northeast of the low pressure rushing away. Our forecast models show this kind of upper level wind pattern continuing, if not improving over the next few days.

95L gfs 72

The above image shows winds fanning away in the upper levels over the low pressure…at this point in the Bay of Campeche. In addition, note how the vorticity, or low level spin (organge lines on second image) is consolidated with this low pressure system. Unlike with hurricane Ingrid, there is not going to be a tropical cyclone on the other side of Mexico in the Pacific to compete with this low pressure system. This promotes an organizing system. Although waters are a bit cooler in the Bay of Campeche than they were before Ingrid…they are still marginally favorable for tropical cyclone development. If this low pressure can get out of the southern Bay of Campeche…waters are warmer and are warm to a great enough depth to promote an intensifying tropical cyclone.

95L Euro 72

So the question is…where will this low pressure system go? While there is currently a mid-level ridge of high pressure over much of the Gulf of Mexico that will limit how far north this low pressure system can track over the next couple of days…this ridge is expected to be eroded over the next 2-4 days by a trough dropping into the central US (above image). If this low pressure system is still weak in 3-4 days it will likely move into Mexico before this hole in the ridging allows the system to possibly turn north. If this low pressure system deepens into a decent tropical storm or hurricane within the next 3-4 days this trough should be able to pick up this low pressure system and threaten the northern Gulf Coast.

Which option is more likely? It’s tough to tell as most of our forecast models are rather split. What is often noted as the most accurate model, the ECM, actually picks up half of this system with the trough and slings it towards Florida in about 5-6 days and leaves about half of the system back over the southwestern Gulf of Mexico.

95L enkf

An experimental suite of ensemble guidance for tropical cyclone track…that has shown promise the last two seasons…shows this uncertainty. Most of these models actually show the low pressure system getting stuck in the Gulf of Mexico in 5-6 days. I think this is unlikely but illustraits how this track forecast has much uncertainty…although a system getting stuck in the Gulf of Mexico seems unlikely to me. Given the favorable environment that seems to await this low pressure system in the Gulf of Mexico and the fact that a stronger cyclone would be more likely to be picked up by the trough moving across the central US late this week…I have a sneaky feeling that this system won’t go quietly into Mexico. Either way…stay tuned…

95L tracks

Posted in Uncategorized | Leave a comment

Winter 2013-2014: An Early Look

So it’s getting to be that time of year where the days are just a little shorter…the high temperatures just a little cooler…and school getting back in session. Winter weather is still months away from most US locations…but it is starting to get to the point where we can look at some trends around the globe in both the atmosphere and oceans and try to take a stab at what this winter will bring. Here is a look at my final winter outlook from last year:

https://ohwxramblings.wordpress.com/2012/10/18/2012-2013-winter-outlook/

Pacific/Indian Ocean Water Temperatures:

winter outlook 1

Despite thoughts in the spring and even early summer than an El Nino may develop, the equatorial Pacific as of mid-August is running a bit cooler than normal, especially closer to South America. The most recent two winters have featured a warm Indian Ocean…as of mid-August however, the Indian Ocean has cooled to near or a bit cooler than normal. We are in the early half of a multi-decadal “negative” “Pacific Decadal Oscillation” (henceforth PDO), however this summer the PDO has tilted closer to neutral. We’ll discuss what this all means below:

El Nino-Southern Oscillation (from now on, ENSO):

The state of the ENSO describes sea surface temperatures in the equatorial Pacific, with a “El Nino” occurring when these waters are warmer than normal and a “La Nina” occurring when these waters are cooler than normal. The winter of 2011-12 was a strong La Nina. Last winter was a borderline cool neutral/weak La Nina. The question is, will the current cooler than normal waters in the equatorial Pacific lead to another winter La Nina?

Winter outlook 2

A “La Nina” officially occurs when the ENSO regions (shown above) average 0.5 degrees Fahrenheit or more below normal for three or more consecutive three month periods. As seen above on the breakdown of ENSO region temperatures through early August, we aren’t there yet. However, all of the ENSO regions have either cooled or held steady temperature wise since the beginning of June.

Winter outlook 3

Looking just below the sea surface in the equatorial Pacific Ocean…one can see that the expanse of warm anomalies that had developed sub-surface to begin the summer have generally subsided. However, cold anomalies have had trouble taking hold outside of the far eastern Pacific.

 winter outlook 4

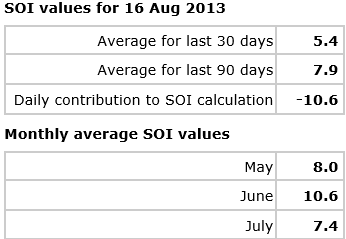
The Southern Oscillation Index, or SOI, is a measure of the pressure difference between western South America and eastern Australia. When the index is positive (as it has been on average for quite some time of late) it indicates that the pressures are higher over South America, which favors stronger than normal trade winds over the Pacific and an upwelling of cooler sub-surface waters. When the index is negative (which it was on Friday) the opposite occurs. A positive SOI favors the development/persistence of La Nina and vice/versa. The long term SOI this summer favors the development of La Nina, however recent values suggest otherwise. Updated SOI data can always be found at this link:

http://www.longpaddock.qld.gov.au/seasonalclimateoutlook/southernoscillationindex/

Current trends all lean fairly strongly against El Nino development, however there hasn’t been a strong push towards La Nina like conditions recently either. The very cold eastern Pacific does point towards a La Nina and an average of the ENSO regions is certainly tilted towards La Nina but isn’t quite there yet. Given only a modest tilt of the aforementioned factors towards La Nina development, I think that if a La Nina develops this winter it will be weak…if not, the ENSO will be “neutral” but certainly not warm.

Pacific Decadal Oscillation (PDO):

winter outlook 5

As mentioned above the PDO is in a multi-decadal “negative” phase since the late 1990’s…and has been especially negative since 2008. For reference, here are what the two phases of the PDO look like, courtesy of the University of Washington (warm/positive on left, cold/negative on right):

2

As seen at the top of the article, despite the long term cold PDO, the waters off the west coast of North America are rather warm at the present, which gives the current PDO a more neutral look. This is likely due to abnormally strong ridging and quiet weather over Alaska and western North America since mid-May, which has contributed to the rather rainy and at times cool summer over the central US:

winter outlook 7

The forecast models and expected placement of tropical convection this week suggest that troughing is likely to occur over northwestern North America over at least the next two weeks…and into September. If this occurs, those warmer waters will quickly begin to cool and the PDO will take on a more convincingly negative look. I expect this to occur and feel fairly confident in a negative PDO winter.

Indian Ocean:

winter outlook 8

The Indian Ocean Dipole (or IOD) is a measure of the east to west temperature gradient across the Indian Ocean. A negative IOD, as we are in currently, is indicative of warmer waters near Australia and cooler waters farther west near Africa. This summer’s current cool waters over the western Indian Ocean have at times created enough of a temperature difference across the ocean to meet the threshold of a “cold” dipole event. This is in stark contrast to the abnormally warmer waters over the western portions of the basin over the last two summers, which at times were warm enough to meet the threshold of a warm dipole event.

http://www.jamstec.go.jp/frcgc/research/d1/iod/DATA/dmi_HadISST.txt

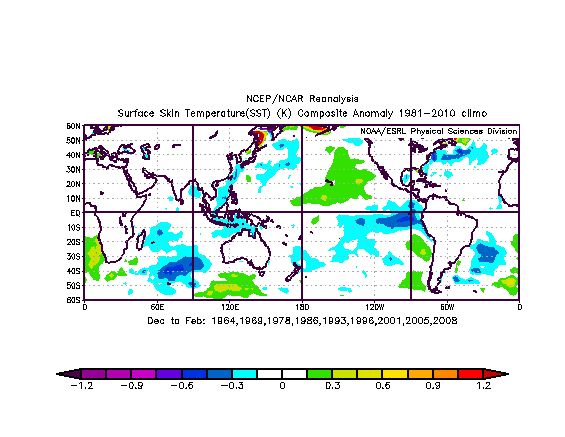
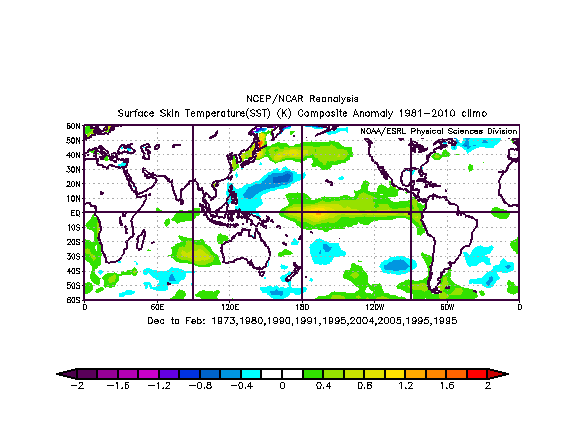
Based on this data set provided by Jamstec, I have found 9 cases since 1959 that featured a cool Indian Ocean Dipole over the course of December, January and February that may be similar to what we will see this winter. In general I looked for an average DJF index of -0.3 to -0.8, and threw out a few cases that matched this based on the index not being anywhere near this year’s negative index. Here is a look at where convection was more/less active than normal in the tropics during the years I selected during the DJF timeframe:

winter outlook 9

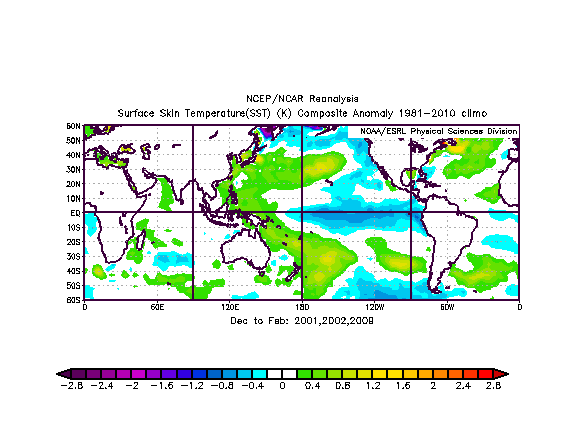
Note how unlike last winter, convection is generally less active than normal over the Indian Ocean and more active east of Australia and even east of the dateline. The composite SST anomalies of these winters shows a cool/neutral ENSO, however a couple of these winters were El Nino’s that may have skewed up precipitation amounts some east of the Dateline. A key here is however that we likely won’t see persistent convection as far west of the Dateline as we did last winter, which resulted in an abnormally strong Asian/Pacific jet and rather persistent ridging well off the western US coast. Below is a look at the SST in the winters looked at above:

winter outlook 10

Summing up the Pacific/Indian Ocean:

I expect a cool neutral ENSO this winter, with some chance at a weak La Nina. I expect the waters off the west coast of North America to cool, giving the PDO the more negative look we have been accustomed to in recent years. I expect the Indian Ocean Dipole to remain cool and perhaps become a true cold dipole event. In general one would expect convection to be most active from Australia to the dateline based on this SST configuration, putting ridging near/ just off the west coast of the US to the northeast of the convection. This is in contrast to last winter when ridging was strongest south of Alaska due to a persistently strong Asian/Pacific jet, especially early in the winter.

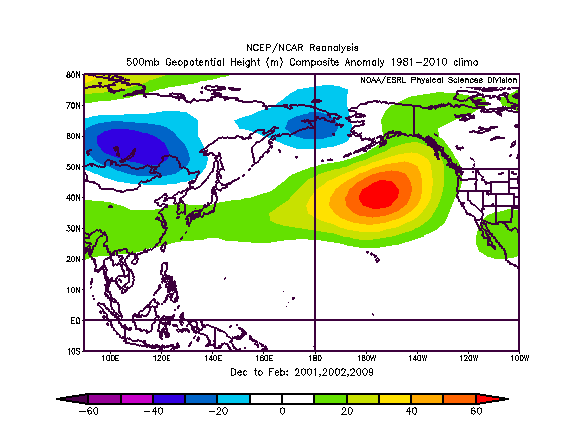
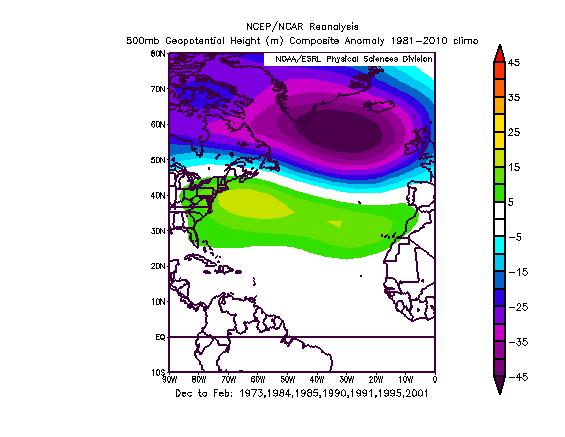
I have thumbed through DJF reanalysis SST’s over the Indian Ocean/Pacific since 1949, and found 3 years (coincidentally all since 2000) that reasonably match what I expect out of this winter’s SSTs:

winter outlook 11

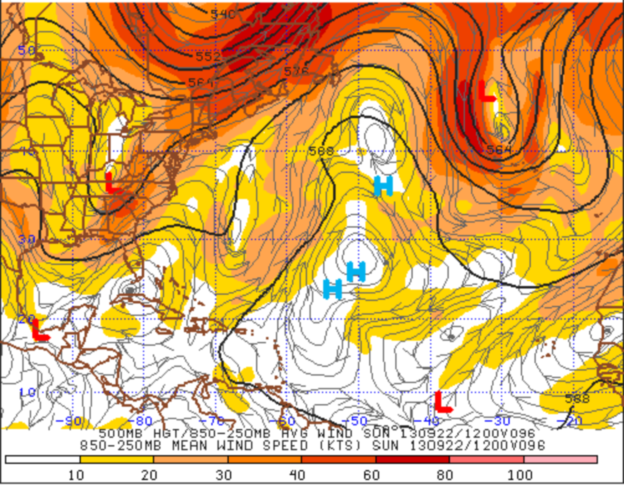
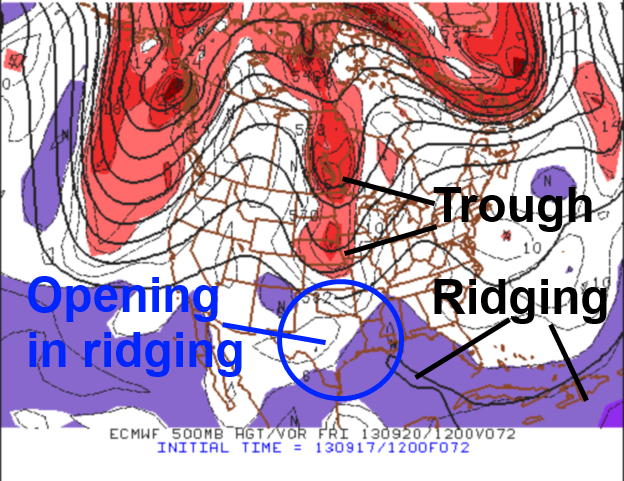
The mean 500mb pattern in those winters is close to what I described above…with ridging persisting a bit off the western North America coast, a bit east than where it was centered last winter:

winter outlook 12

With cool waters in the equatorial Pacific and ridging just off the west coast of the US, one would expect a weaker than normal sub-tropical jet promoting drier and warmer conditions than normal across the southern US this week…especially the southeastern US. With a possible southeast ridge and cooler than normal air east of the eastern Pacific ridge over the Rockies and central US…conditions could be rather wet across portions of the Mississippi Valley if the Atlantic cooperates…speaking of which:

Atlantic Ocean:

winter outlook 13

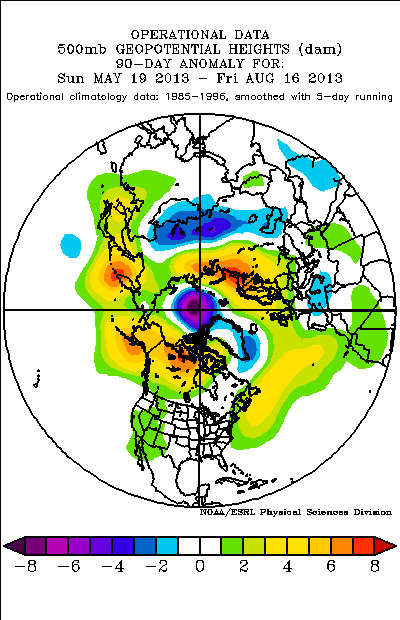
This summer has featured persistently warm waters off of the New England and Nova Scotia/Newfoundland coastlines, along with cooler waters off of the south coast of Greenland. The 500mb height anomalies have almost matched this configuration through the summer, with abnormally high heights from June 1 through mid-August off of the New England/southeastern Canada coastline, and lower than normal heights over the southern tip of Greenland. The question is, will this positive NAO pattern continue into winter?

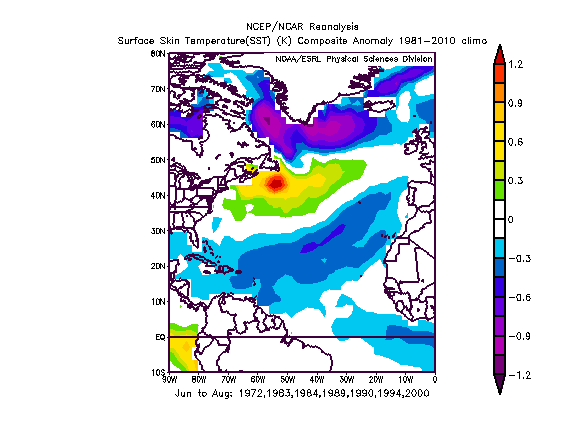
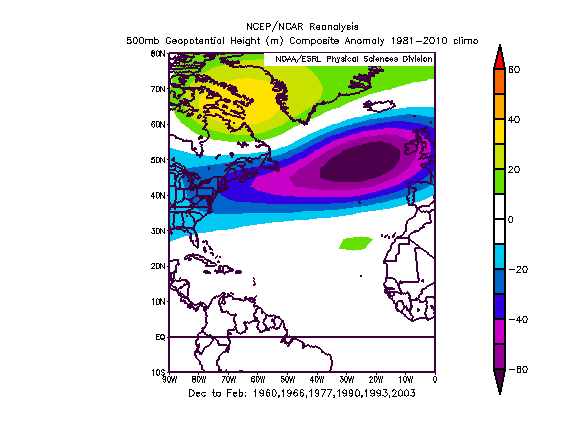
I have thumbed through all summers since 1949, seeking out other June-July-August periods that featured similar Atlantic sea surface temperature configurations…with emphasis on warmth over the NW Atlantic and cooler waters over southern Greenland…I also looked for summers that didn’t feature scorching waters in the equatorial Atlantic. Here is the mean SST anomalies from those JJA periods:

winter outlook 14

It turns out, when looking forward, that in most of those winters the warm anomaly off of the southeastern Canada coast went away when averaged out:

winter outlook 15

And for better or for worse, the mean 500mb height pattern over the Atlantic those winters featured a clear +NAO signal with eastern US ridging and lower than normal heights over much of the Northern Atlantic:

winter outlook 16

What is scary is a look at the Pacific and western North America 500mb height anomalies these winters is somewhat close to what I expect this winter, with ridging just off the western North American coast and trough over the central US, with perhaps some southeast ridging….although the above “Atlantic analog” years do not all match the “Indian Ocean/Pacific analog” years used earlier.

This year, the monthly NAO values have ranged from +0.5-+1.0 for each month April-August. When thumbing through monthly NAO values provided on NOAA’s Climate Prediction Center’s website (ftp://ftp.cpc.ncep.noaa.gov/wd52dg/data/indices/nao_index.tim) I found 6 years (since 1950) that had spring-summer NAOs that fairly closely resembled this year’s monthly values…and I had to get a bit generous with which years were included on the last at times just to get a data set larger than one or two years, evidently modestly but consistently positive monthly NAO values in spring-summer don’t happen often. The years found are: 1959, 1965, 1976, 1989, 1992, 2002. In those six years, four winters featured a predominantly negative NAO (1959, 1965, 1976, 2002) and two featured a predominantly positive NAO (1989 and 1992). Talk about conflicting data in more than one sense of the word! Here is a look at those winters from a level of about 500mb, on the mean:

winter outlook 17

As encouraging as this looks, the mean ENSO in these years was warm with a warm PDO…and well below normal waters off the coast of New England and southeastern Canada, which seems unlikely to occur this year. So, as encouraging as this may be for the eastern US, I’m not sure I’ll be giving it much weight.

Quasi-Biennial Oscillation:

winter outlook 18

A look at the upper levels of the atmosphere over the tropics suggests that the zonal winds are blowing stronger than normal out of the west, and strengthening in the stratosphere. Lower level temperatures and winds (500/200mb respectively) have not responded drastically, but it appears as though the QBO will be positive or westerly this winter, and perhaps moderately so. Since 1979, per this data-set using the 30mb level as a proxy (http://www.cpc.ncep.noaa.gov/data/indices/qbo.u30.index), I have found 5 years that featured the QBO rising to fairly high positive values in the summer that persisted into winter…they are 1982, 1985, 1990, 2008, 2010. When the QBO is in a “negative” or easterly phase sudden stratospheric warming events and potentially severe blocking are more likely. When the QBO is in a “positive” or westerly phase sudden stratospheric warming events tend to be less likely. In the years above, here is a look at the winter time 500mb heights anomalies over the upper latitudes in the Northern Hemisphere:

winter outlook 19

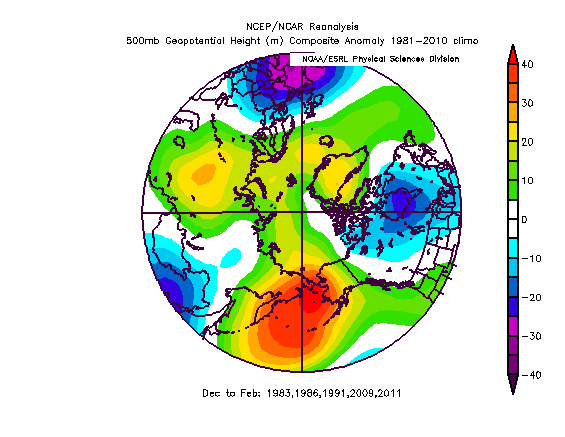
There are signs of high latitude blocking, especially from eastern Siberia to Alaska (which I’m not sure I agree with based on the Pacific pattern discussed above) and signs of a modest –NAO…although they aren’t strong.

Years with similar summer patterns:

winter outlook 23

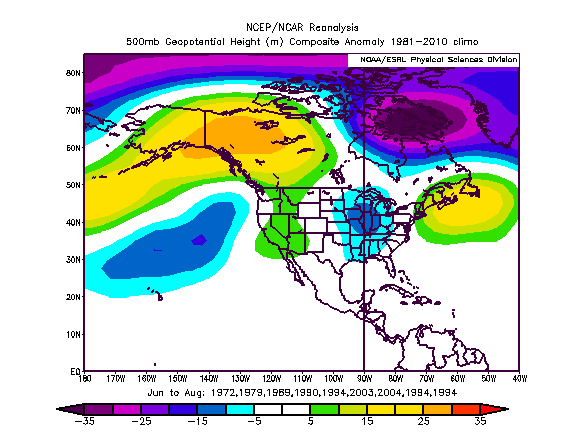
This summer (through mid-August) has featured positive height anomalies from Alaska east across northern Canada with lower than normal heights over southern Greenland…and above average heights off of the New England and southeastern Canada coastline. The western US has seen modestly higher than normal 500mb heights with modestly below normal heights over the Mississippi Valley and Great Lakes.

Looking over the North American summers since 1949, I found a few summers that matched enough of the above mentioned features for me to take a closer look. 1994 was the best match by a fair margin and was given extra weight. The 500mb height anomalies in those summers looked like this, not a terrible match:

winter outlook 24

The composite 500mb height anomalies for the following winters aren’t pretty across the whole US:

winter outlook 25

The mean SST anomalies from these winters featured a west-based El Nino, which appears unlikely this winter. There were some similarities in a mean cold PDO…similar Atlantic SST configuration…and not too far off Indian Ocean configuration. Although I won’t give the above composite a ton of weight, it may need to be watched a bit if the La Nina falls apart. At this time it appears unlikely, but it is still just August. Here is a look at the SST anomalies from those winters in the tropics:

winter outlook 26

Putting it all together:

Given everything discussed above, I feel fairly confident in ridging just off the west coast of the US and a trough over the Rockies and central US. I also feel fairly confident in a southeast ridge appearing at times with generally below average precipitation across the southern US from coast to coast due to a cool ENSO. I feel somewhat confident in the NAO averaging somewhat positive but not strongly so, which doesn’t bode particularly well for the east coast outside of New England.

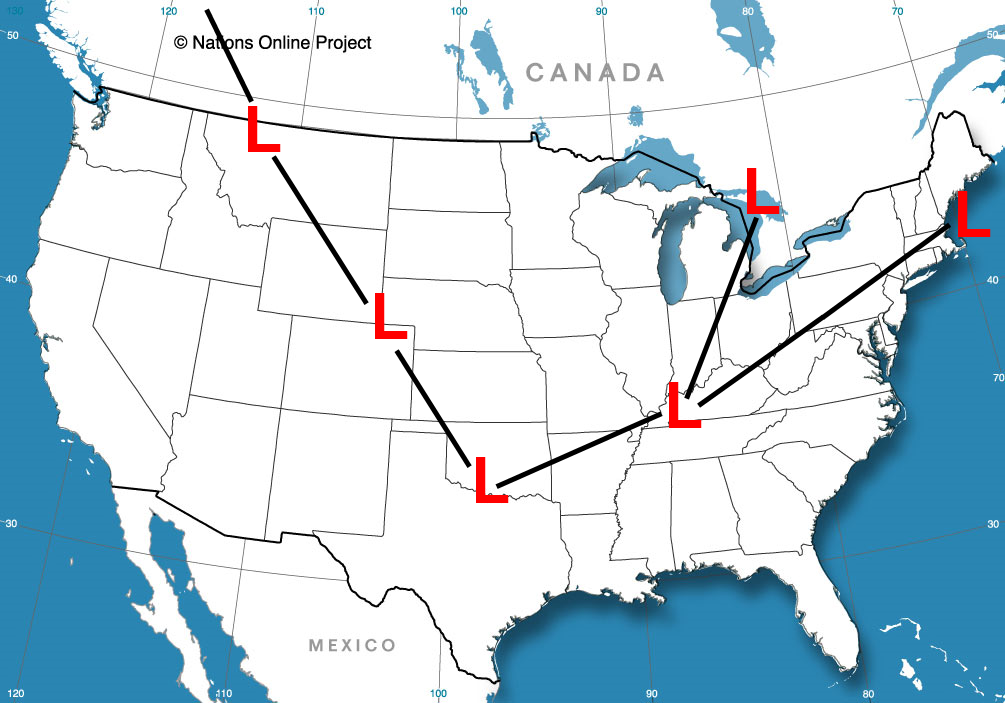
There may be a sudden stratospheric warming event and a period of strong –AO blocking, however I don’t feel like the QBO supports this, which may result in a predominantly positive AO winter. The best shot at persistent high latitude blocking may be over the EPO region (Alaska/western Canada) where I feel like ridging will be most consistently impinging on the polar vortex. Given where I think trough is most likely across the central US a favored storm track may be from the central/southern Plains east/northeast towards the Great Lakes and New England…which may favor above average snow across the central/upper Mississippi Valley…central/upper Great Lakes…and inland New England. Areas like the Ohio Valley…lower Lakes…upper Mid-Atlantic and southern/coastal New England may see many messy storms and even some warmer/rainy storms.

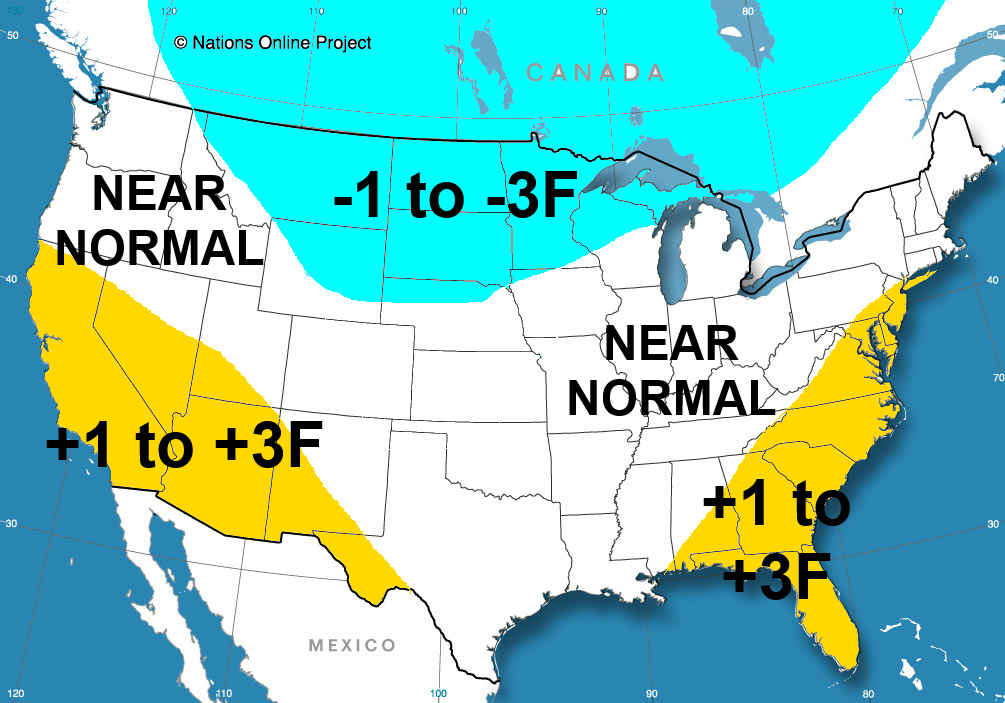
Trends among sea surface temperatures worldwide and other factors such as fall snowcover will give us a better idea of what to expect as we head towards October and November, but here is a look at what I expect this winter across the US and southern Canada…on a mean for December-February. If time permits I will update this outlook as needed and add monthly maps in about two months. Thanks for reading!

My current thoughts on DJF temperatures:

winter outlook 20

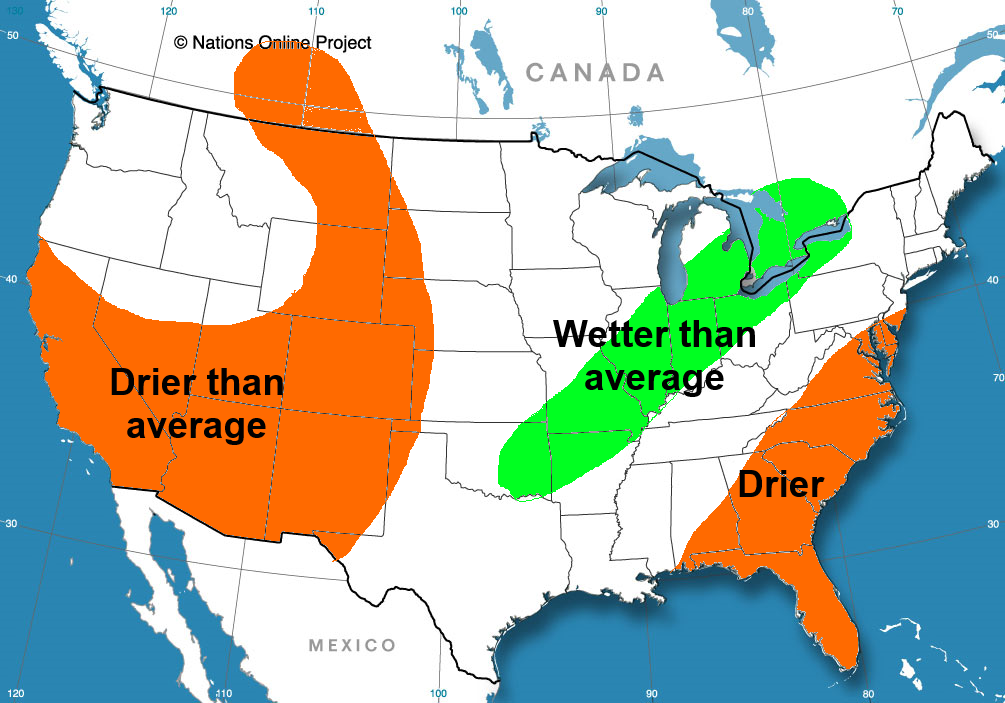
Thoughts on DJF precip:

winter outlook 21

Based on my interpretation of the pattern, storm tracks that may be common:

Winter outlook 22

Posted in Uncategorized | 3 Comments

April 2-3, 2005 Northern Ohio Snowstorm

This will be article 1 or 4 discussing moderate to in some cases extreme snowfall that has occurred over Northern Ohio in April. Because my memory and in some cases archives of these events become quite fuzzy the farther back we go, I will be examining for decently recent events, from 2005 onward, of heavy April Snowfall.

Synopsis/Observations:

The winter of 2004-2005 was already a notable one across much of Northeastern Ohio, with Cleveland Hopkins International Airport, henceforth CLE, the flagship official climate station for the Cleveland metro, approaching record snowfall for a single winter. April snowfall does occur from time to time across Northeastern Ohio, and every now and then more than just a light dusting does fall, especially in the Snowbelt. However, with CLE only averaging 3.3” of snow during the month of April (using 1981-2010 averages), one is never able to firmly count on April to deliver significant snowfall, even after a winter like 2004-2005 during which the atmosphere seems to produce excessive amounts of snow ad-nauseam across Northern Ohio.

However, the atmosphere would put to doubt whether or not 2004-2005 would become the snowiest winter on record in Cleveland during the first three days of April:

April 1, 2005 500mb

Although wavelengths tend to shorten in the spring, similar principles still apply. As we look at the 500mb chart, representing the weather pattern at 18,000 feet on 4/1/05, it is evident that there is ample western US ridging for trough amplification over the central US. This, combined with higher heights than normal over eastern Canada and Greenland, which aren’t readily visible on this map, ensured that the trough would not be in any hurry to move east and allow mild air to return to the Midwest, Great Lakes, and Ohio Valley in early April of 2005.

A shortwave seen rounding the base of the trough on April 1 sparked off a surface cyclone over Texas that tracked east-northeast during the first and second of the month towards the Tennessee Valley:

April 1, 2005 sfc-sat-rad

A look at the surface map for the evening of April 1 shows our surface cyclone tracking well south of the region. However, due to the fact that it’s April, there was not much cold air to the north of the system yet, meaning much of the precipitation falling over the Great Lakes and eastern Midwest was rain. So, we would have to wait for colder air to arrive for the snow to begin.

april 2, 2005 500mb

The wait would end as we trudged towards April 2, as the 500mb trough (shown above the morning of the 2nd) would close off, allowing dynamical cooling to slowly cool the lower levels of the atmosphere over the northern Ohio Valley and lower Great Lakes. Some cooler air was also pulled down from Canada during this process.

april 1, 2005 12z

Another look at the morning of April 2nd off of the Penn State e-wall shows the freezing line at 850mb, or about 5000 feet above mean sea level, plunging into the Deep South. In April this usually does not correlate well with the rain/snow line; at the elevation of northern Ohio (600 feet at the Lake Erie shoreline to over 1100 feet in some of the hills in far Northeastern Ohio) 850mb temperatures usually need to dip below -5C/23F to get accumulating snow in April. Although the -5C isotherm is not near Ohio yet on this image, the air was cold enough and precipitation heavy enough for snowfall to begin reaching the ground over Northwestern Ohio in the few hours proceeding this image. CLE began mixing with snow around 4am on the 2nd, changed to snow by 4:30am, and remarkably reported snow in every observation for the rest of the day, with visibilities at times dropping to ¼ of a mile, signifying heavy snow.

Once you got to the east side, the track of the 850mb low (shown in the bottom right panel) held back the rain snow line through a good chunk of the day. At Ashtabula County Regional Airport (henceforth HZY) the transition to snow did not occur until 1:25pm on April 2, and the air temperature did not drop below 35 degrees until after midnight, holding accumulations in check well east of Cleveland until after dark on the 2nd.

Either way, snow was ongoing and accumulating moderately to heavily at times by late April 2 and continued right on into April 3 before tapering in the morning from west to east.

The snow on the west side, including at CLE, shutoff soon after 12am on the 3rd as the event become more and more lake-effect driven thanks to the synoptic precipitation with the surface low pressure beginning to pull off to the east. However, on the east side, snow continued through much of the morning on the third:

April 3, 2005, 6z

Note how from Cleveland west, the mid-levels of the atmosphere are drying and high pressure at the surface is beginning to move in. East of Cleveland, the atmosphere remained moist and the western edges of a cyclonic flow helped insure large scale lift/convergence over the region. With 850mb temps dropping to near -5C in this timeframe, there was just enough instability added from Lake Erie (water temps approaching 40F/+5C (educated guess)) for snowfall amounts to be enhanced east of Cleveland. This resulted in many hours of moderate to heavy snow east of Cleveland.

At HZY, moderate to heavy snow occurred in consecutive observations from 4:53am on April 3 through 1:53pm on April 3, meaning visibilities were reduced to less than ¾ of a mile. There were 5 hourly observations (non-consecutive) in this timeframe during which heavy snow was reported, meaning visibilities were reduced to less than ¼ of a mile for a considerable portion of the event.

Despite all of the snow, CLE never dropped below 33F during the event, which occurred during the afternoon and evening hours on the 2nd, and HZY, stunningly, never dropped below 33.8F during an hourly or intra-hourly observation, and was generally sitting at 34-36 degrees during the heaviest snowfall. CLE rebounded to 53 by late afternoon on the 3rd and HZY rebounded to 46 by late afternoon on the 3rd, despite recording “heavy snow” as late as 12:53PM and “snow” (with a visibility of half a mile) as late as 1:53PM. CLE reported 6.8” of snow with the event. Ashtabula (not formally specified as HZY in the official release) recorded 16.8” of snow.

Four other regional airports in Northern Ohio were affected in at least a moderate fashion by this early April snowstorm in 2005:

Mansfield (MFD):

Changed to snow at 7:30am on 4/2/05, and reported snow in every observation through 11:11PM when the snow summarily ended. Being farther inland from the slightly warmer waters of Lake Erie, MFD was able to cool to 32-33F during the majority of the heaviest snowfall. The visibility at MFD was held at or below 1 mile from 7:52am through 5:10PM on 4/2/05, with the visibility held at or below ¼ of a mile from 10:22am through 1:52pm, signifying over three hours of consistent heavy snowfall. Visibilities again were held to ½ to 1 mile from 6:45pm through 9:52pm, signifying another three plus hour period of heavier snowfall. MFD reported 8.0” of snowfall with the event.

Akron/Canton (CAK):

Rain did not completely change to snow until 1:51pm on 4/2/05 at CAK after two hours of rain/snow mixed. After the rain fully changed over to snow, snow was reported in every single observation through 5:50am on 4/3/05 (with another brief period of light snow around 8:00am on 4/3/05). Being inland from Lake Erie also helped temps at CAK sit at 32-34 degrees during the heaviest snowfall, which is conducive for accumulation once snow comes down at a heavier clip. At CAK, the visibility was held at or below 1 more from 2:04pm on 4/2/05 through at least 1:51am on 4/3/05 (although, it should be noted there were no observations between 1:51am and 4:50am on 4/3/05, potentially due to a power outage). Visibilities at CAK never dropped below ½ of a mile, however with many hours of moderate snowfall and temperatures at or just above freezing, some accumulation did occur. CAK reported 5.1” of snowfall with the event.

Youngstown (YNG):

Changeover to snow occurred by 1:51pm on 4/2/05, with snow reported in every observation through 1:51pm on 4/3/05, meaning YNG received 24 consecutive hours of snowfall in April. Being inland from Lake Erie also helped YNG hover between 30-33 degrees during the majority of the snowfall, allowing for snow accumulations to occur. At YNG the visibility had dipped below 1 mile by 6:38pm on 4/2/05 and did not rise above 1 mile again until 1:43pm on 4/3/05, representing over 19 consecutive hours of “high-end light” or moderate/heavy snowfall. In that timeframe YNG reported half mile or lower visibility from 5:51am on 4/3/05 through 12:51pm on 4/3/05 (7 hours) and reported quarter mile or lower visibility from 6:04am through 10:51am on 4/3/05 (just short of 5 hours). Through all of that, YNG reported 8.5” of snowfall.

Lorain/Elyria (LPR):

LPR changed over to snow by 3:51am on 4/2/05, and reported snow in every observation except for one through 7:53pm on 4/2/05, representing 16 hours of essentially persistent snowfall at LPR. Although LPR did not have any notably long periods of visibilities at or below one mile, there were a couple hours of moderate snow in the morning and again after noon, with visibilities bottoming out at ¼ of a mile at 2:53pm on 4/2/05. Temperatures generally sat between 33-35F during the snowfall at LPR. No official tally from LPR was available from what I could find, however, based on nearby snow totals and observations at the airport, it appears as though 4-6” of snow reasonably fell on 4/2/05 at LPR.

Societal Impacts:

Leaves were just beginning to open up across Northeastern Ohio when this snow fell, however winds gusting over 40MPH and the heavy nature of the snow (note, surface temperatures generally sat above freezing or fell just below it during the snow) allowed for widespread tree and power line damage from eastern Cuyahoga, northeastern Summit and northern Portage Counties points eastward through Geauga and Ashtabula Counties. Tens of thousands were left without power. Travel due to downed trees/wires and heavy snow accumulation on roadways was nearly impossible on the 3rd across much of Geauga and Ashtabula Counties, and was hampered at times well west of there late on the 2nd into the morning of the 3rd where lighter, but still significant, snowfall totals were observed.

Comments:

The fact the Toledo never reported snowfall with the event and Findlay only reported a few hours of light snow or rain/snow mixed illustrates how much dynamical cooling thanks to the deep/closed 500mb low helped change rain to snow, and also shows how heavier precipitation rates helped the changeover as well, as Toledo and Findlay never got into heavy precipitation on 4/2/05. The slow movement of the 500mb trough/low allowed the deformation snows to sit over north-central and northeast Ohio for many hours, and added moisture/conditional instability from Lake Erie allowed the Snowbelt communities to see the heaviest snowfall totals.

2-day radar loop of event (times are in UTC, subtract 4 hours from time shown on radar to obtain EDT equivalent):

https://www.youtube.com/watch?v=6MqWPptZ-aM

Snowfall total highlights:

Ashtabula County:

22.0” in Conneaut along I-90

23.0” 2 miles SE of Pierpont

16.9” in Geneva

16.8” in Ashtabula

Cuyahoga County:

9.0” in Shaker Heights and North Royalton

6.8” at CLE

Geauga County:

24.8” 3 miles south of Thompson

22.9” 5 miles southwest of Thompson

20.5” in Hamden Township

17.0” in Chardon

Lorain County:

5.6” in North Ridgeville

Mahoning County:

8.0” in Austintown

Medina County:

5.8” in Hinckley

Portage County:

11.5” in Hiram Rapids

5.2” in Kent

Summit County:

5.1” at CAK

Trumbull County:

8.5” at YNG

*Colt Station in NW PA reported 29.0” of snowfall with the event.

I have the complete list of snowfall totals saved to my computer. If you would like a full copy of snow reports let me know.

Images 1-3 were obtained from this website:

http://locust.mmm.ucar.edu/case-selection/

Radar loop was also constructed using data obtained from that website.

Images 4-5 were obtained from this website:

http://www.meteo.psu.edu/~fxg1/NARR/2005.html

The archived PNS containing snowfall reports used above was obtained from this website:

http://has.ncdc.noaa.gov/pls/plhas/HAS.FileAppSelect?datasetname=9957ANX

The hourly observation data sited above for CLE, CAK, MFD, CAK, LPR and YNG were obtained through Wunderground.com

Posted in Uncategorized | Leave a comment

Thanksgiving Day Weather Rundown

Current Pattern:

A current look at the upper level pattern over the Northern Hemisphere reveals that ridging persists across a good portion of the central and eastern US. An upper level low remains in place near Iceland, however this upper low is quickly weakening and moving out of the picture. As this happens ridging currently nosing to near the Davis Strait will move over Greenland and help the NAO go negative. An upper level low pressure remains pinned south of the Alaska ridge which will continue to build over the coming days. As this upper low drifts south it will allow weak ridging to also develop over the western US into early next week.

At the same time, a potent piece of energy that is crashing into the Northwest US in the above image will move east, and beat down the ridging over the eastern US. This will result in a significant pattern change over the eastern and central US this weekend into next week.

A look at the projected pattern for Saturday morning off the European model ensembles, and it is evident that a significant upper level trough is expected to develop over the eastern US, ushering in much more winter like temperatures and some snows downwind of the Great Lakes and the favored upslope regions in the Appalachians.

At this point, the aforementioned –NAO is beginning to take hold, however it is not in the classic position yet and the NAO is technically near neutral at this point, thanks for lower heights over Greenland. Weak western US ridging has developed in response to the weak remaining upper low pinned south of the Alaskan ridging early this weekend. Cold air continues to also poor into western Alaska due to a cross polar flow created by the Alaskan ridging. This will set the stage for a second blast of cold air and potential storm threat over parts of the eastern US early next week, as mentioned in my previous post.

As we roll the European ensembles forward to Tuesday morning, one can see that the NAO is expected to be strongly negative by this time, although focused slightly east of Greenland. In addition, although Alaskan ridging is expected to continue, the models now show weaker ridging than previously thought over this region. This in turn allows the polar vortex to get pushed a little bit farther west than previously thought and not quite as far south.

On the above image an active sub-tropical jet is quite evident, with lower than normal heights extending from off the southwest US coast into the southeastern US. With the polar vortex potentially a bit less suppressing and farther west than initially thought, this may give create enough room for a storm to wrap up and cut into the Great Lakes Tuesday-Wednesday.

This threat is still a bit far out and although I was initially leaning towards a more suppressed storm track east of the Great Lakes, the positioning of the polar vortex makes a Lakes cutter more likely early to mid next-week. The models are still all over the place with this potential system, so it is too early to make a determinant call, but for now I’m leaning towards a weak storm tracking into the upper Ohio Valley with potential snow from the lower lakes east into parts of New England, although confidence in this is low.

When looking at the forecast telleconnections for early next week, the NAO and AO are expected to be negative, with the PNA still negative as well heading into early December. This supports a trough over the northeastern US and on the west coast of the US with some ridging trying to build into the central US. This leads to the forecast idea of a shot of cold air from the eastern Midwest points eastward into the Ohio Valley and Northeast to end next week behind any storm that comes through, which jives with current model predictions:

However, with the troughing along the west coast flooding the central and western US with Pacific air and raising heights in this area, it appears as though the trough will become focused right along the east coast, which will favor storms riding into Nova Scotia, if they occur. Thus, after the mid-week storm threat next week, it is unlikely that the eastern US (or anyone except for the mountains in the Northwest US) will see any significant snow threats to end the month of November.

When looking at the telleconnection forecasts, there are a few trends into early December:

-The PNA will slowly try to trend positive; however it is uncertain if this will happen.

-The NAO may try to rise in early December.

-The AO forecast is highly uncertain as we head into early December.

A look at the upper level pattern over the Pacific shows that while heights are rising near the Dateline compared to the past week plus, indicative of a possible MJO pulse, that the tight and fast flow still remains over the extreme western Pacific, with the flow decoupling over the central Pacific. This favors continued storms into the extreme NW Pacific with ridging over the central Pacific:

Note how, as days ago, low pressure systems are currently rising up towards Japan and eastern Russia, pumping up the ridging into the Aleutian Islands and points north, focusing troughing near the west coast of the US.

The MJO is still projected to pulse and propagate east shortly, heading through phases 1 and 2 next week and the week after. The GFS and European remain consistent and in generally good agreement on this MJO pulse occurring in the mid-range, and the GFS for mid-week next week does show higher heights aloft associated with ridging east of the dateline, trying to enhance ridging over the western US:

Note how higher than normal heights are now squarly east of the dateline. This is trying to enhance the flow off the west coast of the US (south of Alaska) and push surface cyclones into NW Canada and pump up ridging on the western US coast. However, note how the polar vortex over Russia is so strong that it is still focusing a very strong jet over the western Pacific that breaks and results in ridging into the Aleutians.

In my previous post I mentioned it would be curious to see how this MJO pulse modulated the Pacific pattern, because it would try to reverse what is currently occurring. The early answers look like the western Pacific pattern, or WPO, will remain “negative,” meaning below normal heights over northeastern Asia and ridging into the Aleutian Islands, which telleconnects to troughing on the west coast of the US, and ridging over the central US.

Until we can dislodge or weaken this polar vortex, we may see this type of Pacific pattern continue, despite the MJO.

As we look at the stratosphere, the GFS and ECM remain consistent in significantly warming the lower and middle portions of the stratosphere and splitting the lower and middle portions of the stratospheric vortex beginning this weekend and continuing into early December. Although the upper portions of this vortex are expected to remain very strong and cold, this warming and vortex split are focused over eastern Asia, which means that the tropospheric vortex there may eventually be disrupted.

In fact, the European ensembles at the end of their run and the GFS ensembles in early December do in general show a gradual weakening/displacement of the eastern Asian polar vortex:

So, although this is a long way out, it jives with the stratospheric warming in that area. This may allow the MJO to do its thing and force ridging over the western US as we head into the second week of December.

In addition, with tropical forcing expected over the east Pacific or central America in the week two timeframe, that encourages cyclones over eastern North America, which favors a –NAO downstream. So, I do think the PNA will trend positive, but it will likely take until the second week of the month for that to happen. I believe the NAO will predominantly remain negative through mid-December due to tropical forcing being located over the eastern Pacific, which is supported by the current GWO heading towards phase 6. The AO forecast remains more challenging due to the strong stratospheric vortex; however, if strong blocking continues on both sides of North America we likely will not see the AO trend back to positive values until mid-December.

Week by week breakdown:

11/26-12/2: Troughing takes over in Northeastern US after mid-week. Potential storm threat from eastern lakes to New England as this trough pushes east. West coast remains cold and wet. Central US starts cold early week but moderates towards the weekend.

12/3-9: New England near to slightly below normal temps due to –NAO, however no significant storm threats. Rest of eastern and central US above normal temps and near normal precip. Western US slightly below normal temps trending warmer towards weekend.

12/10-16: Eastern US colder than normal with above normal precip. Central US near normal temps and drier than normal. Western US warmer than normal and drier than normal.

After mid-month: The pattern may break down if the MJO pulse continues east, which seems possible. As blocking over Alaska weakens, the polar vortex may retreat back north and allow colder air to stay bottled up north.

Storm threats:

  1. Threat for low impact (a few inches) of snow in eastern Lakes into New England Tuesday-Wednesday.
  2. Threat for a Nor’ Easter and Lake Effect snows second week of December if anticipated pattern takes hold.
Posted in Pattern Discussion | Leave a comment

Pattern Shift Beginning to Occur Over North America; What are the Implications?

A current look at the large scale pattern reveals that although the pattern is “zonal,” or flat across much of the US at this time, that heights continue to rise over the Aleutian Islands into the arctic circle. This is dumping a lot of cold air into Canada and will continue to do so over the next week, and this cold air is going to try to come south.

A current look at the teleconnections, which can be done off the map, shows that:

-The NAO is positive right now, with a large upper low and very fast flow over the North Atlantic. This corresponds to higher heights/ridging over the eastern US, which is occurring at this time.

-The AO is neutral right now, which means arctic air isn’t any more or less likely than normal to be displaced south.

-The PNA is negative right now, which favors troughing over the western US and ridging over the eastern US. This again is occurring right now.

I mentioned in my previous post that:

-The NAO is likely to fall for the last week of November into December, due to tropical forcing.

-The AO forecast is highly uncertain due to the strength of the polar vortex in the stratosphere conflicting with the expected location of tropical convection in the coming weeks.

-The PNA is forecast to stay negative through the end of November, but tropical forcing argues for a rise in the PNA near the beginning of December.

The latest telleconnection forecast for the NAO, AO and PNA off of the GFS ensembles shows some semblance to this idea as we head into the first couple days of early December. However, there is still much variability between the individual ensemble members on exactly how each telleconnection responds over the next two weeks.

A latest look at global tropical convection shows that the strongest convection near the equator is occurring west of the dateline. This continues to, as discussed in my previous blog, result in the subtropical ridging being stronger north of these areas, over the western Pacific, due to the latent heat released by the convection. This results in the strongest jet stream to be focused over this area before weakening near the dateline, resulting in storminess in the northwest/north central Pacific and ridging east of the storms near the Aleutian Islands:

Thus until the MJO tries propagating eastward, we will not see a breakdown of the Aleutian ridging and –PNA pattern.

The GFS and Euro and their ensembles are still insisting on the MJO breaking into phase 1 the last week of November, which would signify convection east of the dateline. An intuitive approach here indicates this would slowly break down the Aleutian ridge/-PNA pattern:

As convection shifts east with the MJO, the jet streak would weaken in the central Pacific as opposed to western Pacific, resulting in cyclones occurring near the Aleutian islands. The ridging east of the cyclones/storminess would occur near the western US coast, which would be a near reversal from the current Pacific pattern.

The Global Wind Oscillation continues to rise to more positive phases, and is nearing phase 5. This illustrates that the upper level winds will be stronger closer to the equator, which is more typical of an El Nino. In addition, as can be seen by the explainer graphic on the left, phases 5 and 6 of the global wind oscillation tend to indicate that convection near and east of the dateline is likely.

Given we have seen a significant warming of waters in the central equatorial Pacific in recent weeks, this transition to a more El Nino like GWO makes sense. Given the transition of the GWO to more positive values (phases 5-7 are positive, 8 and 4 are neutral, 1-3 negative) in tandem with consistent model predictions of the MJO trying to propagate east the last week of November into December, I believe the forecast for the PNA rising and potentially becoming positive in early December that I put out remains logical.

Now, this may be quite an interesting prospect, as the ridging near the Aleutian Islands is quite strong, and may take some time to weaken.

As we take a look at the stratospheric vortex, it, as expected, remains fairly strong, especially in the upper portions of the stratosphere. This will make it somewhat difficult to see strong blocking in the NAO and especially AO regions in the short term.

As we head forward to the forecast for November 28th in the lower portions of the stratosphere, the European model does shows a significant warming occurring over the eastern hemisphere with the vortex becoming stretched and compressed a bit. However, this is not a significant weakening of the vortex, yet.

However, the vortex will not be over powering over N. America or the N. Atlantic over the next week and a half, so this combined with the expected MJO propagation does favor a negative NAO. How negative it gets remains in question. If the NAO goes negative with a strong Aleutian ridge ongoing the polar vortex in the troposphere would likely be split, resulting in quite cold air getting close to or in the northern US.

A day 10 forecast comparison between the GFS and European ensemble means show some similarities and differences:

-With the NAO, the European ensembles, on the left, is slightly stronger with the height anomalies over Greenland than the GFS ensembles.

-With the EPO/Aleutian ridge, the GFS ensembles on the right are much slower in beginning to weaken the block than the European ensembles.

-Either way however, both models show a bit of a ridge bridge occurring across the North Pole between the two blocks, displacing the polar vortex and focusing a trough off the western US coast and another trough somewhere over the east, with some very cold air to play with. Both models also show lower than normal heights off the western MX coast, signifying potential sub-tropical jet energy in play.

So, my call on the pattern over the next two weeks:

-Aleutian ridge begins weakening in about 10 days, maybe slightly sooner. NAO goes negative in a week to ten days. PNA likely takes about two weeks to go positive but I do expect a +PNA with western US ridging to develop in the first week of December.

-Uncertain as to how long NAO stays negative. MJO argues for a –NAO through the first week or two of December, however.

Storm threats:

  1. Strong energy crashing into the northwest US this Wednesday will amplify over the Great Lakes/Northeast as the NAO goes negative and the polar vortex forces the energy southward. Potential lake effect downwind of lakes and upslope snows in New England Mountains, along with gusty winds this weekend as a result.
  2. As the polar vortex moves south in 8-9 days a strong gradient pattern will develop from the southern Plains through the Ohio Valley and Mid Atlantic/New England. Any waves that ride out of the southwest in this timeframe may produce snow/ice in these regions.
  3. Rising PNA and potential –NAO indicate potential snow storm threat in eastern third of US in early December.
Posted in Pattern Discussion | Leave a comment

Quiet Pattern Persists East of Rockies; When Will the Pattern Become Active?

Above is a look at what has quickly become a relatively quiet weather pattern from the Plains east to end the work week. The reasons for this are relatively easy to pin point on the above map:

  1. Polar vortex over Greenland and Northern Canada combining with a strong vortex off the west coast of the US to tighten up the polar jet
  2. Troughing along the west coast forcing ridging over the eastern US, with the +NAO allowing the ridging to extend all the way to the east coast.

So, until this pattern buckles, the quiet weather will continue across the eastern 2/3rds of the US. Right now there are not any signs of this changing through much of next week.

As we take a look at the forecast telleconnections off last night’s GFS ensemble runs, we see some trends:

  1. The NAO will trend closer towards neutral. However, will it go negative?
  2. The AO shows wild variability. More on that in a moment.
  3. The PNA is expected to remain negative, meaning troughing will persist over the western US over the next 10-14 days. However, the trend was for the PNA to head towards neutral in 10-14 days, meaning the trough along the west coast may weaken into December.

To determine if these teleconnection forecasts are accurate, we are going to take a look at the tropical Pacific to determine what may happen down the road. You may be asking, why does the tropical Pacific, located nowhere near North America, affect me? Well, latent heat from convection over the Pacific modulates sub-tropical Pacific upper level ridging strength, which dictates where the Pacific jet sets up, which results in low level cyclones forming, which ultimately affects where troughs and ridge will be located over the eastern US. Let’s take a quick look at this now:

The strongest and most active convection in the tropics is occurring, per the above image, over the Indian Ocean at this time. This is resulting in stronger sub-tropical ridging over Asia, and results in the strongest jet-stream to be located over the western Pacific, as can be seen on this afternoon’s GFS model 250mb analysis:

Note the higher than normal heights associated with the ridging west of the dateline into southern Asia, and note below, how this accelerates the flow of the jet stream in this area:

This is important, because, as we discussed with Sandy, the jet streaks affect surface level cyclones in a big way. The left-exit and right-entrance portions of these upper level jet streaks feature upper level divergence and lift, which aids in strengthening lower level cyclones. Right now, the left exit portion of the above jet streak over the western Pacific is located over eastern Russia and the extreme northwest Pacific, meaning cyclones are favored in this area. The current surface analysis reveals this to be true:

This means that cyclones are continually pumping warmer sub-tropical air northward to their east, which happens to be over the Aleutian Islands. This means geopotential heights will be higher in these areas as the warmer air is more buoyant and rises, forcing the atmosphere to more or less become “thicker,” as we witnessed above with the higher heights occurring with the convection over the Indian Ocean, which also releases heat.

This is certainly the case in this instance, as upper level ridging is extending north to the east of all these surface cyclones, and the northerly flow on the east side of this ridging is forcing the west coast trough, ala a –PNA. The question is, when does this pattern change?

Above are plots of the GFS and ECM MJO phase forecast. Essentially, the MJO is relatively weak right now, however it is projected, per the models, to strengthen and move into the western Pacific and into our hemisphere, IE, east of where it is now, in a week to two weeks. Visually, the GFS brings the convection east of the dateline after Thanksgiving, as shown below:

The question is, is this MJO pulse plausible?

The GWO, which is a measure of Earth Atmospheric Angular Momentum, which essentially is the air in the atmosphere spinning to keep up with the Earth’s rotation, is undergoing a phase shift. Look below:

The GWO/AAM are going from “negative” phases to more positive ones. This is an indication that the configuration of upper level winds are changing, and shifting east. As one can see in the brief explanation graphic two images up, if the GWO/AAM continue to trend towards phases 5 and 6, convection near and east of the dateline will be favored, which would effectively dislodge the –PNA as discussed above. However, we still appear to be a couple weeks away from this happening.

There are a couple ways a –NAO event can occur. The first one is related, also, to what occurs over the tropical Pacific. If the convection associated with the MJO occurs east of the dateline, the configuration of the jet streaks does tend to focus surface cyclone-genesis over the eastern US resulting in higher heights extending towards Greenland/the NAO region. There are some subtle signs of this happening in a couple weeks, although no extremely strong signs yet that the MJO will become favorable for this.

The other way is if the stratosphere suddenly warms and the polar vortex is disrupted:

The most recent look at the lower portions of the stratosphere shows a relatively well organized but not terribly strong vortex. The upper levels of this vortex are much stronger. There are some signs that warming occurring over Asia will attempt to disrupt the vortex over the next week or so, with the Euro trying to show the vortex splitting in 9 days:

A split polar vortex allows for very cold air to plunge farther south and makes things more favorable for high-latitude blocking. However, the European and GFS both fail to disrupt the upper levels of the polar vortex over the next 10 days, meaning it is uncertain how much high latitude blocking will occur.

When putting this all together, there are a few things that seem apparent to me:

-The ridging near or just west of Alaska will allow very cold air to pile up in Canada over the next 7-14 days.

-The troughing on the west coast may weaken or even be replaced by ridging in 2-3 weeks.

-Although the models are trying to show the NAO again going negative in 10-14 days, there are mixed signals with regards to how that plays out, and that is a wild card with respect to whether storms to near the beginning of December track towards the Great Lakes or farther south/east, IE near or off the East Coast.

When comparing the GFS and European ensembles in 9.5 days, or next Sunday evening, there are some similarities and differences:

-The strong polar vortex is evident on both models.

-Strong Alaskan ridging persists on both models along with troughing along the western US coast.

-Although ridging is building south of Greenland on both models at this point, the NAO is still not negative on either model yet.

-The troughing along the west coast does support troughing near the east coast, but the pattern will likely be too fast still at this point to support a major storm threat. However, parting cold shots with some light snows/lake effect snows will begin becoming possible after November 25th as cold continues to build just north of the Canadian border.

The GFS ensembles, during the 11-15 day forecast period, do manage to develop a –NAO while maintaining Alaskan ridging and western US troughing. This means it will remain hard to get the pattern to buckle far enough west for a major storm for the central part of the country. However, if the NAO does in fact go negative, there may be some kind of storm threat to New England and the Northern Mid Atlantic the last few days of November.

If the MJO propagates as appears likely there may be a more substantial storm threat the first week of December. Whether Greenland ridging manages to develop or not will determine if this is a snow threat to the Ohio Valley/Great Lakes or to the Northeast/Mid Atlantic.

Enjoy the nice weather this weekend!

Posted in Pattern Discussion | Leave a comment

Nor’ Easter Colder and Farther East Than Expected Dropping Major Snows in NYC. What’s Next?

Major pattern changes are occurring over the Northern Hemisphere right now and they will have major implications on the weather pattern to end the month of November.

First and foremost: A storm tracked just close enough to the Mid Atlantic coastline to throw moisture into a cold air mass, and stayed far enough off the coast to allow a colder, offshore flow to dominate, resulting in major snows for Philly, NYC and much of adjacent NJ and Southern New England today, November 7th. This deep trough however is going to be short lived for a couple of reasons:

  1. Troughing now extending into Greenland. NAO is quickly rising with just a bit of a thumb ridge extending towards Iceland. This is speeding up the flow over the N. Atlantic and is not a true –NAO anymore.
  2. High amplitude ridging extending well into Alaska has sent a very strong piece of energy crashing towards the northwest US and western Canada. This energy is quickly breaking down western ridging and will replace it with a trough, resulting in rising heights and “ridging” over the eastern US.

As this trough in the west interacts with the ridging over the Northeast US next week, the middle of the country will be in line for stormier than normal conditions:

The first likely storm to come out of this setup will mainly impact the central and northern Plains and western and northern Great Lakes Saturday into Sunday as a potent piece of energy rounds the base of the western US trough and allows it to briefly take on a negative tilt over the northern Rockies this weekend, as shown above on the European model. Gulf moisture will be somewhat limited, however the depth of the trough combined with the temperature differential, seen in the bottom right image, the storm will be tapping should result in a moderately strong storm with some potential for accumulating snows in parts of the upper Midwest Saturday into Sunday. Severe thunderstorm prospects don’t seem too significant closer to the Mississippi and farther south due to warm temperatures aloft, but may be something to watch as well. The strong low level wind fields ahead of this system may support a squall line with strong winds, even if convection doesn’t become too intense.

As the trough continues to move east and runs into an upper level ridge over the Northeast US, it may take on enough of a negative tilt near the Mississippi River on Tuesday, as shown above, before shearing out to causing another way of low pressure to ride up the cold front, this time farther east.

Due to the very positive AO and NAO, noted by much lower heights than normal from northern Canada to Iceland, any storm will likely track up the west side of the Appalachian mountains. The whole trough will gradually be shearing out as it treks east towards the Great Lakes and Ohio Valley, however, this low pressure system may be enough to enhance the severe threat Monday-Tuesday over parts of the Ohio Valley, and bring a snow threat to areas from Missouri northeast towards parts of the Great Lakes.

When looking at some individual GFS ensemble members valid Tuesday morning, it is apparent that much uncertainty exists, with several members bringing a very weak area of low pressure up the front near the Appalachians, while other members track a low pressure near Chicago.

Given the shearing out of the trough as it moves east which supports a weaker storm…and the strong +AO/NAO which support a storm cutting into the Great Lakes…I think a balanced approach at this point is the best option, with my forecast currently calling for a weak wave of low pressure to develop over the deep south and ride northeast to near Cleveland, with some potential for snow from Missouri into the Great Lakes. However, this is a low confidence solution and I will be watching for trends one way or another over the coming days.

Rolling forward, the next storm threat will come from the piece of energy poised to move out of the Southwest US in the above image off the European Ensembles, valid next Wednesday morning.

This piece of energy will likely have minimal impacts as one heads east of the Rockies however:

-In the above image, note the extremely strong +AO

-Note the Gulf of Alaska vortex re-emerging.

-Note how the geopotential height lines are beginning to tighten from south of AK to Greenland.

This all points to the polar branch of the jet stream tending to stay farther north than normal near the end of next week, meaning any storm coming out of the southwest will have little cold air to tap into. However, this possible weather maker will be watched over the next several days.

As we look towards the latter half of November, it appears as though a more zonal flow with less stormy and warmer than average temperatures will take hold over the eastern half to two thirds of the nation…With the PNA remaining negative and the NAO and AO both expected to remain positive through at least the third week of the month, cold air will keep dumping into the western US and there will be little to force the cold air east, meaning warmer conditions will prevail over the east.

How long will this warm tranquil pattern last? All indications are the pattern will begin taking hold towards the end of next week, with the only potential blip being the possible “storm” moving out of the southwest towards the end of next week and heading northeast. It then appears that the telleconnections, shown above, will not favor significant cold or storminess east of the Plains through at least November 20th.

With the MJO diving into the “circle of death” currently and expected to remain there for at least the next two weeks, there is no indication of the western US troughing breaking much before Thanksgiving.

Thus, it appears reasonable at this time to say that after next week, a period of warm and somewhat dry weather will take hold over the eastern US for the foreseeable future.

Posted in Pattern Discussion, Storm Speculation | Leave a comment

Another Nor’ Easter Wednesday-Thursday. Accumulating Snows Somewhere, but Where?

A current look at the upper level pattern shows a pattern coming together supporting another Nor’Easter with impacts to the eastern Mid-Atlantic through New England Wednesday and Thursday of this week.

A ridge of high-pressure along the west coast of the US is combining with a modest –NAO ridge over eastern Greenland and 50/50 low (the remnants of Sandy) to keep a trough over the eastern US. A piece of shortwave energy, circled in red, is rounding the base of this trough today and will move off the east coast tomorrow. Off the east coast, this trough will phase with the next incoming piece of energy and result in a deepening storm off the Mid-Atlantic coast:

When one looks at the above map, valid early Wednesday morning off the American GFS model, it is apparent that the two pieces of energy, one off the southeast coast, and another rounding the base of the trough over the US, are close to “phasing,” or combining with one another.

Another look at the map reveals why this storm will track farther off the east coast than earlier model projections:

  1. The western US ridging is gradually weakening and is displaced east by a large incoming piece of energy towards the northwest US.
  2. The remnants of Sandy, acting as a “50/50” low are displaced west, closer to 60W, not near the more traditional 50N, 50W position.
  3. The –NAO is quickly weakening, with little ridging over Greenland at this point.

So, while the storm will phase and deepen close enough to the US coastline for impacts to be felt, the trough will be pulling out to the east as it happens, meaning impacts will be somewhat limited and will struggle to reach well inland.

With that said, what are some potential impacts?

When looking at wind gust potential Wednesday evening, due to a tight pressure gradient between the decently strong Nor’Easter tracking well off the Mid-Atlantic coast and just off of Cape Cod and a large high pressure stretching from northern New England towards the Ohio Valley, the potential exists for 50-60MPH wind gusts near the coast line. Right now the low will likely track far enough east to limit impacts from New Jersey points south, however the potential will exist for 50+MPH wind gusts from Long Island towards Southern and Coastal New England.

These winds will be able to pile up 2-4’ of water along the coast from NJ northward towards much of New England. Although these values are much less than what occurred with Sandy, Sandy significantly damaged dune protection along the coastline and the infrastructure remains weak in the Sandy damage area, meaning that potential additional power outages from wind and coastal flooding appear likely Wednesday into Thursday from coastal NJ northward towards coastal New England, including Long Island and New York City.

Snowfall:

The airmass ahead of the upcoming Nor’Easter will be seasonably cool across much of the east coast. However, due to the weakening –NAO and weakening western US troughing, the cold air may be dis-lodged fairly easily as the storm brings in warm air off the ocean.

Recent GFS and Euro runs show differences in temperatures across the region on Wednesday:

GFS:

Euro:

The GFS has much less cold air over the eastern US than the Euro, with the Euro showing a large area of sub-freezing 850mb (5000’) temperatures over the eastern US. The question is which camp wins out?

When looking at the upper level projections from the two models valid Wednesday morning (with surface features imposed on top) one can see that the Euro is a bit farther east with the initial low pressure area…and a bit stronger with ridging over Northern New England, which is pumping cold air down the Appalachians. The Euro is a bit more amplified with western US ridging and a tad deeper with the eastern US trough.

As we roll the models forward to Thursday morning we see key differences in the track and strength of the low pressure area. The Euro shows a slightly deeper area of low pressure, with the retreating high pressure north of the system remaining stronger than the GFS depiction. The GFS also tucks the low much closer to the east coast, allowing the warm flow off the Atlantic to eat away at the cold air from New England south into the Mid Atlantic.

Which solution was right? In my previous post and earlier in this post I argued that the pattern argues for a farther east solution. The Euro has the UKMET on its side with the farther east track, with the Canadian model slower and farther west, but also well south, allowing a more dominant northerly flow to persist over the Mid-Atlantic and New England.

Given the synoptic reasoning discussed above, I’d give the nod to the slightly farther east and faster solution. Right now the Euro, UKMET and Canadian generally show 850mb temps of 0 to -3C across the region during the storm. This argues for higher elevation snows and rain closer to the coast.

As for snow amounts, things are always a bit hairy this far out.

The most recent GFS run, which did trend a bit east with the storm from the afternoon run posted above, shows strong mid-level frontogenesis setting up from the coastal Mid-Atlantic into southern and eastern New England Wednesday afternoon through Wednesday night, setting up the potential for moderate to heavy precipitation rates.

Indeed, the model shows very strong upward motion at around 18,000 feet above the ground in that region at that timeframe, gradually moving north and west and weakening Wednesday night. Thus, this seems like a short to medium duration (8-12 hours) moderate to heavy precip event near the coast, with lighter amounts farther west. Models are generally spitting out up to one inch of liquid near the coast from Long Island into Southern New England with amounts of .5-.75” extending up to 100 miles inland. However, the trend is for lighter amounts in general and will trend the forecast in this direction.

Given I expect the higher elevations to be mostly snow from the Mid Atlantic northward, this argues for a swath of 6-12” type snow amounts in the higher terrain, generally above 750’ in New England to 1000’+ over the Mid Atlantic. Near the coast, as the storm pulls away, lower elevations may change to snow in the Mid-Atlantic. However, heavier snow amounts will likely lie in the more elevated suburbs of the major I-95 cities from DC-Baltimore points northeast along that corridor. In New England, a coastal front will likely set up and keep much of southeastern NH, eastern MA and RI rain until the storm pulls away, when a brief changeover is possible. Again though, given the general eastward trend with this system, I will temper the westward extent of snows for this forecast.

With that said, my take on snow amounts:

Posted in Storm Forecasts | Leave a comment

Another East Coast Storm on the Way?

A current look at the upper level pattern across our hemisphere shows that significant blocking is still occurring, with several of our models developing a significant east coast storm for the middle of next week due to this blocking. Let’s talk about some of the highlights on the current map, posted above:

  1. Strong –NAO blocking remains in place over Greenland. A large trough of low pressure, partly associated with the remnants of Hurricane Sandy is located over the northeast US and is drifting northeast. The block will pin this feature near Newfoundland, allowing it to act as a blocking “50/50” low.
  2. Strong ridge of high pressure over northeast Asia is forcing a deep upper level low pressure over the Gulf of Alaska. This feature is expected to persist.
  3. The upper low over the Gulf of Alaska is attempting to dig south, resulting in ridging to the east of it.
  4. The flow off the Pacific into the northwest US is still extremely fast and flat. Will the amplifying Gulf of Alaska low pressure allow ridging to build over the western US, making it easier for the pattern to buckle over the eastern US in a few days?

As we take a look at the GFS and European ensemble means, valid Monday morning, we see this anticipated pattern taking hold. The Upper low currently over the northeast is slowly drifting north, while the Gulf of Alaska upper low/trough is amplifying ridge over the western US. The NAO remains negative, and this supports a trough over the eastern US.

At this point however, the upper low north of New England prohibits shortwaves from taking on a negative tilt until they are well off the east coast, meaning they don’t spin up a storm. However, there are two “new” shortwaves, circled on the above image, diving down into the newly amplified eastern US trough.

As we roll the ensembles out to Wednesday morning, we see that a significant trough is shown over the eastern US. –NAO blocking and a 50/50 low are clearly in place on both models…the PNA is quickly going negative on both of the ensembles at this point, however neither model allows the strong Pacific flow to overtake the western ridging before this point in time. The result is a very strong negatively tilted trough over the eastern US, with a clear storm signal off the Mid-Atlantic coast on Wednesday.

When taking a look down at what the two sets up ensembles show at the surface Wednesday morning, both ensemble means are in good agreement on a deepening area of flow pressure off the southeast US coast, with some cold air in place over the northeastern US and interior Mid Atlantic. This matches what the 500mb plots shown two images up imply.

When rolling the surface comparison forward to Thursday morning, one can see that while the ensembles are in similar agreement in tracking a moderately strong Nor’ Easter up the east coast Wednesday through Thursday, they are not quite in agreement on track. The GFS ensembles in the top right are a bit farther northeast than the Euro ensembles and a bit faster. The GFS ensemble mean is also several MB deeper with the low pressure than the Euro ensembles, indicating potentially less disagreement between ensemble members than the Euro ensembles.

A look at the individual GFS ensembles members valid Thursday morning however shows some significant disagreements between members. Several members take the low west towards NY state, while others slide farther out to sea. Several are also near the ensemble mean.

When trying to determine which solution is the better solution, one must look at the pieces that are anticipated to come together for a storm:

When looking at the GFS valid Tuesday morning, a day before the coastal storm is expected to begin deepening, one can see two significant pieces of energy in the eastern US trough. One is a sharp shortwave over AL/GA, another is a very potent system diving into the Upper Midwest.

As we roll out the GFS prediction another day to Wednesday morning, one can see that the initial shortwave has taken on a negative tilt, along with the whole trough, off the southeast coast, resulting in surface low pressure formation. The model is also showing the potent energy rounding the base of the trough and attempting to phase with the energy off the southeast US coast.

By Wednesday evening, the GFS has completely phased the two pieces of energy, resulting in a deep upper level closed low (and sfc low pressure) on the Mid Atlantic coast. However, the model is also completely smashing western US ridging by this point and has broken down the –NAO.

When comparing this to the other operational models, we note some similarities and differences:

  1. All four models have broken down the –NAO/50-50 low combination, with a thin strip of ridging extending into Northeast Canada.
  2. The models have all weakened western US ridging, but not to the same extent. The GFS model and Canadian models appear to be the flattest with the western US pattern at this point, and these two models have the weakest –PNA/Alaskan ridging at this point.
  3. All the models do have a storm near the east coast of the US at this point. The GFS is farthest west, over southern New England, while the Canadian and UKMET are similar in track, just south of Cape Cod. The Euro is farther southwest but likely wouldn’t track as far west as the GFS after this.

Thus, there seem to be a few things that dictate the track of the low pressure system:

  1. When the two pieces of energy phase. Is it off the southeast coast? Off the Mid-Atlantic coast? Off the New England coast? A later phase results in a track farther southeast.
  2. How quickly western US ridging breaks down. A quicker breakdown likely results in a track farther off the coast.
  3. How quickly does the negative NAO break down? If it breaks down quicker, the storm will be able to hook farther NW after phasing. A slower break down suppresses the track farther east.

Given the PNA is currently only slightly positive and forecast to quickly go negative this week, I’d slightly favor a quicker break-down of western US ridging:

Given the NAO is currently negative but already trending positive, and the expectation of it to continue rising, I think the models are currently generally accurate in their depiction the weakening –NAO as the storm moves up the coast:

With all this said a track near the ensemble means, and closer to the Canadian/UKMET, likely near or just outside the 40/70 benchmark and continuing NNE just off the southern New England coast, seems most reasonable at this time. However, many models do show the trough becoming negatively tilted west of the Apps, which is a warning that some westward shift is possible, but not guaranteed. Regardless:

What this means:

-Enough cold air will likely remain in place for some snow in the inland Mid Atlantic. However, it is uncertain how much moisture is thrown well inland. It is also uncertain whether or not enough cold air is in place near the coast for significant snows, given the rising NAO and falling PNA.

-The low pressure system will likely deepen below 990mb, with a strong ridge of high pressure to the north. Although not nearly as strong as Sandy, this will be enough for gale or storm force winds blowing onshore over the Mid-Atlantic and New England Tuesday through Thursday. Moderate coastal flooding is possible in already hard hit areas. Some minor wind damage is also possible near the shore line.

I will have another update with specific impacts Sunday night or Monday morning.

Posted in Pattern Discussion, Storm Forecasts, Storm Speculation | Leave a comment